

The association between microbial community and ileal gene expression on intestinal wall thickness alterations in chickens
- PMID: 32241465
- PMCID: PMC7587722
- DOI: 10.1016/j.psj.2019.10.029
The association between microbial community and ileal gene expression on intestinal wall thickness alterations in chickens
Abstract
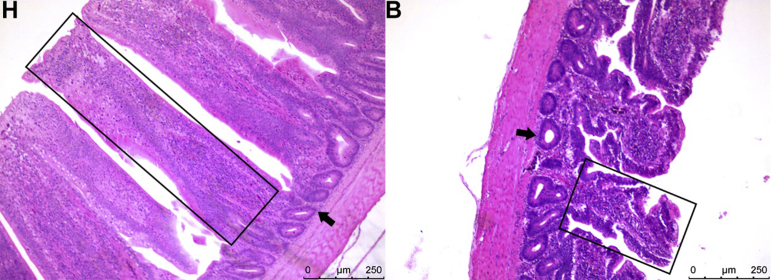
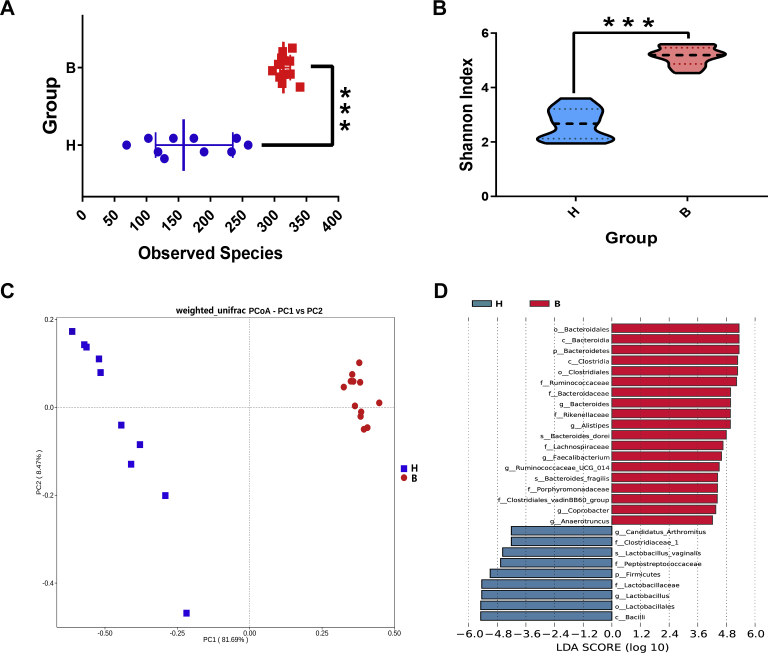
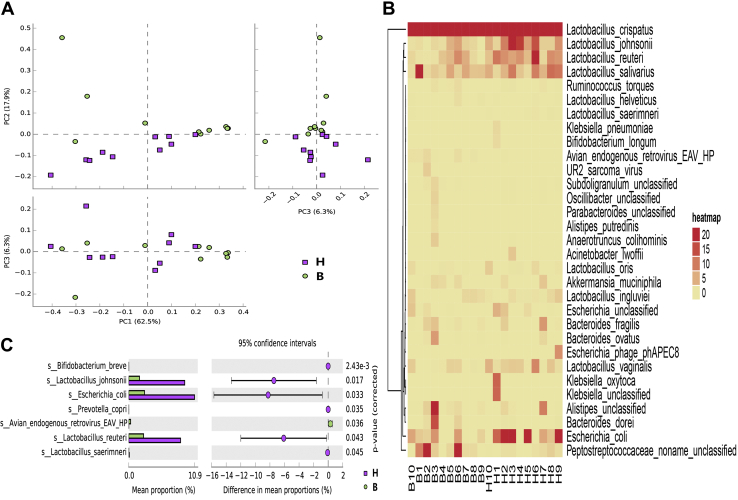
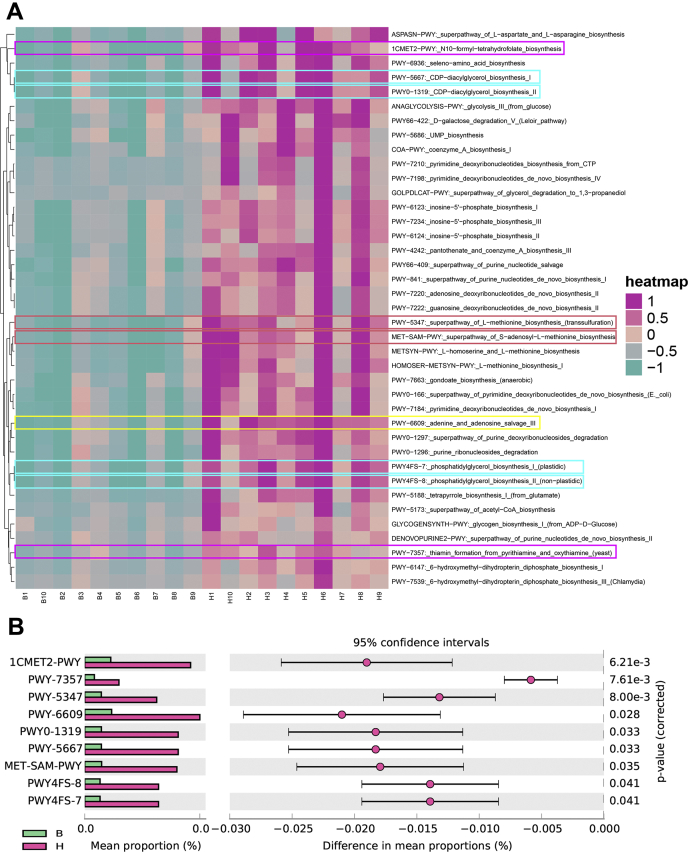
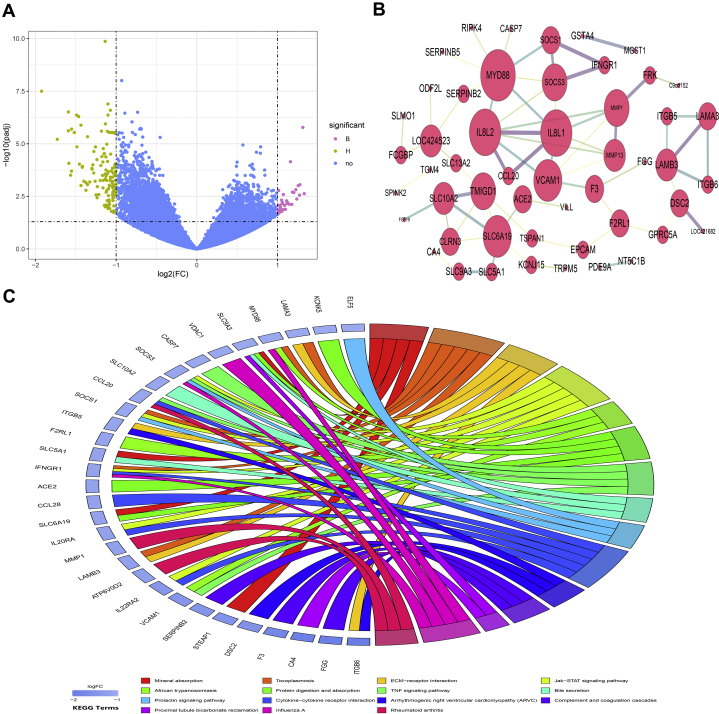
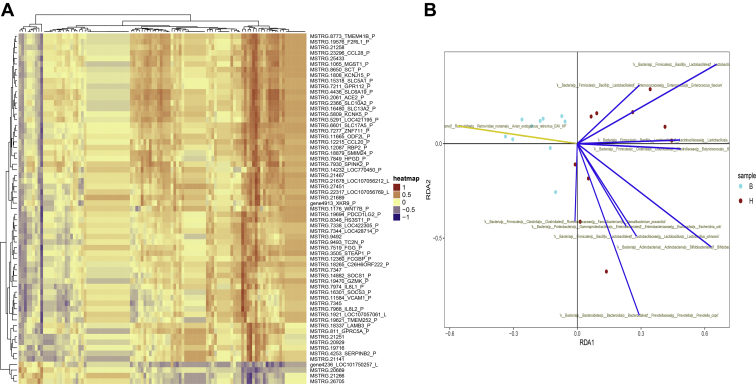
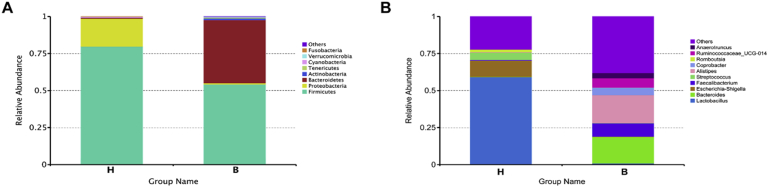
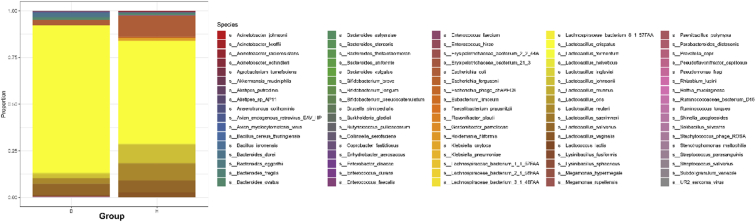
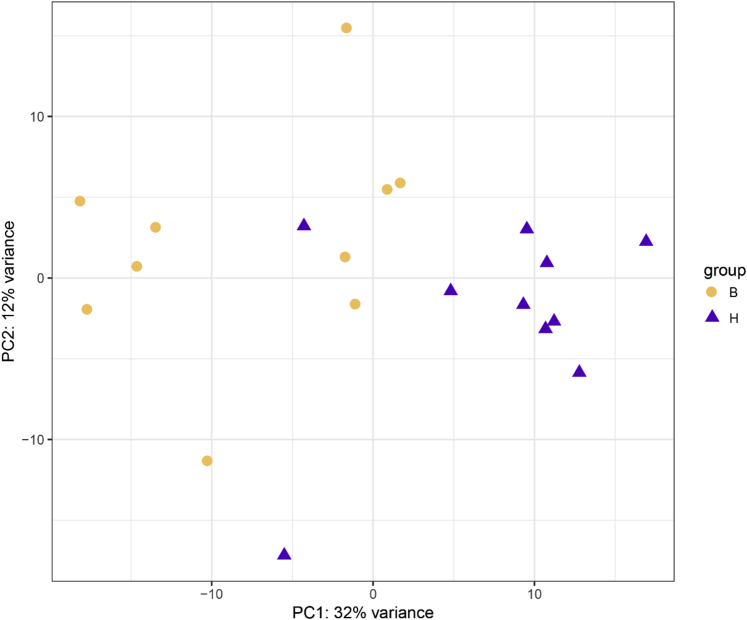
The dynamic development of the animal intestine with a concurrent succession of microbiota and changes in microbial community and metabolite spectrum can exert far-reaching effects on host physiology. However, the precise mechanism of mutual response between microbiota and the gut is yet to be fully elucidated. Broilers with varying developmental degrees of intestinal wall thickness were selected, and they were divided into the thick group (H type) and the thin group (B type), using multiomics data integration analysis to reveal the fundamental regulatory mechanisms of gut-microbiota interplay. Our data showed, in broilers with similar body weight, the intestinal morphological parameters were improved in H type and the diversity of microbial communities is distinguishable from each other. The beneficial bacteria such as Bifidobacterium breve was increased whereas avian endogenous retrovirus EAV-HP was decreased in the H type compared with the B type. Furthermore, microbial metabolic potentials were more active, especially the biosynthesis of folate was improved in the H type. Similarly, the consolidation of absorption, immunity, metabolism, and development was noticed in the thick group. Correlation analysis indicated that the expression levels of material transport and immunomodulatory-related genes were positively correlated with the relative abundance of several probiotics such as B. breve, Lactobacillus saerimneri, and Butyricicoccus pullicaecorum. Our findings suggest that the chickens with well-developed ileal thickness own exclusive microbial composition and metabolic potential, which is closely related to small intestinal morphogenesis and homeostasis.
Keywords: broiler; ileal transcriptome; immune regulation; intestinal thickness; microbiota.
Copyright © 2019. Published by Elsevier Inc.
Figures
Similar articles
-
Modulation of broiler gut microbiota and gene expression of Toll-like receptors and tight junction proteins by diet type and inclusion of phytogenics.Poult Sci. 2019 May 1;98(5):2220-2230. doi: 10.3382/ps/pey588. Poult Sci. 2019. PMID: 30597072
-
Association of host genetics with intestinal microbial relevant to body weight in a chicken F2 resource population.Poult Sci. 2019 Sep 1;98(9):4084-4093. doi: 10.3382/ps/pez199. Poult Sci. 2019. PMID: 31330021
-
Sodium butyrate improved performance while modulating the cecal microbiota and regulating the expression of intestinal immune-related genes of broiler chickens.Poult Sci. 2017 Sep 1;96(11):3981-3993. doi: 10.3382/ps/pex218. Poult Sci. 2017. PMID: 29050425
-
Dietary live yeast and mannan-oligosaccharide supplementation attenuate intestinal inflammation and barrier dysfunction induced by Escherichia coli in broilers.Br J Nutr. 2016 Dec;116(11):1878-1888. doi: 10.1017/S0007114516004116. Epub 2016 Dec 19. Br J Nutr. 2016. PMID: 27989252
-
Chicken intestinal microbiota function with a special emphasis on the role of probiotic bacteria.Pol J Vet Sci. 2014;17(2):385-94. doi: 10.2478/pjvs-2014-0057. Pol J Vet Sci. 2014. PMID: 24988871 Review.
Cited by
-
Effect of Selenium Nanoparticles and Chitosan on Production Performance and Antioxidant Integrity of Heat-Stressed Broiler.Biol Trace Elem Res. 2023 Apr;201(4):1977-1986. doi: 10.1007/s12011-022-03262-y. Epub 2022 Jun 8. Biol Trace Elem Res. 2023. PMID: 35676590
-
Impact of feed additives and host-related factors on bacterial metabolites, mucosal integrity and immune response in the ileum of broilers.Vet Res Commun. 2023 Dec;47(4):1861-1878. doi: 10.1007/s11259-023-10135-9. Epub 2023 May 9. Vet Res Commun. 2023. PMID: 37160636 Free PMC article.
-
The Effect of Necrotic Enteritis Challenge on Production Performance, Cecal Microbiome, and Cecal Tonsil Transcriptome in Broilers.Pathogens. 2022 Jul 27;11(8):839. doi: 10.3390/pathogens11080839. Pathogens. 2022. PMID: 36014961 Free PMC article.
-
Selenium Nanoparticles Improved Intestinal Health Through Modulation of the NLRP3 Signaling Pathway.Front Nutr. 2022 Jul 5;9:907386. doi: 10.3389/fnut.2022.907386. eCollection 2022. Front Nutr. 2022. PMID: 35911113 Free PMC article.
-
Managing Gut Microbiota through In Ovo Nutrition Influences Early-Life Programming in Broiler Chickens.Animals (Basel). 2021 Dec 7;11(12):3491. doi: 10.3390/ani11123491. Animals (Basel). 2021. PMID: 34944266 Free PMC article. Review.
References
-
- Bai X., Moraes T.F., Reithmeier R.A.F. Structural biology of solute carrier (SLC) membrane transport proteins. Mol. Membr. Biol. 2017;34:1–32. - PubMed
-
- Boussenna A., Goncalves-Mendes N., Joubert-Zakeyh J., Pereira B., Fraisse D., Vasson M.P., Texier O., Felgines C. Impact of basal diet on dextran sodium sulphate (DSS)-induced colitis in rats. Eur. J. Nutr. 2015;54:1217–1227. - PubMed
-
- Buchfink B., Xie C., Huson D.H. Fast and sensitive protein alignment using DIAMOND. Nat. Methods. 2015;12:59–60. - PubMed
-
- Chichlowski M., Croom W.J., Edens F.W., McBride B.W., Qiu R., Chiang C.C., Daniel L.R., Havenstein G.B., Koci M.D. Microarchitecture and spatial relationship between bacteria and ileal, cecal, and colonic epithelium in chicks fed a direct-fed microbial, PrimaLac, and salinomycin. Poult. Sci. 2007;86:1121–1132. - PubMed
MeSH terms
Substances
LinkOut - more resources
Full Text Sources
Research Materials
Miscellaneous
