. 2020 Apr 22;40(17):3478-3490.
doi: 10.1523/JNEUROSCI.0255-20.2020. Epub 2020 Apr 2.

The Neural Origin of Nociceptive-Induced Gamma-Band Oscillations

Affiliations

The Neural Origin of Nociceptive-Induced Gamma-Band Oscillations

Lupeng Yue et al. J Neurosci. .

Abstract

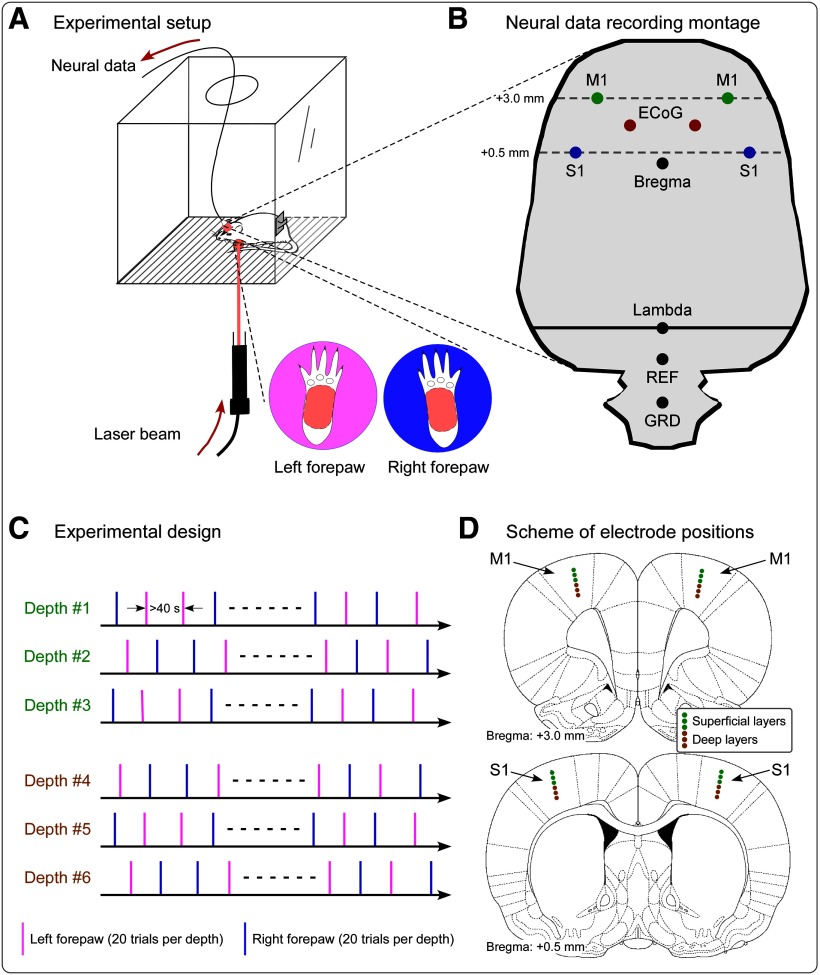
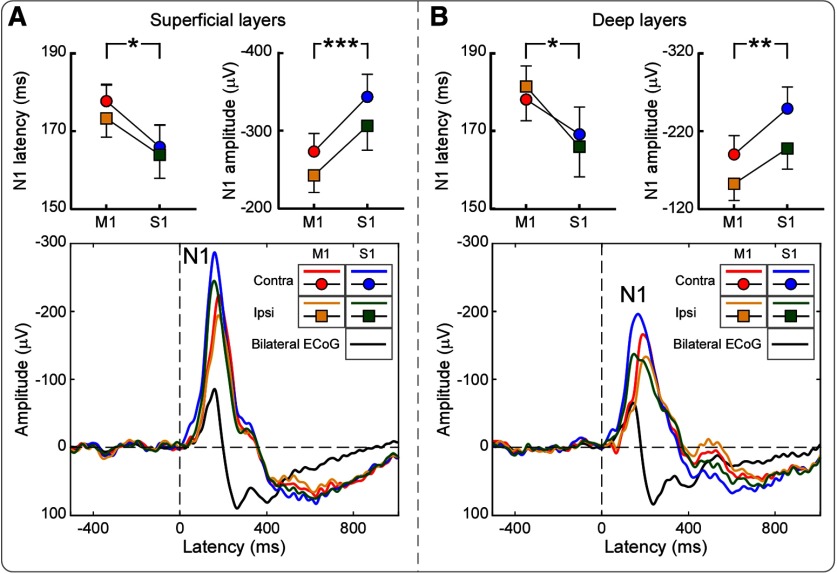
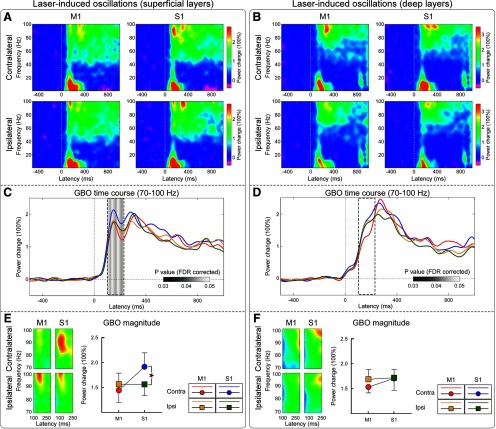
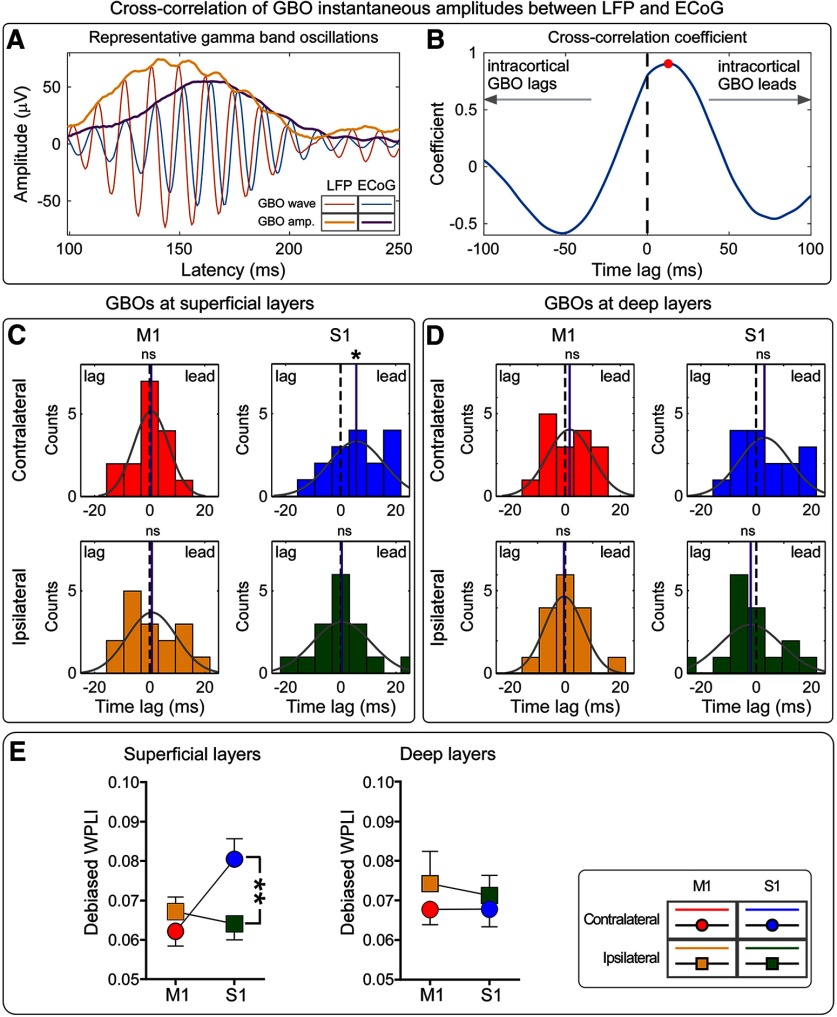
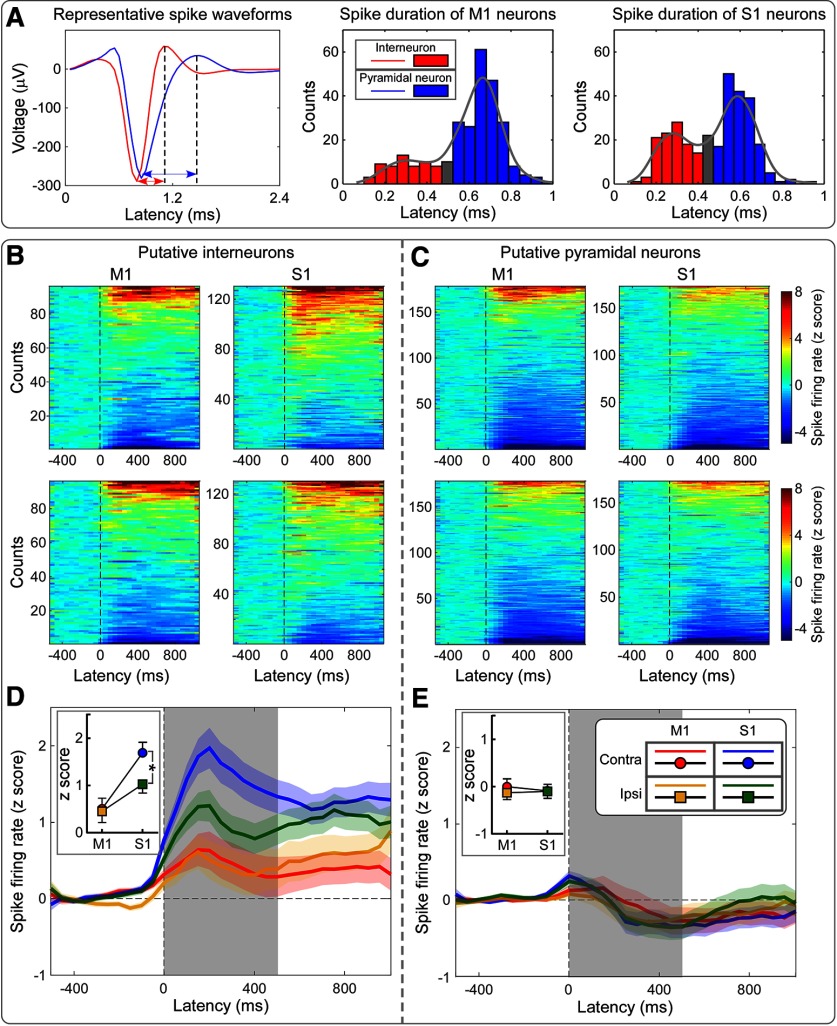
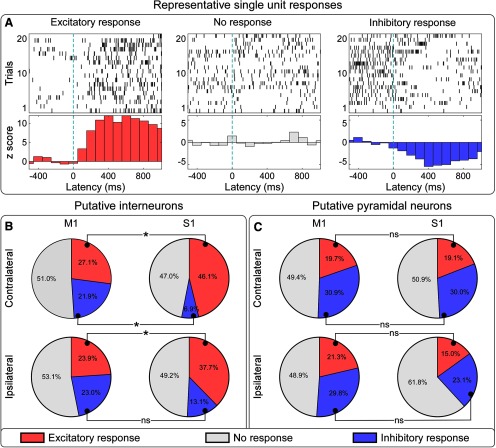
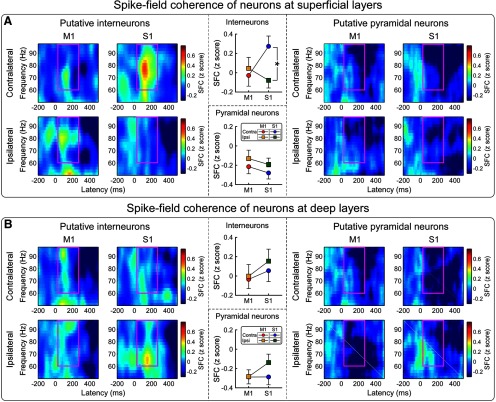
Gamma-band oscillations (GBOs) elicited by transient nociceptive stimuli are one of the most promising biomarkers of pain across species. Still, whether these GBOs reflect stimulus encoding in the primary somatosensory cortex (S1) or nocifensive behavior in the primary motor cortex (M1) is debated. Here we recorded neural activity simultaneously from the brain surface as well as at different depths of the bilateral S1/M1 in freely-moving male rats receiving nociceptive stimulation. GBOs measured from superficial layers of S1 contralateral to the stimulated paw not only had the largest magnitude, but also showed the strongest temporal and phase coupling with epidural GBOs. Also, spiking of superficial S1 interneurons had the strongest phase coherence with epidural GBOs. These results provide the first direct demonstration that scalp GBOs, one of the most promising pain biomarkers, reflect neural activity strongly coupled with the fast spiking of interneurons in the superficial layers of the S1 contralateral to the stimulated side.SIGNIFICANCE STATEMENT Nociceptive-induced gamma-band oscillations (GBOs) measured at population level are one of the most promising biomarkers of pain perception. Our results provide the direct demonstration that these GBOs reflect neural activity coupled with the spike firing of interneurons in the superficial layers of the primary somatosensory cortex (S1) contralateral to the side of nociceptive stimulation. These results address the ongoing debate about whether nociceptive-induced GBOs recorded with scalp EEG or epidurally reflect stimulus encoding in the S1 or nocifensive behavior in the primary motor cortex (M1), and will therefore influence how experiments in pain neuroscience will be designed and interpreted.

Keywords: biomarkers; gamma-band oscillations; interneurons; pain; primary motor cortex; primary somatosensory cortex.


Figures

Figure 1.
Figure 1.
Experimental design and recording setup. A, During the recording sessions, rats were free to move within a plastic chamber (30 × 30 × 30 cm3). When the animal was spontaneously still, laser stimuli were delivered on the plantar surface of either the left or the right forepaw through gaps on the floor of the chamber. C, In each recording session, the neural activity was measured at one of six cortical depths. In each session, we delivered 20 laser pulses to the right forepaw and 20 laser pulses to the left forepaw, in pseudorandom order. The interval between two consecutive stimuli was never <40 s. B, D, Scheme showing the position of electrodes for the simultaneous intracortical and epidural recording. B, Positioning of the four microelectrodes for the recording of LFPs and single-unit activity in the S1 and M1 contralateral and ipsilateral to the stimulation site, as well as of epidural electrodes. Intracortical microelectrodes were placed according to stereotaxic coordinates in the following positions [expressed in respect to the bregma (in mm); positive x-axis and y-axis values indicate right and anterior locations, respectively]: left S1: x = −4, y = 0.5; right S1: x = 4, y = 0.5; left M1: x = −3, y = 3; right M1: x = 3, y = 3. Epidural electrodes were placed in the following positions: left ECoG: x = −1.5, y = 1.75; right ECoG: x = 1.5, y = 1.75. Reference (REF) and ground (GRD) electrodes were placed 2 and 4 mm caudally to the lambda, on the midline. D, Intracortical neural data were recorded at six different depths. Electrode positions measuring data from superficial and deep cortical layers are marked in light green and brown, respectively.
Figure 2.
Figure 2.
Group-level laser-evoked field potentials in the time domain. Data were simultaneously recorded intracortically and epidurally. A, B, Intracortical data were recorded at superficial (A) and deep (B) layers from the bilateral S1 and M1 (colored waveforms). Epidural data (signal averaged across two electrodes; black waveform) were recorded from two electrodes placed in between the S1 and M1. For all recording sites, the largest LFP response was a negative wave peaking at ∼170 ms (i.e., N1 wave). N1 amplitude was overall larger in S1 than in M1, as well as larger in the hemisphere contralateral than ipsilateral to laser stimulation. N1 latency was shorter in S1 than in M1, in both hemispheres. *p < 0.05, **p < 0.01, ***p < 0.001. Error bars represent SEM.
Figure 3.
Figure 3.
A–F, Group-level time–frequency distributions of laser-induced LFP oscillations recorded from superficial (A, C, E) and deep (B, D, F) layers of the bilateral S1 and M1. A, B, Broadband time–frequency responses recorded from the S1 and M1 (columns) contralateral and ipsilateral to the stimulation side (rows). C, D, Time courses of the power of GBOs were obtained by averaging time–frequency responses elicited by laser stimulation at 70–100 Hz. Gray-shaded areas indicate p values (p < 0.05, FDR corrected) of the hemisphere × brain region interaction at each time point. Note that only GBOs measured from superficial cortical layers show a clear interaction in the early part of the response (100–220 ms). E, F, GBOs measured in superficial layers (100–220 ms) were larger in contralateral S1 than in contralateral M1, while similar in ipsilateral S1 and bilateral M1. No differences were observed when assessing the magnitude of GBOs measured at deep cortical layers. *p < 0.05. Error bars represent SEM.
Figure 4.
Figure 4.
The temporal sequence and phase relationship between GBOs measured intracortically and epidurally. A, Representative GBOs (time, 100–250 ms; frequency, 70–100 Hz) recorded intracortically and epidurally are displayed in red and blue, respectively; their instantaneous amplitudes are displayed in orange and purple, respectively. B, Cross-correlation coefficients of the instantaneous amplitudes of representative intracortical and epidural GBOs. The maximal coefficient occurs at a time lag larger than zero (i.e., red dot), indicating that the instantaneous amplitude of intracortical GBOs leads that of epidural GBOs. C, D, Distribution of time lags at which the cross-correlation coefficients between intracortical and epidural GBOs is maximal. Data are recorded from S1 and M1, contralateral and ipsilateral to stimulation side (C, superficial layers; D, deep layers). For each plot, the gray curve represents the normal distribution fitting; the mean of each fitting is marked with a purple line. Wilcoxon rank sum test statistics indicated that only the instantaneous amplitude of GBOs measured from the superficial layers of the contralateral S1 lead that of epidural GBOs. Statistical results are summarized in Extended Data Figure 4-1. E, The debiased WPLI measures the phase relationship between intracortical and epidural GBOs. There was strong evidence that WPLI values calculated for GBOs measured at superficial cortical layers were modulated by an hemisphere × brain region interaction: they were larger in contralateral than in ipsilateral S1, but were similar in contralateral and ipsilateral M1. In contrast, there was no evidence for any effect of recording site on WPLI values at deep cortical layers. Statistical results are summarized in Extended Data Figure 4-2. *p < 0.05, **p < 0.01. ns, Not significant. Error bars represent SEM.
Figure 5.
Figure 5.
Laser-evoked spikes of putative interneurons and pyramidal neurons at the four recording sites (bilateral S1 and M1). A, Representative spike waveforms of a putative interneuron and a putative pyramidal neuron are displayed in red and blue, respectively (left). Spike durations are marked using double-headed arrows. Note that the spike duration of the putative interneuron is shorter than that of the putative pyramidal neuron. Distributions of spike durations: M1, middle; S1, right. In both regions, spike durations showed a bimodal distribution, which was used to identify cells as putative interneurons (red), pyramidal neurons (blue), and unclassified neurons (gray). B, C, Spike-firing rates of putative interneurons (B) and pyramidal neurons (C) at the four recording sites. Spike-firing rates, expressed as z-scores, were normalized with respect to the baseline (i.e., 500 ms preceding the nociceptive stimulation). Units are sorted along the y-axis of each bidimensional plot according to the direction of modulation, from stimulus-induced decrease (bottom) to increase (top) of the firing rate. D, E, Mean firing rates (spike density functions) across all putative interneurons (D) and pyramidal neurons (E) at each of the four recording sites. In the first 500 ms following nociceptive stimulation, mean firing rates were larger in S1 than in M1, and were larger in contralateral S1 than in ipsilateral S1. In contrast, firing rates of pyramidal neurons were not different. Statistical results are summarized in Extended Data Figure 5-1. *p < 0.05. Error bars represent SEM.
Figure 6.
Figure 6.
Proportions of neurons showing different types of spiking responses to laser stimulation at the four recording sites. A, Representative neurons showing excitatory (left), lack of (middle), and inhibitory (right) spike responses to laser stimulation. Raw trains of single-trial spike responses are shown in the top plots, and their across-trial averages are shown in the bottom plots, where spike-firing rates are displayed as z-scores, binned in 100 ms windows, and normalized to the baseline (−500 to 0 ms relative to the laser stimulation). B, C, Percentages of neurons showing different types of spike responses to nociceptive stimulation, at each of the four recording sites (B, interneurons; C, pyramidal neurons). Excitatory, lack of, and inhibitory responses are coded in red, gray, and blue, respectively. The proportion of putative interneurons showing an excitatory response was larger in S1 than in M1, in both hemispheres. The proportion of interneurons showing an inhibitory response was smaller in contralateral S1 than in contralateral M1, but it was similar in the ipsilateral S1 and M1. In contrast, the proportion of pyramidal neurons with different types of responses was not different across the four recording sites. *p < 0.001. ns, Not significant.
Figure 7.
Figure 7.
Spike-field coherence (SFC) to test whether laser-induced increases of spike firing in bilateral S1 and M1 occurred at specific phases of the laser-induced GBOs simultaneously recorded from the brain surface. A, B, SFCs of putative interneurons (left) and pyramidal neurons (right) measured at superficial (A) and deep (B) layers. SFCs, represented as z-scores, are normalized to the baseline (i.e., 500 ms preceding the nociceptive stimulation). There was a high coherence between the spike-firing rates of interneurons in the superficial layers of contralateral S1 and the phase of epidural GBOs (60–100 Hz and 100–250 ms, marked using purple rectangles). SFCs of superficial interneurons were larger in contralateral S1 than in ipsilateral S1, but were similar in contralateral and ipsilateral M1. In contrast, SFCs of interneurons at deep layers or of pyramidal neurons at both superficial and deep layers were similar. Statistical results are summarized in Extended Data Figure 7-1. *p < 0.05. Error bars represent SEM.

Comment in

References

    1. Adesnik H, Scanziani M (2010) Lateral competition for cortical space by layer-specific horizontal circuits. Nature 464:1155–1160. 10.1038/nature08935 - DOI - PMC - PubMed
    1. Adhikari A, Sigurdsson T, Topiwala MA, Gordon JA (2010) Cross-correlation of instantaneous amplitudes of field potential oscillations: a straightforward method to estimate the directionality and lag between brain areas. J Neurosci Methods 191:191–200. 10.1016/j.jneumeth.2010.06.019 - DOI - PMC - PubMed
    1. Ainsworth M, Lee S, Kaiser M, Simonotto J, Kopell NJ, Whittington MA (2016) GABAB receptor-mediated, layer-specific synaptic plasticity reorganizes gamma-frequency neocortical response to stimulation. Proc Natl Acad Sci U S A 113:E2721–E2729. 10.1073/pnas.1605243113 - DOI - PMC - PubMed
    1. Allitt BJ, Alwis DS, Rajan R (2017) Laminar-specific encoding of texture elements in rat barrel cortex. J Physiol 595:7223–7247. 10.1113/JP274865 - DOI - PMC - PubMed
    1. Alloway KD, Smith JB, Beauchemin KJ (2010) Quantitative analysis of the bilateral brainstem projections from the whisker and forepaw regions in rat primary motor cortex. J Comp Neurol 518:4546–4566. 10.1002/cne.22477 - DOI - PMC - PubMed

Publication types