. 2020 Apr 22;40(17):3385-3407.
doi: 10.1523/JNEUROSCI.2226-19.2020. Epub 2020 Apr 2.

Treatment with Mesenchymal-Derived Extracellular Vesicles Reduces Injury-Related Pathology in Pyramidal Neurons of Monkey Perilesional Ventral Premotor Cortex

Affiliations

Treatment with Mesenchymal-Derived Extracellular Vesicles Reduces Injury-Related Pathology in Pyramidal Neurons of Monkey Perilesional Ventral Premotor Cortex

Maria Medalla et al. J Neurosci. .

Abstract

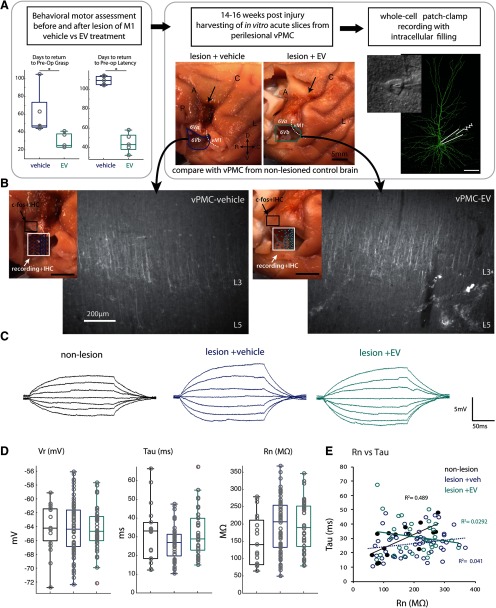
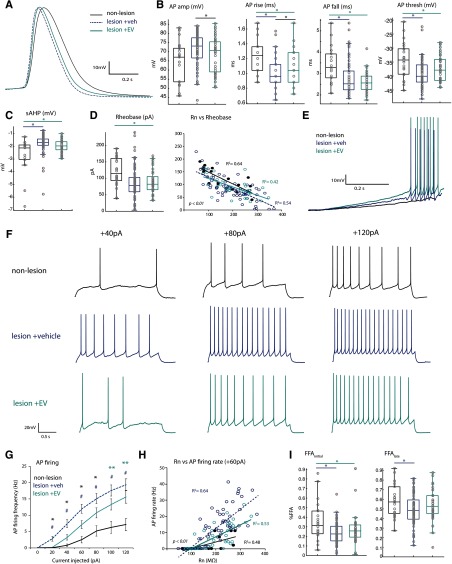
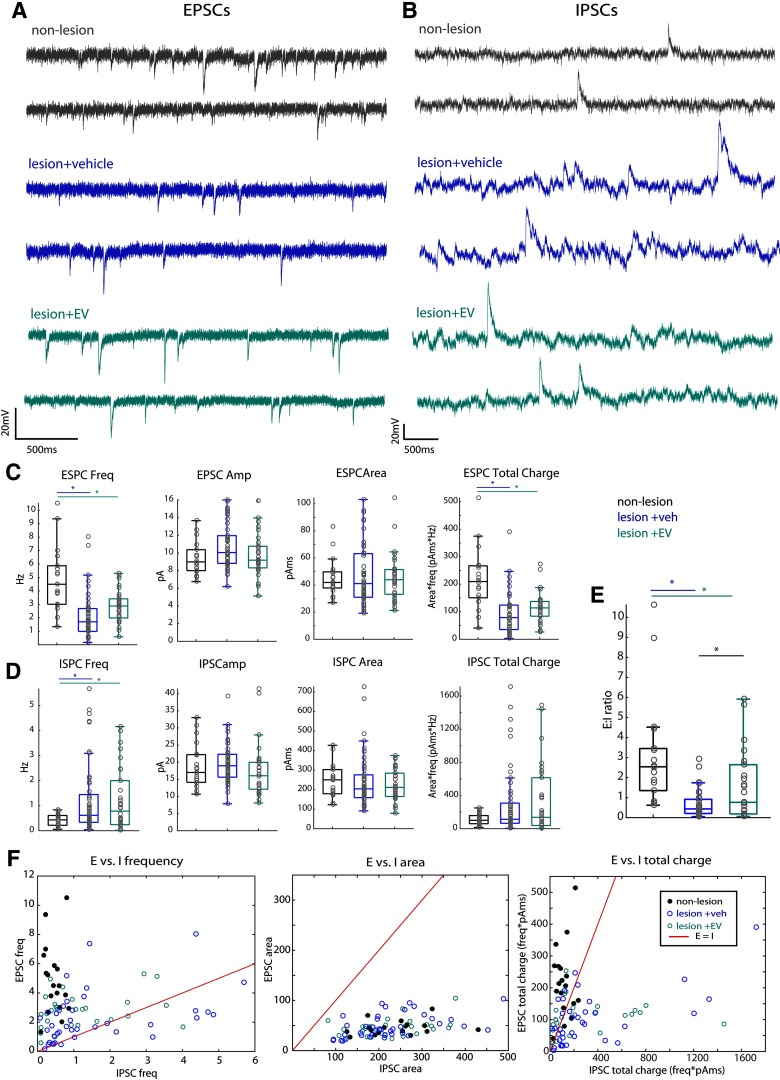
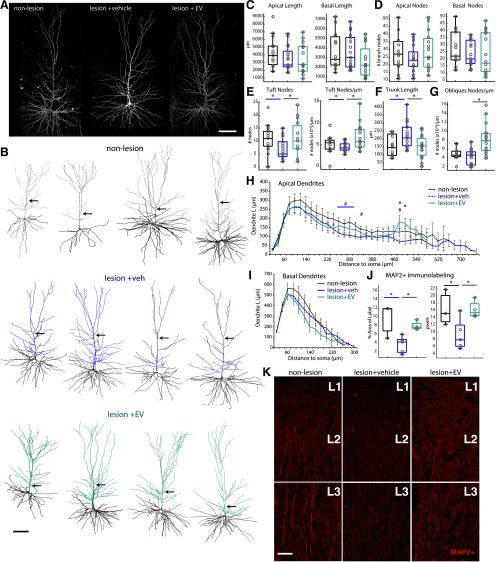
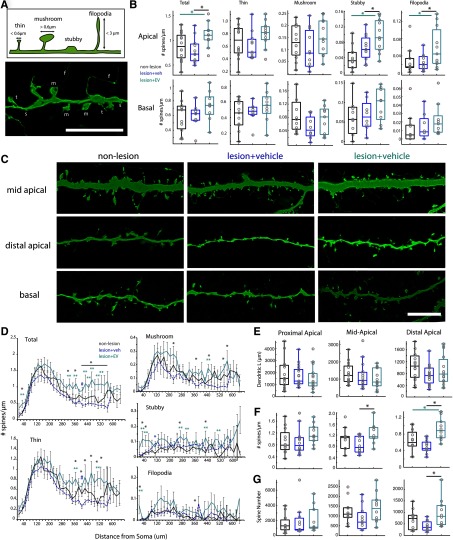
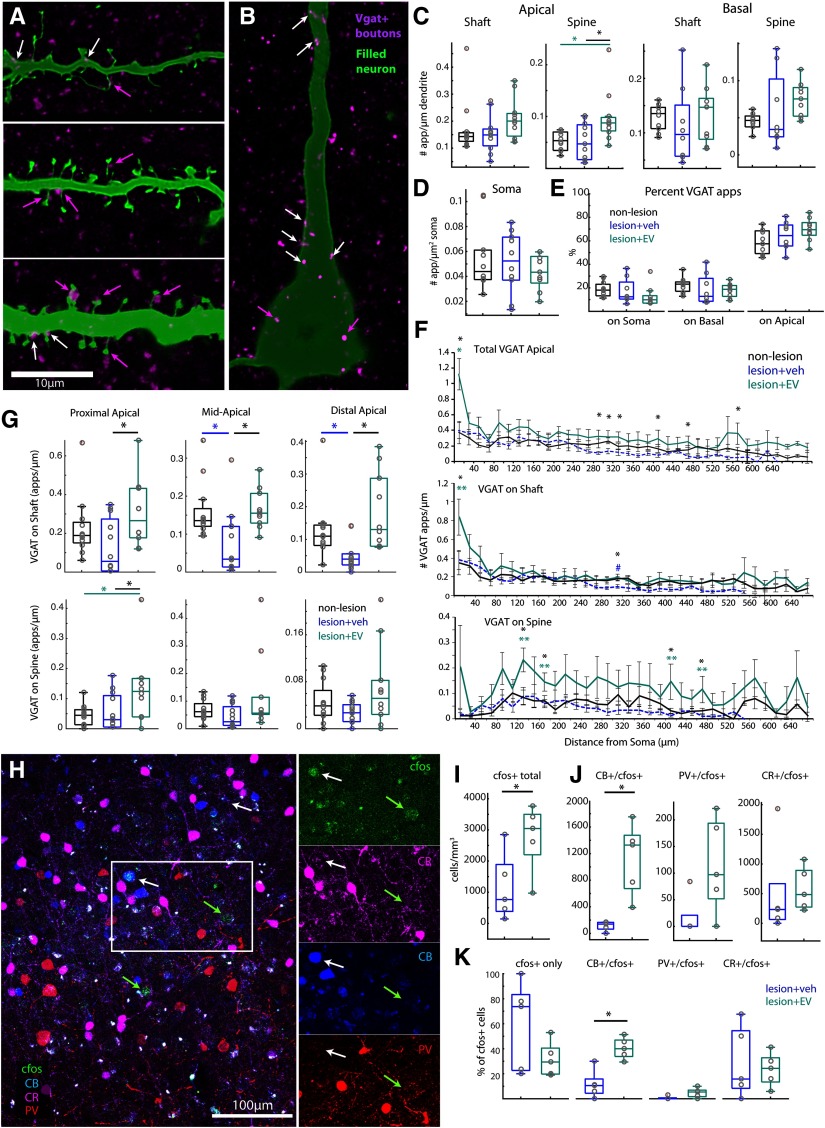
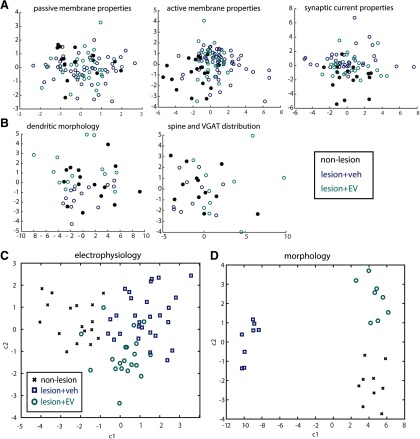
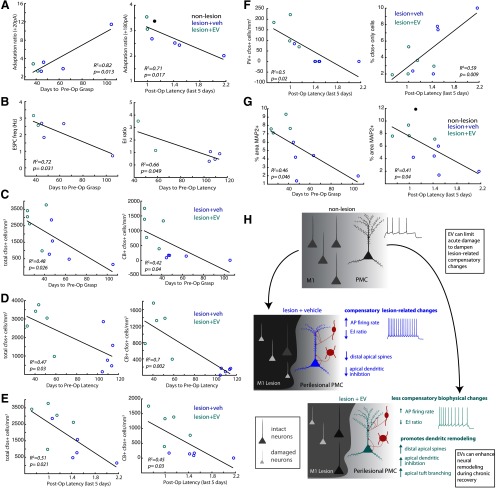
Functional recovery after cortical injury, such as stroke, is associated with neural circuit reorganization, but the underlying mechanisms and efficacy of therapeutic interventions promoting neural plasticity in primates are not well understood. Bone marrow mesenchymal stem cell-derived extracellular vesicles (MSC-EVs), which mediate cell-to-cell inflammatory and trophic signaling, are thought be viable therapeutic targets. We recently showed, in aged female rhesus monkeys, that systemic administration of MSC-EVs enhances recovery of function after injury of the primary motor cortex, likely through enhancing plasticity in perilesional motor and premotor cortices. Here, using in vitro whole-cell patch-clamp recording and intracellular filling in acute slices of ventral premotor cortex (vPMC) from rhesus monkeys (Macaca mulatta) of either sex, we demonstrate that MSC-EVs reduce injury-related physiological and morphologic changes in perilesional layer 3 pyramidal neurons. At 14-16 weeks after injury, vPMC neurons from both vehicle- and EV-treated lesioned monkeys exhibited significant hyperexcitability and predominance of inhibitory synaptic currents, compared with neurons from nonlesioned control brains. However, compared with vehicle-treated monkeys, neurons from EV-treated monkeys showed lower firing rates, greater spike frequency adaptation, and excitatory:inhibitory ratio. Further, EV treatment was associated with greater apical dendritic branching complexity, spine density, and inhibition, indicative of enhanced dendritic plasticity and filtering of signals integrated at the soma. Importantly, the degree of EV-mediated reduction of injury-related pathology in vPMC was significantly correlated with measures of behavioral recovery. These data show that EV treatment dampens injury-related hyperexcitability and restores excitatory:inhibitory balance in vPMC, thereby normalizing activity within cortical networks for motor function.SIGNIFICANCE STATEMENT Neuronal plasticity can facilitate recovery of function after cortical injury, but the underlying mechanisms and efficacy of therapeutic interventions promoting this plasticity in primates are not well understood. Our recent work has shown that intravenous infusions of mesenchymal-derived extracellular vesicles (EVs) that are involved in cell-to-cell inflammatory and trophic signaling can enhance recovery of motor function after injury in monkey primary motor cortex. This study shows that this EV-mediated enhancement of recovery is associated with amelioration of injury-related hyperexcitability and restoration of excitatory-inhibitory balance in perilesional ventral premotor cortex. These findings demonstrate the efficacy of mesenchymal EVs as a therapeutic to reduce injury-related pathologic changes in the physiology and structure of premotor pyramidal neurons and support recovery of function.

Keywords: exosomes; inhibitory neurons; mesenchymal stem cell; motor cortex; neuronal excitability; stroke.


Figures

Figure 1.
Figure 1.
Experimental design and measurement of passive membrane properties of vPMC pyramidal neurons. A, Experimental workflow: Monkeys were first behaviorally assessed using our HDT (left panel) before and after cortical injury (arrow, middle panel), as described previously (Moore et al., 2019). The monkeys were randomly assigned to receive either vehicle or EV treatment, and then the rate and degree of behavioral recovery of preoperative grasp pattern and latency were assessed. Recovery data (adapted from Moore et al., 2019) show the number of days to recover, which was fewer (faster rate) in EV compared with vehicle-treated monkeys (t test, p < 0.01). At 14-16 weeks after injury, acute slices were harvested during perfusion with Kreb's buffer from vPMC (vPMCveh vs vPMCEV). Location of tissue block harvested containing vPMC (area 6Vb) immediately ventral to the lesion (A, arrow) and the estimated boundary between vPMC (area 6Va and 6Vb) and ventral M1 (vM1) are shown on the lateral surface of rhesus monkey brain. Whole-cell patch-clamp recording and intracellular filling of layer 3 vPMCveh (n = 69 neurons from 4 monkeys) and vPMCEV (n = 39 neurons from 2 monkeys) neurons were employed. Data from vPMC were compared with neurons harvested from vPMC of nonlesionedaged-matched control brains (vPMCnonlesioned; n = 22 neurons from 2 monkeys) from a cohort of monkeys in a separate study. B, Lateral surface of brain maps (left insets) shows the sampling location and 2D plots of recorded cells (white box), and sampling location of tissue analyzed for c-fos labeling experiments (black box; n = 5 EV-treated, n = 5 vehicle-treated monkeys). Representative epifluorescence images (right panels) show coronal vPMC slices from which recordings were obtained, which were labeled with SMI-32+ after fixation to verify cytoarchitecture. Note the strong band of SMI32+ label in layer 3 (L3) and 5 (L5). The absence of large SMI32+ Betz cells in L5 is consistent with the cytoarchitecture of vPMC. C, Representative traces of voltage responses to a series of 200 ms current pulses. D, Box-and-whisker and vertical scatter plots of Vr, taum, and Rn. E, Within-group linear relationships of membrane tau versus Rn.
Figure 2.
Figure 2.
AP firing properties of vPMC pyramidal neurons are altered by lesion and EV treatment A, Representative single AP waveforms from the three groups, superimposed, showing differences in AP kinetics (rise, fall, duration at half-maximum amplitude). B, Box-and-whisker and vertical scatter plots of individual data points of single AP properties: amplitude (ANOVA Fisher's LSD post hoc, EV vs veh, p = 0.009), rise (veh vs nonlesion, p = 0.03; EV vs nonlesion, p = 0.00004; EV vs veh, p = 0.02), fall (veh vs nonlesion, p = 0.0003; EV vs nonlesion, p = 0.002), and threshold (veh vs nonlesion, p = 0.0003; EV vs nonlesion, p = 0.04). C, Amplitude of sAHP (veh vs nonlesion, p = 0.0002; EV vs nonlesion, p = 0.005). D, Box-and-whisker and vertical scatter plots (left) of rheobase current, and linear relationships of rheobase versus Rn (right, p < 0.01 for all correlations). E, Representative voltage responses to a low-amplitude current ramp stimulus in vPMCveh and vPMCEV neurons; the vPMCnonlesion neuron did not fire APs at this current ramp stimulus. F, Representative voltage traces showing steady-state AP firing in response to 2 s current steps at 40, 80, 120 pA. G, Mean AP firing rates in response to a series of depolarizing current steps (Fisher's LSD post hoc, 20, 40, 60, 80 pA: *veh vs EV, p < 0.04; #veh vs nonlesion, p < 0.009; 100, 120 pA: #veh vs nonlesion, p < 0.0002; **EV vs nonlesion, p < 0.03). H, Linear relationships of Rn and firing rate at lower current steps (60 pA; p < 0.01). Slopes significantly different between groups at all steps (40, 60, 80, 120: veh vs EV, p < 0.001; veh vs nonlesion, p < 0.048). I, Box-and-whisker and vertical scatter plots of percent initial and late FFA (Fisher's LSD post hoc: % FFAinitial, veh vs nonlesion, p = 0.0009; EV vs nonlesion, p = 0.02; % FFAlate veh vs nonlesion p = 0.02).
Figure 3.
Figure 3.
Reduced EPSCs and increased IPSCs in perilesional vPMC neurons. A, Representative traces of ESPCs (Vhold -80 mV) recorded in voltage clamp from vPMCnonlesion (n = 18 neurons from 2 monkeys), vPMCveh (n = 37 from 4 monkeys), and vPMCEV (n = 30 from 2 monkeys) layer 3 pyramidal neurons. B, Representative traces of IPSCs (Vhold -40 mV) recorded in voltage clamp from vPMCnonlesion (n = 19 neurons from 2 monkeys), vPMCveh (n = 44 from 4 monkeys), and vPMCEV (n =30 from 2 monkeys) layer 3 pyramidal neurons. C, Box-and-whisker plots and vertical scatter plots of individual cells of EPSC properties: ESPC frequency (ANOVA Fisher's LSD post hoc, veh vs nonlesion, p = 0.0000001; EV vs nonlesion = 0.0001), EPSC amplitude, EPSC area, and EPSC total charge (frequency × area; Fisher's LSD post hoc, veh vs nonlesion, p = 0.00,008; EV vs nonlesion = 0.000001). D, Box-and-whisker plots and vertical scatter plots of individual cells of ISPC properties: IPSC frequency (Fisher's LSD post hoc, veh vs nonlesion, p = 0.019; EV vs nonlesion, p = 0.032), IPSC amplitude, IPSC area, and IPSC total charge (frequency × area). E, The estimated E:I ratio based on the frequency and mean area of each cell (Fisher's LSD post hoc, veh vs nonlesion, p = 0.000003; EV vs nonlesion, p = 0.004; EV vs veh p = 0.037). F, Scatter plots showing the relative distribution of neurons from each group based on the relationship of excitatory and inhibitory properties: frequency, area, and total charge. Red line in each plot indicates the linear relationship where E = I. EPSC total charge dominates IPSC total charge in vPMCnonlesion neurons, mainly due to E-I difference in frequency. vPMCveh neurons exhibit a significant proportion with greater IPSC frequency and total charge than EPSC. Compared with vPMCveh neurons, vPMCEV neurons are distributed closer to vPMCnonlesion, with most neurons exhibiting greater excitatory than inhibitory tone, some scattered close to the E = I line, and very few below the E = I line.
Figure 4.
Figure 4.
EV treatment increases apical dendrite complexity and MAP2 expression in perilesional vPMC. A, xy maximum projections of confocal image stacks of representative L3 vPMC pyramidal neurons. B, Representative 3D reconstructions of vPMCnonlesion (n = 15 neurons from 2 monkeys), vPMCveh (n = 17 from 4 monkeys), and vPMCEV (n = 15 from 2 monkeys) layer 3 pyramidal neurons. Note the point where the main apical trunk branches into an apical tuft. C–G, Box-and-whisker plots and vertical scatter plots of dendritic morphologic outcome measures of individual neurons: (C) apical and basal dendritic length and (D) branch nodes; (E) morphologic properties of apical tufts: apical tuft branch nodes and nodes/length. F, Main apical trunk length. G, Apical oblique dendrites nodes/length. H, Sholl analyses of mean apical dendritic length length (ANOVA main effect, 280, 480, 500 µm, p = 0.029, 0.003, 0.01; Fisher's LSD post hoc: *EV vs veh, p < 0.013; #veh vs nonlesion, p < 0.04). I, Sholl analyses of mean basal dendritic length. J, Box-and-whisker plots and vertical scatter plots of percent area labeled and average particle size of MAP2+ immunolabel in vPMC. Multiple comparisons were done between animals (lesion EV-treated, n = 4; lesion vehicle-treated, n = 5; nonlesion control, n = 3; ANOVA Fisher LSD post hoc, p < 0.05). K, Maximum projection of confocal image stacks showing MAP2+ immunolabel in layers 1 (L1), 2 (L2), and 3 (L3) of vPMC. Scale bars: A, B, K, 100 µm.
Figure 5.
Figure 5.
EV treatment increases spine density on apical dendrites of perilesional vPMC neurons. A, Schematic of spine classification criteria (top) and representative confocal z-maximum projection image (bottom) of spine subtypes (t, Thin; m, mushroom; s, stubby; f, filopodia). B, Box-and-whisker and vertical scatter plots of spine density (total spines and by subtype) in apical and basal dendrites of individual vPMCnonlesion (n = 11 neurons from 2 monkeys), vPMCveh (n = 12 from 4 monkeys), and vPMCEV (n = 11 from 2 monkeys) layer 3 pyramidal neurons. C, Representative confocal z-maximum projection images of mid apical, distal apical, and basal dendritic segments. D, Sholl analyses of mean total spine density and spine density by subtype at each 20 µm incremental proximal to distal distance from the soma, along the extent of a subsampled apical dendritic segment from each neuron. Total spine density (ANOVA main effect, 40, 340, 380 µm, p < 0.03; 420-580 µm, p < 0.04; Fisher's LSD post hoc, *EV vs veh, p < 0.02; #veh vs nonlesion 420 µm, p = 0.03; **EV vs nonlesion, p < 0.045). Thin spine density (ANOVA main effect, 380, 420, 440, 480, 520, 540 µm, p < 0.04; Fisher's LSD post hoc, *EV vs veh, p < 0.01; #veh vs nonlesion 420 µm, p = 0.001; **EV vs nonlesion 380 520 µm, p = 0.017, 0.005). Stubby spine density (ANOVA main effect, 40, 60, 120, 280, 320, 440, 520 µm, p < 0.048; Fisher's LSD post hoc, *EV vs veh, p < 0.02; **EV vs nonlesion p < 0.03). Mushroom spine density (ANOVA main effect, 240, 380, 460, 560, 580 µm, p < 0.04; Fisher's LSD post hoc, *EV vs veh, p < 0.016; **EV vs nonlesion 460 µm, p = 0.04). Filopodia spine density (ANOVA main effect, 20, 380 µm, p < 0.03; Fisher's LSD post hoc. *EV vs veh, p < 0.02). E, Total dendritic length, (F) spine density, and (G) estimated spine number (total dendritic length × spine density) in the proximal, middle, and distal thirds of apical dendrites, normalized by total length. Scale bars: A, C, 10 µm.
Figure 6.
Figure 6.
Greater density of apical inhibitory inputs and c-fos+ activation of dendritic-targeting inhibitory neurons in EV-treated brains. A, B, Single confocal optical slice images showing representative VGAT+ appositions on dendritic shafts (A, white arrows), spines (A, magenta arrows), and somata (B, magenta arrows) of filled vPMCnonlesion (n = 11 neurons from 2 monkeys), vPMCveh (n = 12 from 4 monkeys), and vPMCEV (n =11 from 2 monkeys) layer 3 pyramidal neurons. C, D, Box-and-whisker plots and vertical scatter plots of individual data points showing the following: (C) density VGAT+ dendritic appositions on shafts and spines of subsampled apical and basal dendritic segments from each neuron; (D) density of VGAT+ appositions on somata; and (E) proportion of total VGAT appositions on somata, apical and basal dendrites. F, Sholl analyses showing the mean density of total VGAT+ dendritic appositions (ANOVA main effect, 20, 300, 320, 340, 420, 480 µm: p < 0.04; Fisher's LSD post hoc, *EV vs veh, p < 0.01) and mean density of VGAT+ appositions on shafts and spines at each 20 µm incremental proximal to distal distance from the soma, along the extent of a subsampled apical dendritic segment from each neuron (ANOVA main effect, shaft 20, 320 µm: p = 0.03, 0.014; Fisher's LSD post hoc, *EV vs veh, p < 0.02; **EV vs nonlesion, 20 µm, p = 0.013, #veh vs nonlesion, 320 µm, p = 0.02; ANOVA main effect, spines 140, 180, 420, 480 µm: p = 0.008, 0.03, 0.03, 0.02; Fisher's LSD post hoc, *EV vs veh, p < 0.01; **EV vs nonlesion, p < 0.04). G, Box-and-whisker and vertical scatter plots of individual data points showing mean density of VGAT+ appositions on normalized proximal, middle, and distal thirds of apical dendrites. H, Representative confocal z-maximum projection image stack showing co-labeling of CB, PV, and CR with c-fos in perilesional vPMC. Tissue was harvested 3 h after performance of the HDT to label the intermediate early gene, c-fos in vPMC, and quantify neuronal cell types presumably activated during the HDT (n = 5 EV-treated, n = 5 vehicle-treated monkeys). I, Total density of neurons labeled with c-fos+ in vPMC. J, Cell density and (K) proportion of subpopulations of c-fos+ neurons colabeled with calcium binding proteins, CB+, PV+, or CR+, expressed on inhibitory neurons in layers 2–3 of vPMC. Scale bars: A, B, 10 µm; H, 100 µm.
Figure 7.
Figure 7.
EV treatment after lesion normalizes electrophysiological and morphological properties of vPMC neurons. A, NMDS plots showing clustering on neurons based on multiple passive membrane, active membrane, and synaptic current outcome variables. The proximity of points in each NMDS plots indicate the relative similarity-based pairwise correlation of multiple variables. B, NMDS plots showing clustering on neurons based on multiple dendritic morphologic properties, and spine and VGAT apposition distribution. C, Scatter plot based on MANOVA of active and synaptic current outcome measures that significantly predicted group membership. The MANOVA resulted in two significant canonical variables that separated the population into three distinct groups, based on a linear combination of the outcome measures. The first canonical variable separated the neurons in the nonlesioned control group from the lesioned groups (p = 0.0000064, eigen value = 2.2). The second canonical variable separated neurons based on treatment (vPMCveh vs vPMCEV; p = 0.04, eigen value = 0.67). Among the outcome measures, AP firing frequency and EPSC and IPSC frequencies were the strongest discriminators (i.e., greatest absolute value of the coefficients of the canonical variable) of membership of group membership (see Table 3). D, Scatter plot based on MANOVA of dendritic morphologic, spine, and VGAT apposition distribution properties. The MANOVA resulted in one significant canonical variable (p = 0.01, eigen value = 49.72) that separated the population into two distinct groups separating the vPMCveh neurons from vPMCEV and vPMCnonlesion group. The second canonical variable clustered vPMCEV and vPMCnonlesion neurons but was not significant (p = 0.52, eigen value = 3.8).
Figure 8.
Figure 8.
Pyramidal neuron excitability correlates with behavioral measures of recovery of function. A, Linear correlations with recovery of function were found for adaptation ratio at low-amplitude (20 pA shown here) and high-amplitude (180 pA) current stimuli, such that greater adaptation (lower ratio) at low-amplitude stimuli is associated with fewer days to recover preoperative grasp but lower adaptation at high-amplitude stimuli is associated with faster latency. B, Linear correlations with recovery of function were found for EPSC frequency and E:I ratio, such that the greater excitation relative to inhibition, the greater the recovery. C-F, Linear correlations between recovery of function and measures of c-fos+ activation of neurons during HDT as follows: (C) the total density of c-fos+ cells and the subpopulation of CB+/c-fos+ cells were significantly correlated with days to return to preoperative grasp level; (D) days to return to preoperative latency; and (E) postoperative mean latencies during the final 5 d of testing.F, The density of PV+/c-fos+ cells and % cfos unlabeled with inhibitory neuron markers were significantly correlated with mean latencies during the final 5 d of testing. G, Linear correlations between MAP2 optical density (% area labeled) and number of days to recover preoperative grasp level and mean latencies (final 5 d of testing). H, Summary of lesion-associated changes and the effects of MSC-EVs on pyramidal neuron cellular structure and function in perilesional vPMC. Based on our evidence here and from our previous work (Go et al., 2020; Moore et al., 2019), we propose two possible mechanisms of action of EV treatment to either limit initial acute damage and dampen lesion-associated compensatory changes in firing and synaptic current properties, or enhance neurite remodeling during the chronic recovery phase after injury.

Similar articles

Cited by

References

    1. Alvarez-Erviti L, Seow Y, Yin H, Betts C, Lakhal S, Wood MJ (2011) Delivery of siRNA to the mouse brain by systemic injection of targeted exosomes. Nat Biotechnol 29:341–345. 10.1038/nbt.1807 - DOI - PubMed
    1. Amatrudo JM, Weaver CM, Crimins JL, Hof PR, Rosene DL, Luebke JI (2012) Influence of highly distinctive structural properties on the excitability of pyramidal neurons in monkey visual and prefrontal cortices. J Neurosci 32:13644–13660. 10.1523/JNEUROSCI.2581-12.2012 - DOI - PMC - PubMed
    1. Anrather J, Iadecola C (2016) Inflammation and stroke: an overview. Neurotherapeutics 13:661–670. 10.1007/s13311-016-0483-x - DOI - PMC - PubMed
    1. Barbas H. (2015) General cortical and special prefrontal connections: principles from structure to function. Annu Rev Neurosci 38:269–289. 10.1146/annurev-neuro-071714-033936 - DOI - PubMed
    1. Barbas H, Pandya DN (1987) Architecture and frontal cortical connections of the premotor cortex (area 6) in the rhesus monkey. J Comp Neurol 256:211–228. 10.1002/cne.902560203 - DOI - PubMed

Publication types

LinkOut - more resources