. 2020 Jun 12;368(6496):1261-1265.
doi: 10.1126/science.aay8241. Epub 2020 Apr 2.

Temporal integration of mitogen history in mother cells controls proliferation of daughter cells

Affiliations

Temporal integration of mitogen history in mother cells controls proliferation of daughter cells

Mingwei Min et al. Science. .

Abstract

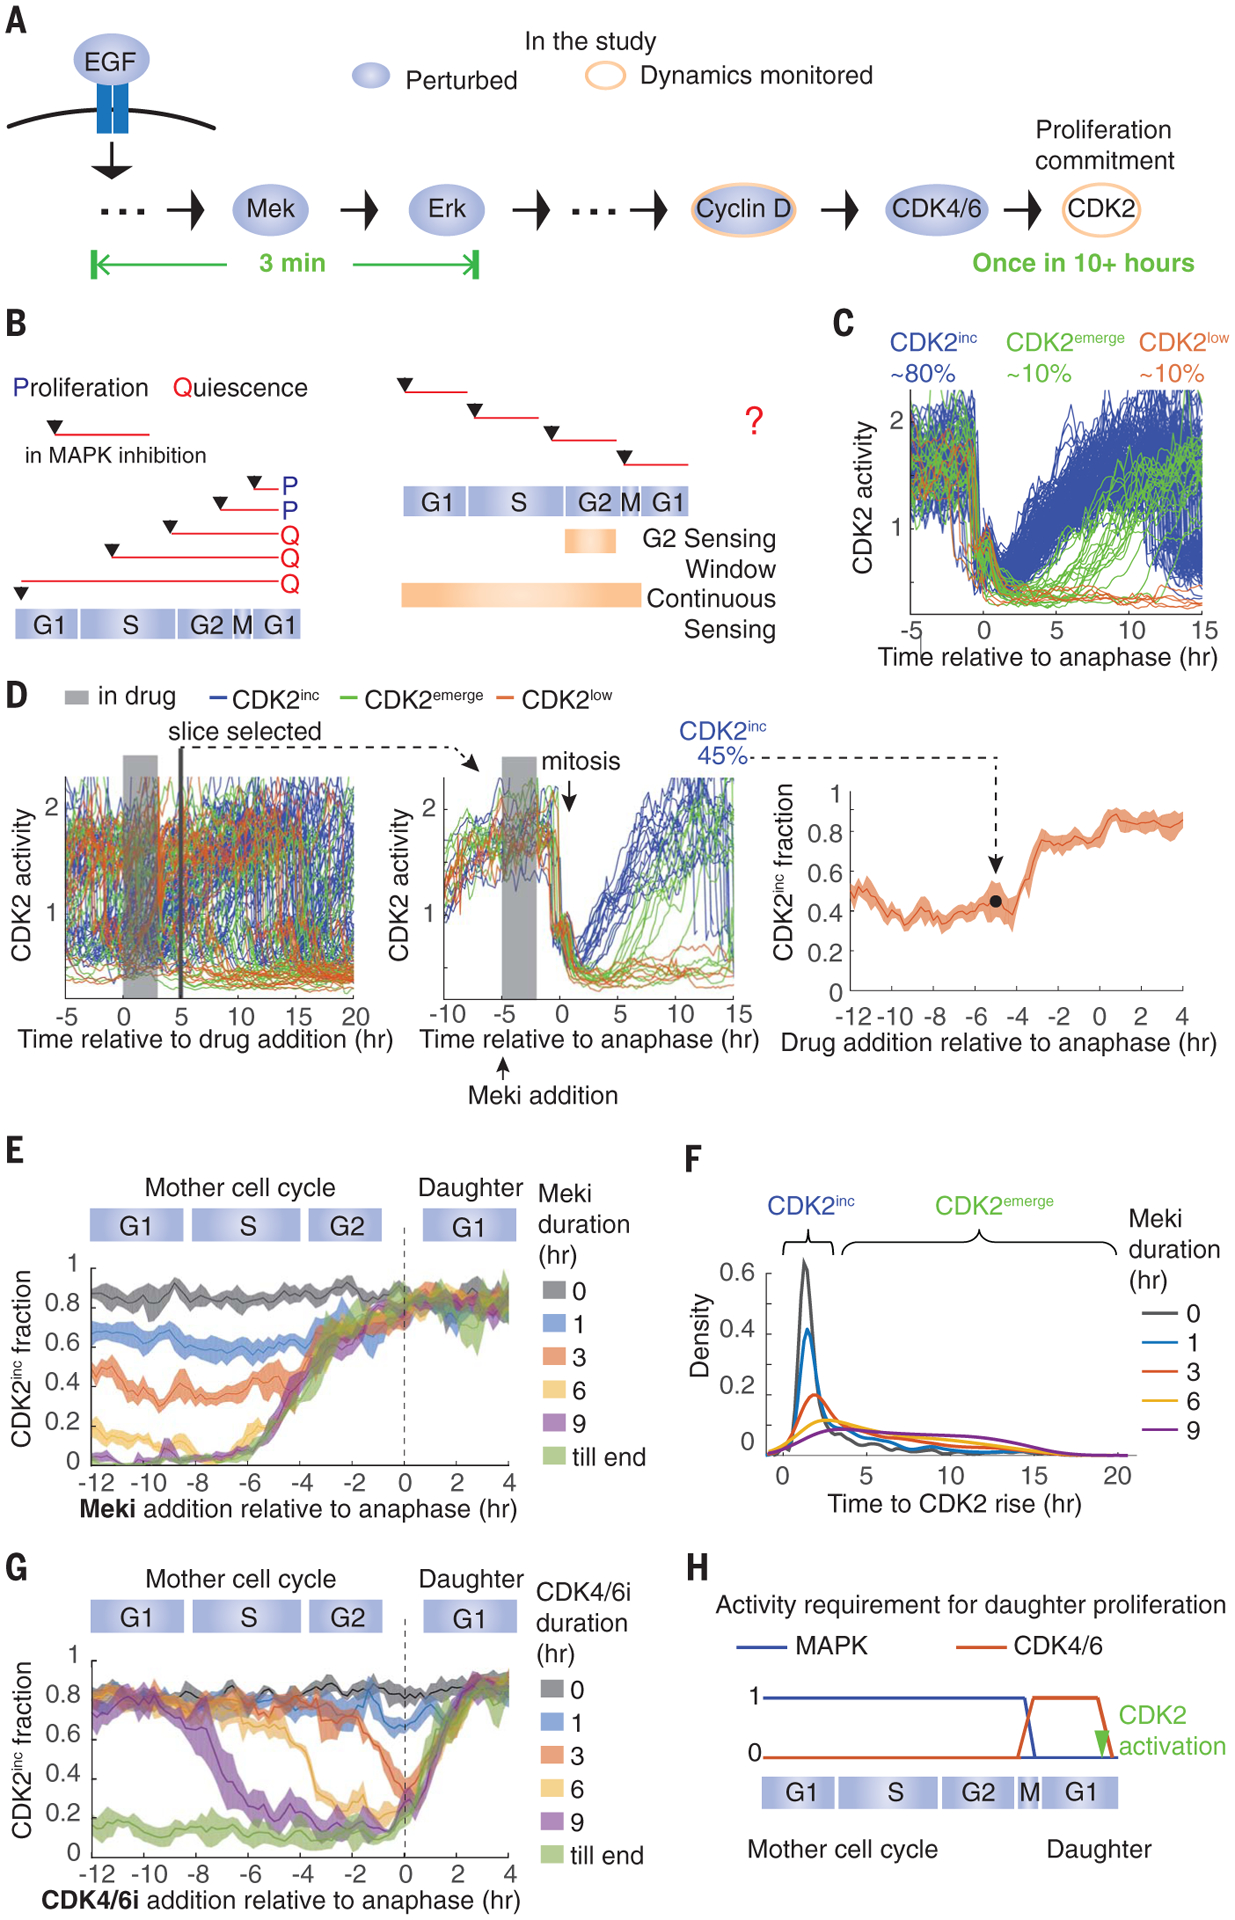
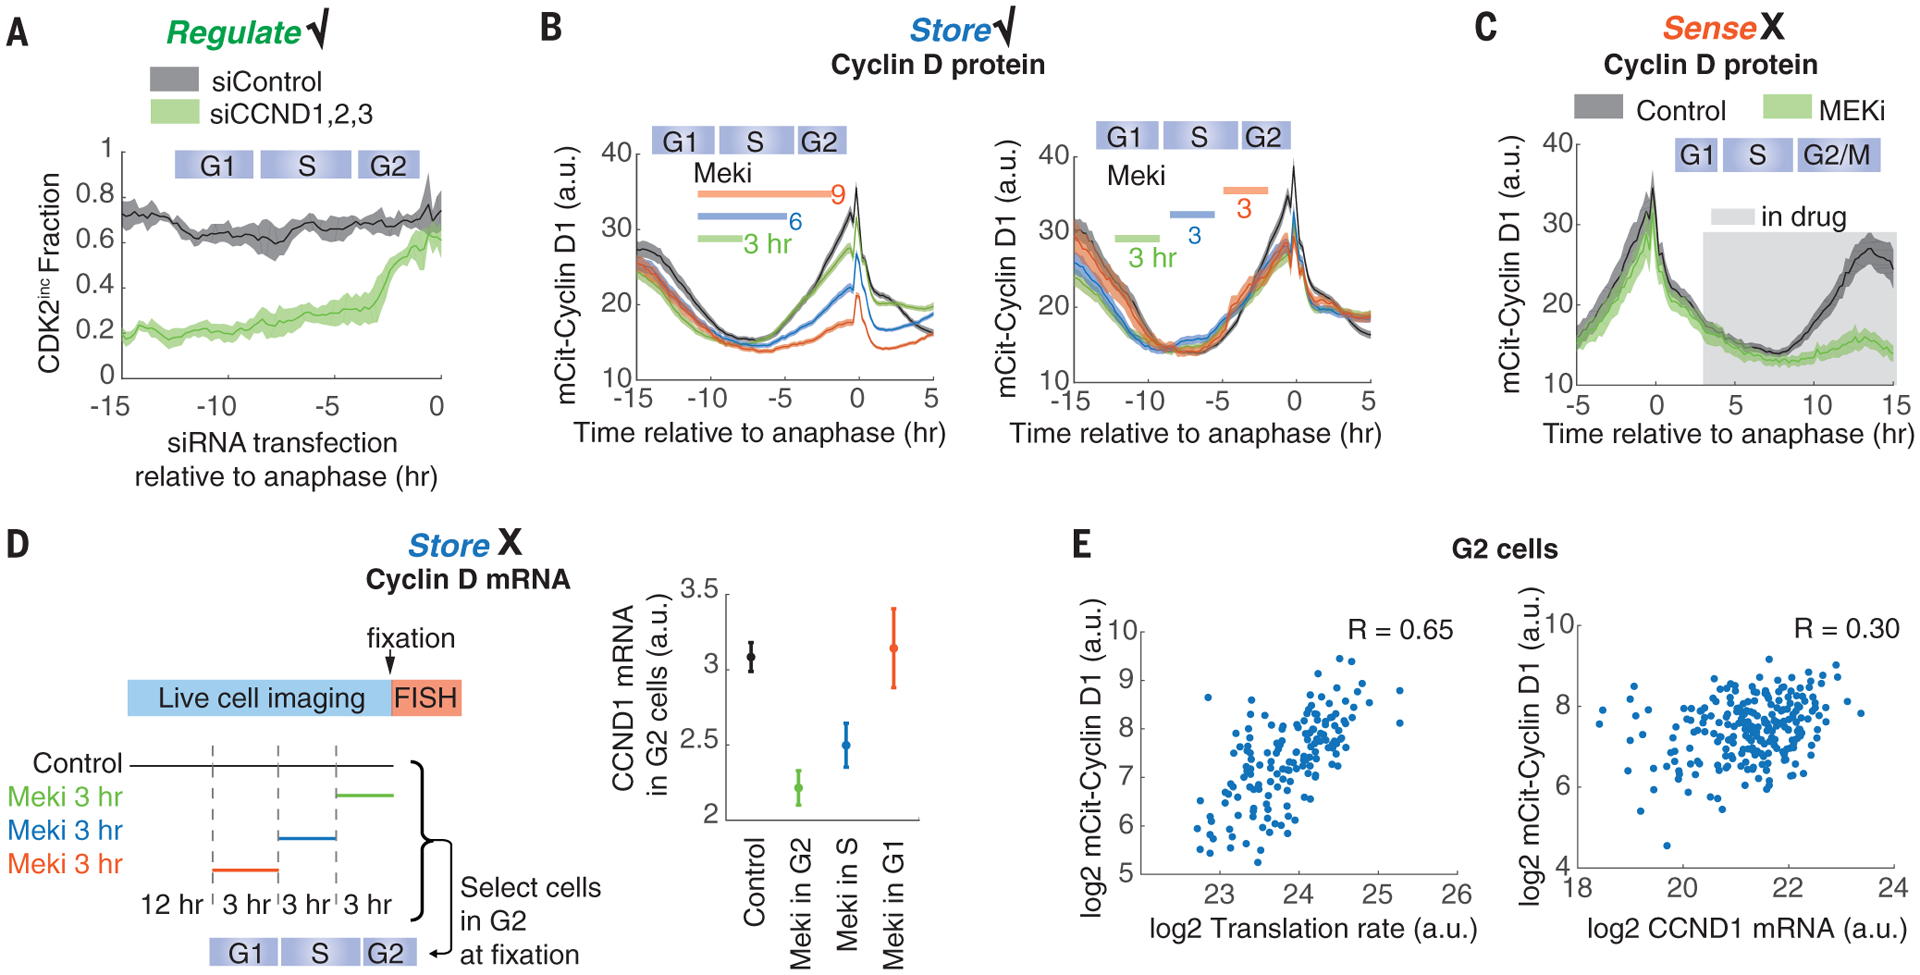
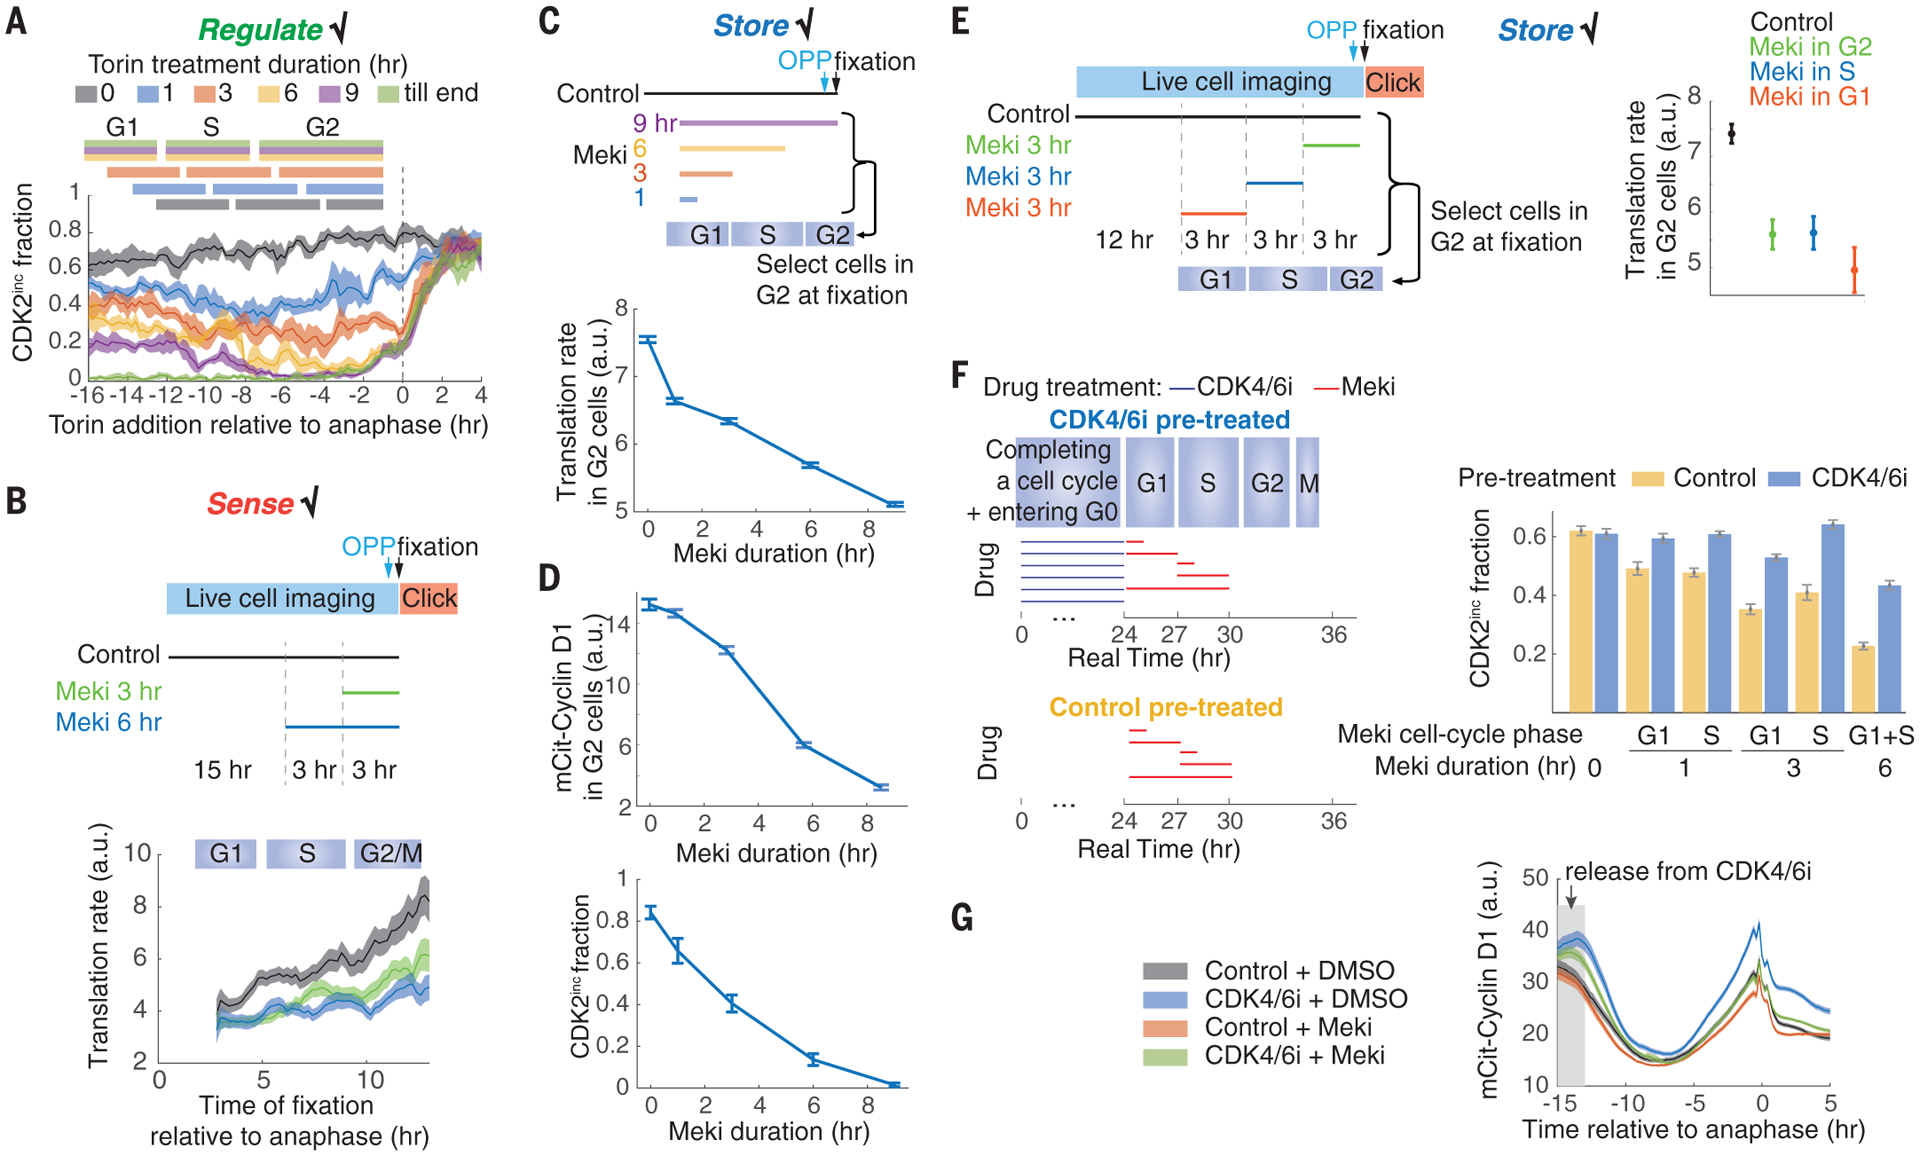
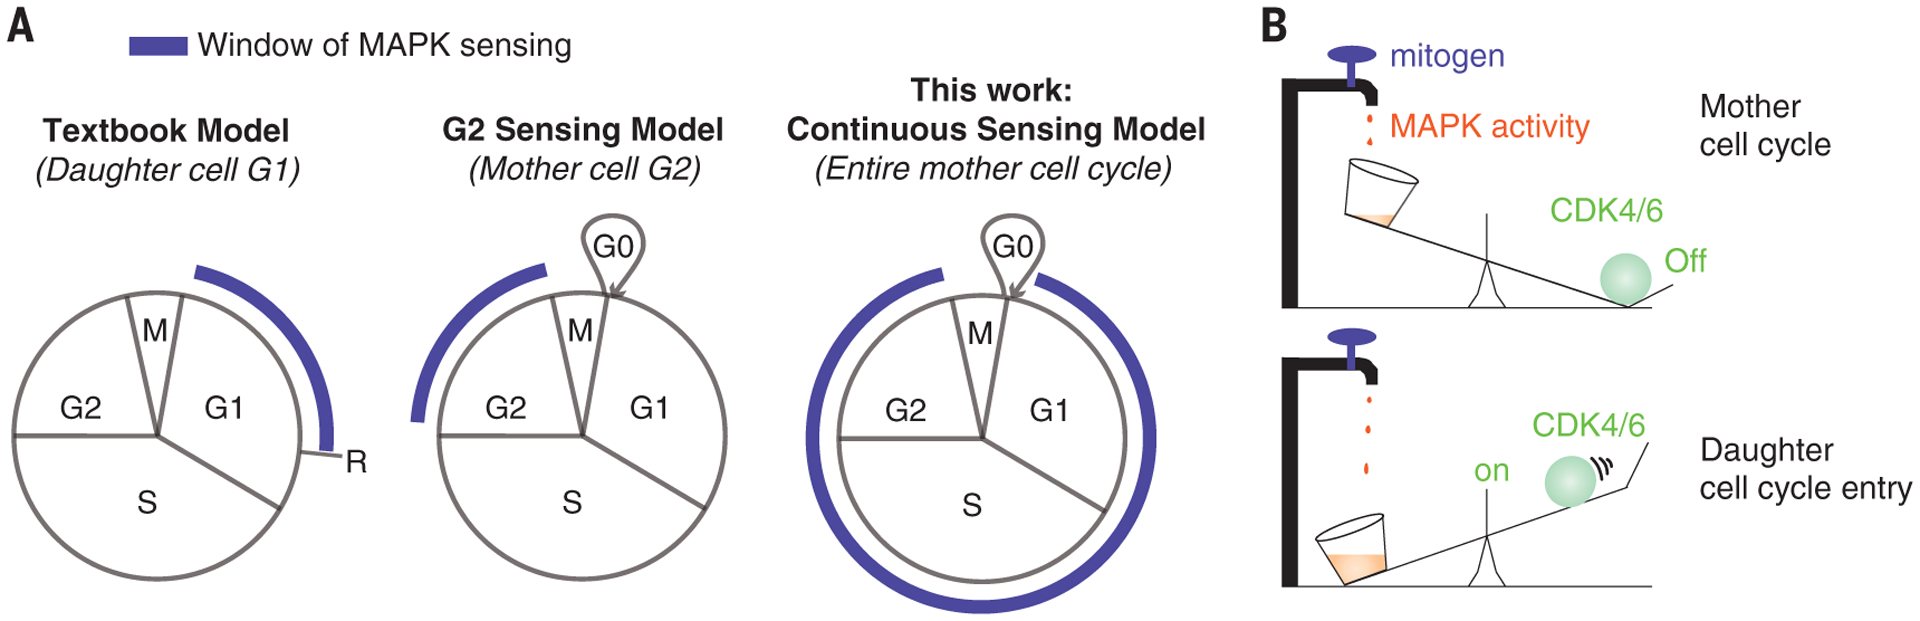
Multicellular organisms use mitogens to regulate cell proliferation, but how fluctuating mitogenic signals are converted into proliferation-quiescence decisions is poorly understood. In this work, we combined live-cell imaging with temporally controlled perturbations to determine the time scale and mechanisms underlying this system in human cells. Contrary to the textbook model that cells sense mitogen availability only in the G1 cell cycle phase, we find that mitogenic signaling is temporally integrated throughout the entire mother cell cycle and that even a 1-hour lapse in mitogen signaling can influence cell proliferation more than 12 hours later. Protein translation rates serve as the integrator that proportionally converts mitogen history into corresponding levels of cyclin D in the G2 phase of the mother cell, which controls the proliferation-quiescence decision in daughter cells and thereby couples protein production with cell proliferation.


Conflict of interest statement

Competing interests: The authors declare no conflict of interest.

Figures

Fig. 1.
Fig. 1.. MAPK activity is temporally integrated throughout the mother cell cycle to control daughter cell proliferation, whereas CDK4/6 activity is only required in early G1
. (A) Transduction of mitogen signals to cell cycle machinery. EGF, epidermal growth factor. (B) (Left) Depiction of previous MAPK inhibition experiments. (Right) Two potential models of mitogen sensing: Cells sense mitogen availability only in the mother cell G2 or continuously throughout the mother cell cycle. (C) Typical cell CDK2 activity in optimal growth conditions. hr, hour. (D) Data processing for establishing daughter cell fate as a function of the time of drug addition, read out as CDK2 activity. (Left) CDK2 activity in asynchronously cycling cells. In this example, cells were treated with Meki for 3 hours before the drug was washed off. (Middle) Traces from cells that underwent mitosis 5 hours after drug addition were extracted and the fraction of CDK2inc daughter cells was calculated. (Right) Repeating this process for every time slice generates the plot of fraction of CDK2inc daughter cells versus the time of drug addition relative to anaphase. (E) Fraction of CDK2inc daughter cells treated with 0, 1, 3, 6, or 9 hours Meki or Meki until the end (till end) of the experiment, at various times relative to anaphase. (F) Density distribution of the time between anaphase and the rise of CDK2 activity in CDK2inc and CDK2emerge daughter cells. Cells were treated with Meki for the indicated durations starting from the G1 phase of the mother cell cycle. Areas under the curves were normalized to 1. (G) Same as in (E) except with CDK4/6i treatment. (H) Summary of the data. All data are from MCF10A cells; all CDK2inc fractions are plotted as means ± 95% confidence intervals shown as shaded bands, where nonoverlapping shading indicates a statistically significant difference as determined by t test, with P < 0.05.
Fig. 2.
Fig. 2.. Cyclin D acts as a downstream effector of the MAPK integrator.
(A) Cyclin D regulates cell proliferation. The fraction of CDK2inc daughter cells is plotted against the time of small interfering RNA (siRNA) addition. siControl, nontargeting siRNA; siCCND1,2,3, siRNAs against CCND1, CCND2, and CCND3. (B) Cyclin D1 protein levels in G2 correlate negatively with the duration of the Meki treatment in the ongoing cell cycle, regardless of the cell cycle phase of the treatment. Cells expressing mCitrine-cyclin D1 from the endogenous locus were treated for 0 (black curve), 3, 6, or 9 hours (left), or for 3 hours (right) with Meki during imaging; the timing of treatment is indicated by colored bars. a.u., arbitrary units. (C) Cyclin D1 protein levels in G1 do not sense Meki treatment. The experimental setup is the same as in (B), except that Meki was left in once added. (D) Meki treatment in G1 does not reduce cyclin D1 mRNA levels in G2. Time-lapse imaging of CDK2 activity in asynchronous cells was followed by a 3-hour Meki treatment 0, 3, or 6 hours before fixation. Correspondingly, G2 cells at the time of fixation (10 to 12 hours after anaphase) received Meki treatment in the G2, S, or G1 phase, respectively. Cyclin D1 mRNA levels were measured by RNA fluorescence in situ hybridization (FISH) as the total signal in individual G2 cells. (E) Cyclin D1 protein levels strongly correlate with protein translation rate in G2 cells. Single-cell translation rates were measured with the O-propargyl-puromycin (OPP) assay, where cells were pulsed with OPP for 24 min before fixation (26) and quantified as the integrated intensity of incorporated OPP within each cell. G2 cells were identified, and cyclin D1 mRNA levels were measured as in (D). Each dot represents a single cell. R value is calculated as the Pearson correlation coefficient. mCit, mCitrine. With the exception of (E), all data are plotted as means ± 95% confidence intervals shown as shaded bands [(A), (B), and (C)] or error bars (D). All data are from MCF10A cells.
Fig. 3.
Fig. 3.. Global protein translation rate integrates MAPK activity.
(A) Perturbation of protein translation by torin in the mother cell cycle impairs daughter cell cycle entry in a duration-dependent manner. The experimental setup is the same as in Fig. 1E except that torin is used. Cell cycle phases are derived from fig. S9, C and D. (B) Translation rate can rapidly sense MAPK activity throughout the cell cycle. Time-lapse imaging of CDK2 activity in asynchronous cells was followed by an OPP assay, as in Fig. 2E. The OPP signal was then reconstructed as a function of the time since anaphase. (C) Meki reduces the G2 phase translation rate in a duration-dependent manner. (D) Duration-dependent effect of Meki on the G2 phase cyclin D1 protein levels and on the fraction of CDK2inc daughter cells. (E) Translation rates can store past MAPK activity. The experimental setup is the same as in (B) except that cells were fixed at 0, 3, or 6 hours after the 3-hour Meki treatment. Correspondingly, G2 cells at the time of fixation (10 to 12 hours after anaphase) received Meki treatment in the G2, S, or G1 phase, respectively. (F) Enhancing translation by pre-enlarging cells using CDK4/6i can rescue the Meki-induced proliferation defect. (G) CDK4/6i pretreatment can rescue the Meki-induced reduction of cyclin D1 levels. All data are from MCF10A cells and are plotted as means ± 95% confidence intervals, shown as shaded bands [(A), (B), and (G)] or error bars [(C), (D), (E), and (F)].
Fig. 4.
Fig. 4.. Models.
(A) An updated model of mitogen sensing. R, restriction point. (B) A mechanical metaphor of how MAPK signaling promotes cell cycle entry.

Similar articles

Cited by

References

    1. Meloche S, Pouysségur J, Oncogene 26, 3227–3239 (2007). - PubMed
    1. Toettcher JE, Weiner OD, Lim WA, Cell 155, 1422–1434 (2013). - PMC - PubMed
    1. Morgan DO, The Cell Cycle, Principles of Control (New Science Press, 2007).
    1. Pardee AB, Proc. Natl. Acad. Sci. U.S.A 71, 1286–1290 (1974). - PMC - PubMed
    1. Weinberg RA, Cell 81, 323–330 (1995). - PubMed

Publication types