. 2020 May 8;295(19):6721-6740.
doi: 10.1074/jbc.RA120.012710. Epub 2020 Apr 2.

Polarization of protease-activated receptor 2 (PAR-2) signaling is altered during airway epithelial remodeling and deciliation

Affiliations

Polarization of protease-activated receptor 2 (PAR-2) signaling is altered during airway epithelial remodeling and deciliation

Ryan M Carey et al. J Biol Chem. .

Abstract

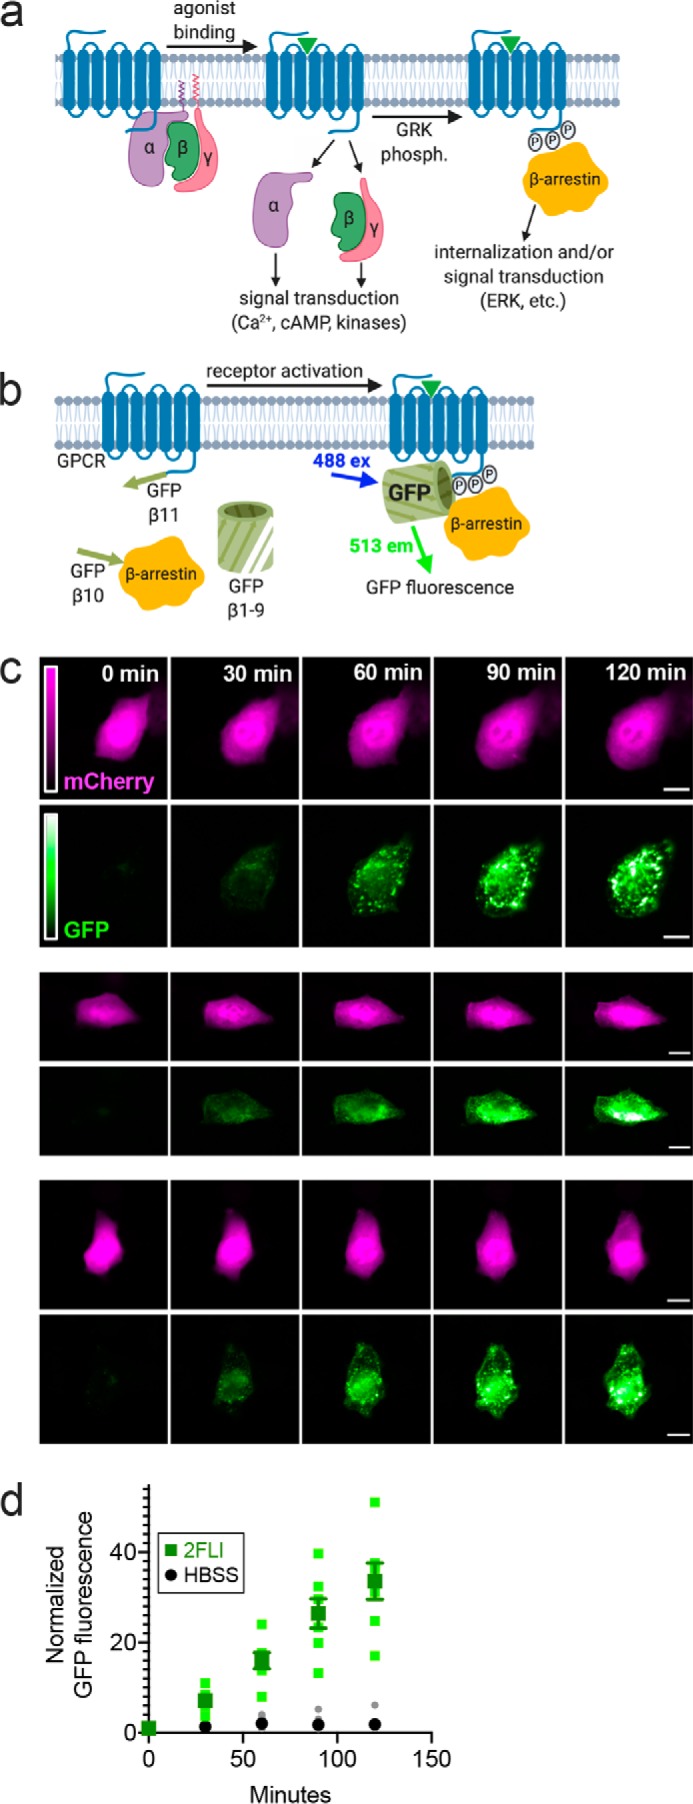
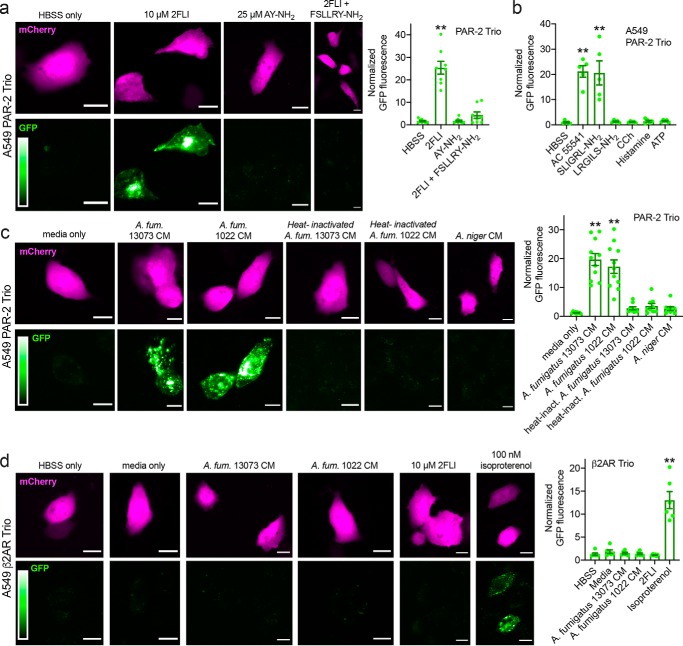
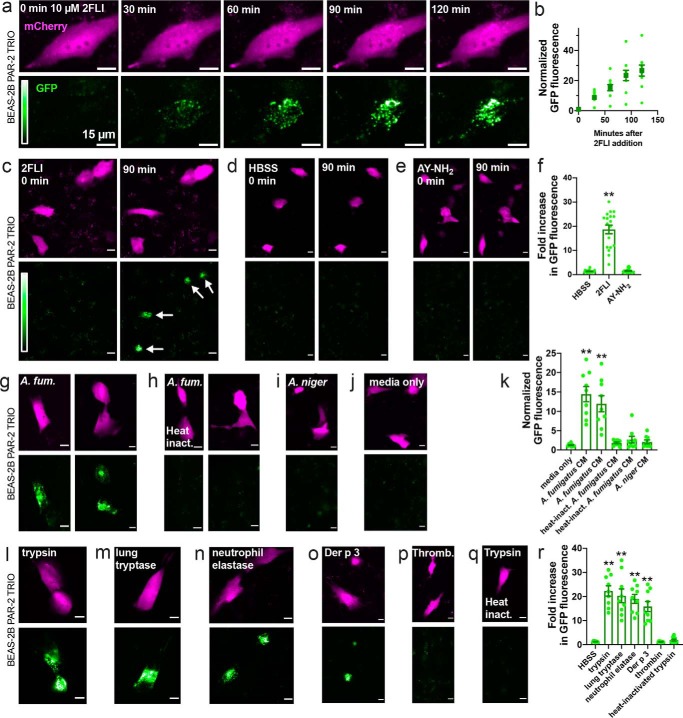
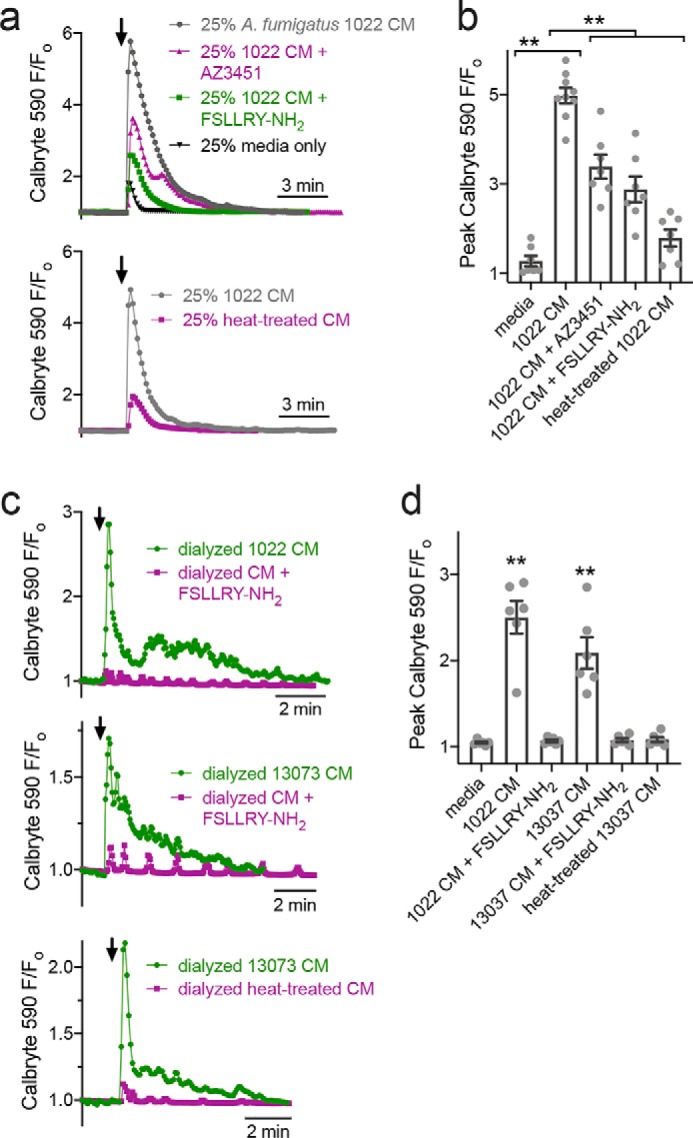
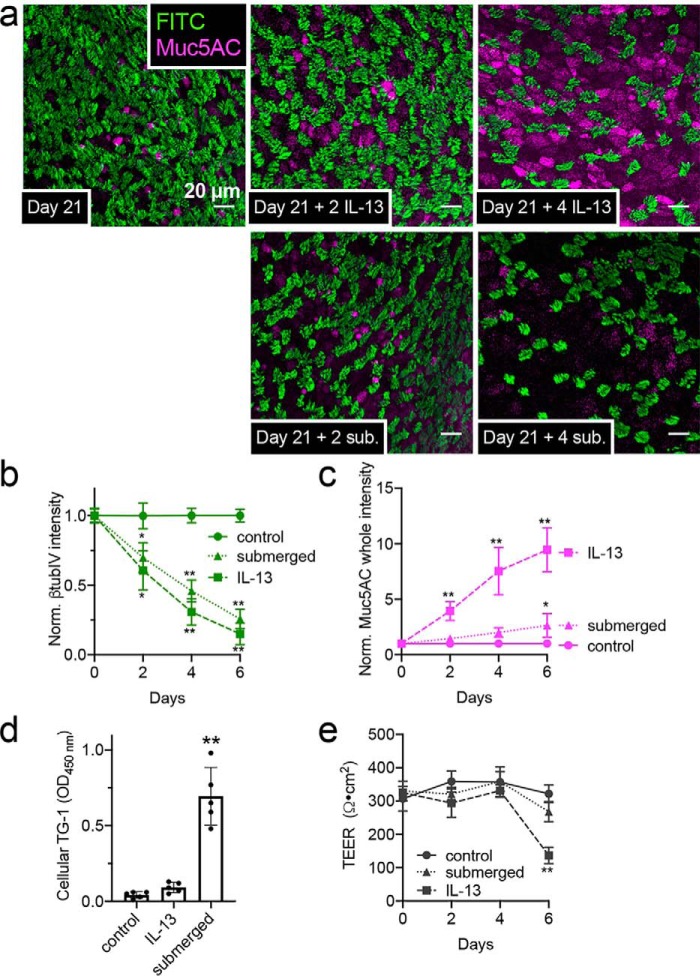
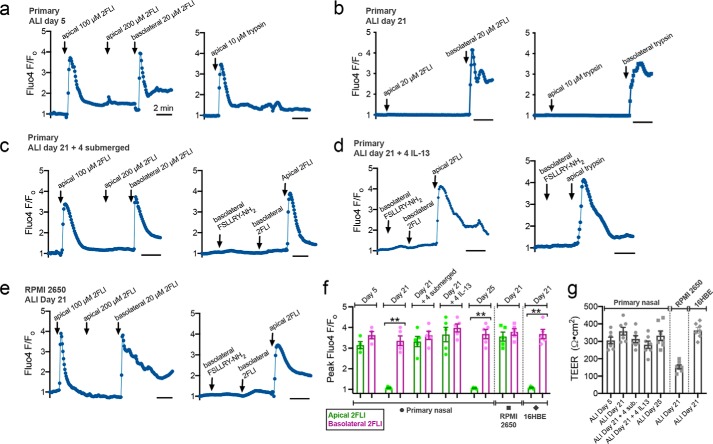
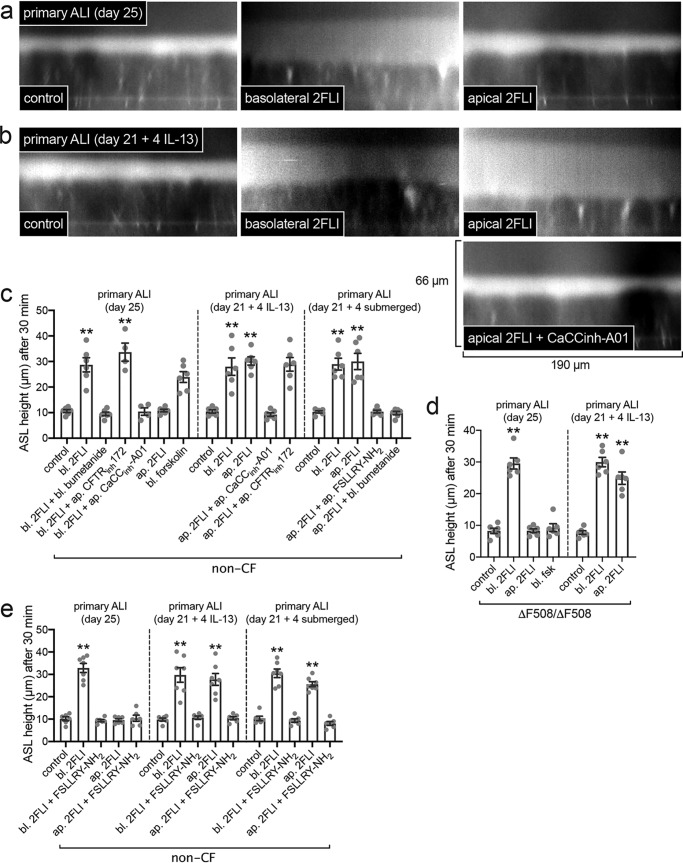
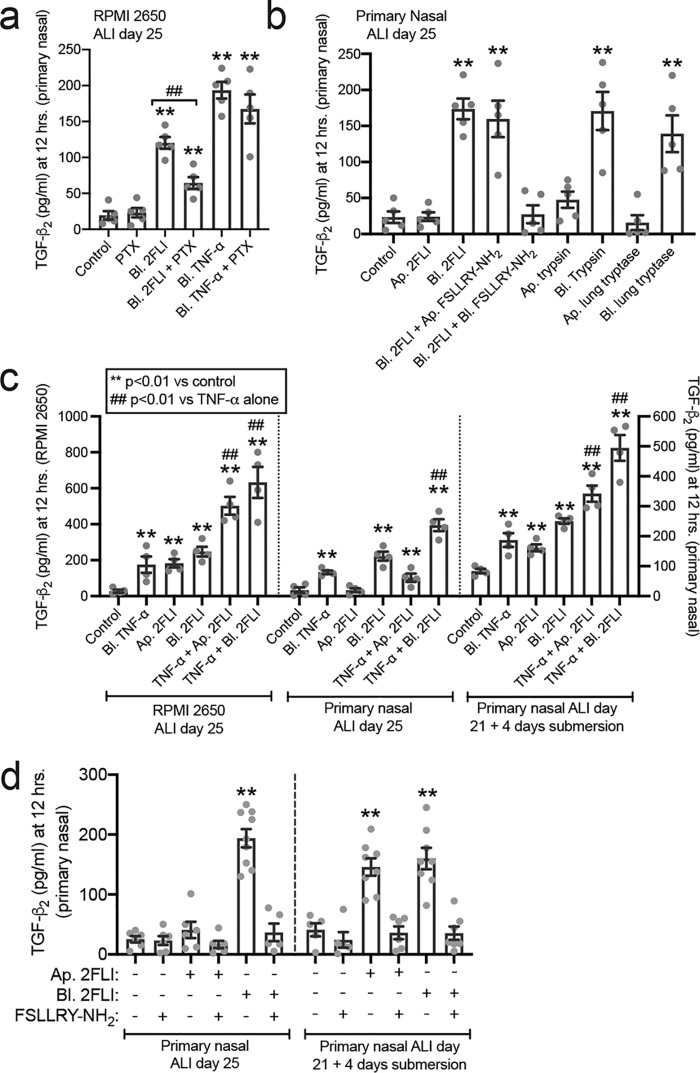
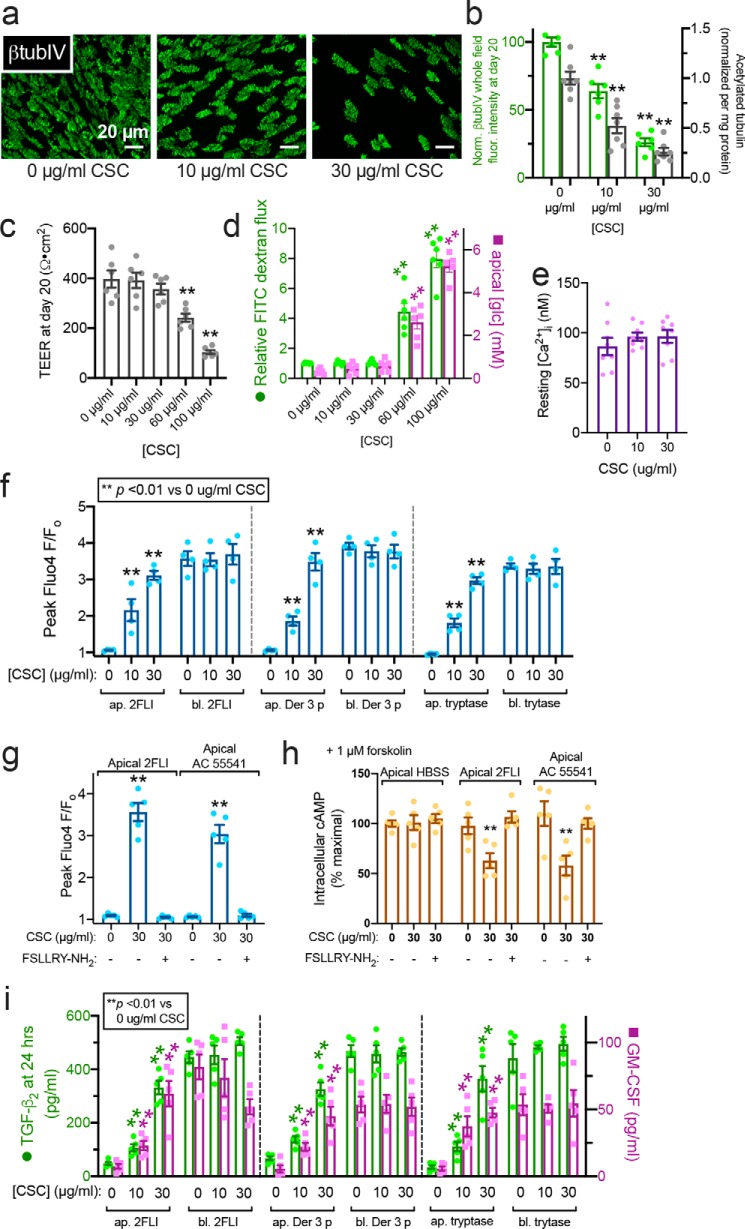
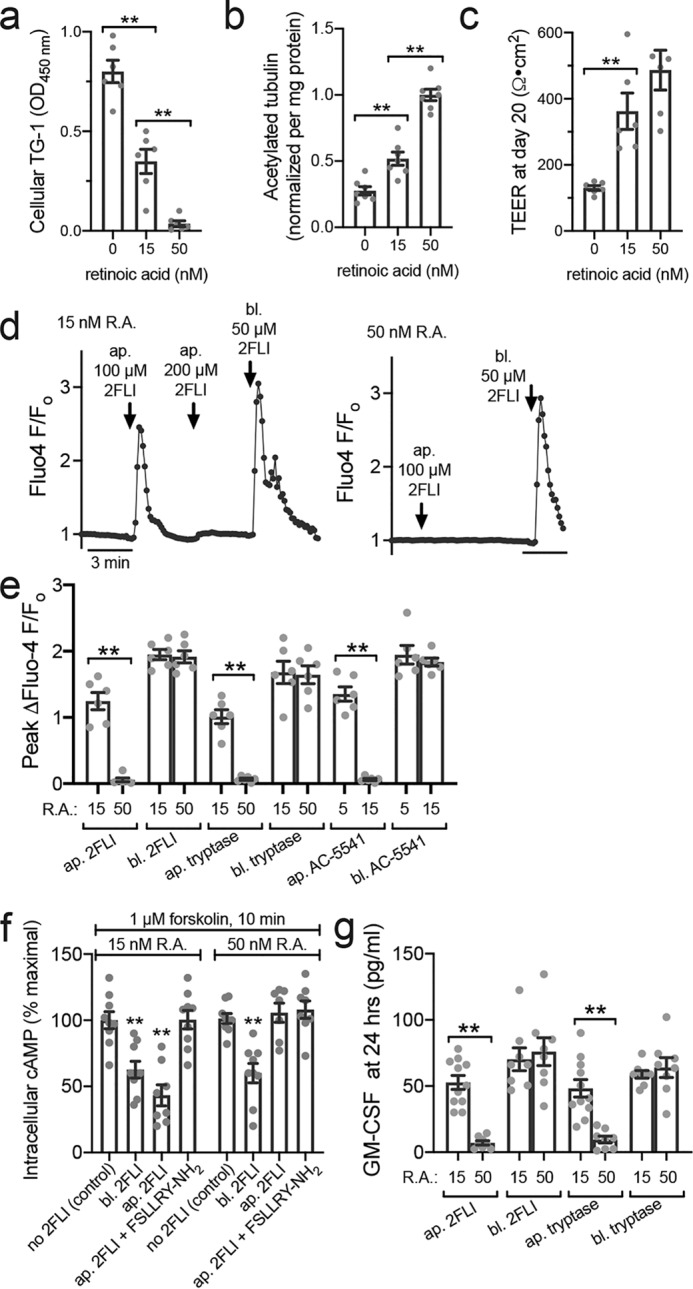
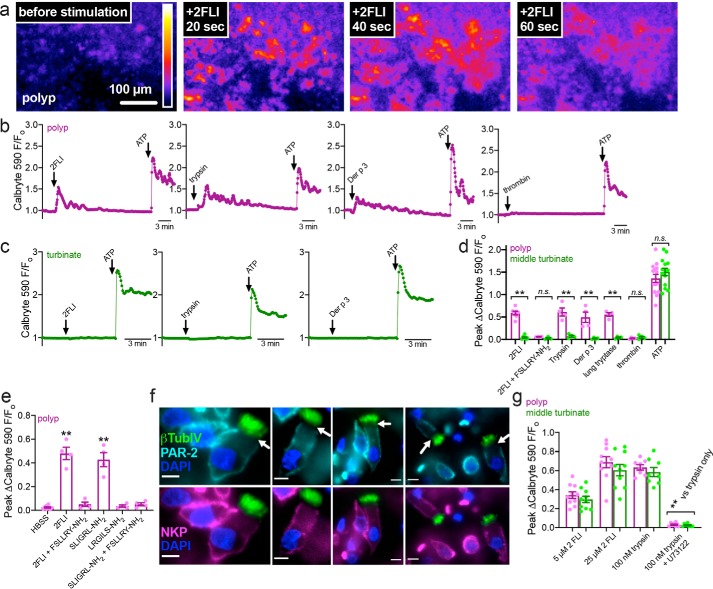
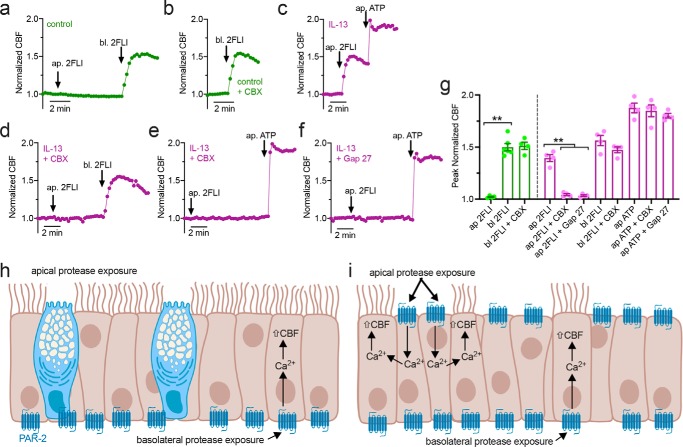
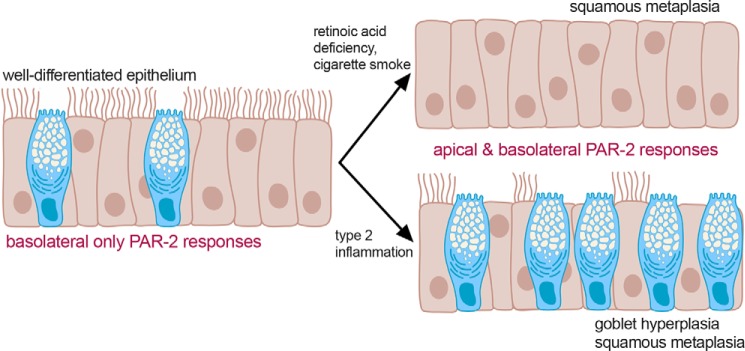
Protease-activated receptor 2 (PAR-2) is activated by secreted proteases from immune cells or fungi. PAR-2 is normally expressed basolaterally in differentiated nasal ciliated cells. We hypothesized that epithelial remodeling during diseases characterized by cilial loss and squamous metaplasia may alter PAR-2 polarization. Here, using a fluorescent arrestin assay, we confirmed that the common fungal airway pathogen Aspergillus fumigatus activates heterologously-expressed PAR-2. Endogenous PAR-2 activation in submerged airway RPMI 2650 or NCI-H520 squamous cells increased intracellular calcium levels and granulocyte macrophage-colony-stimulating factor, tumor necrosis factor α, and interleukin (IL)-6 secretion. RPMI 2650 cells cultured at an air-liquid interface (ALI) responded to apically or basolaterally applied PAR-2 agonists. However, well-differentiated primary nasal epithelial ALIs responded only to basolateral PAR-2 stimulation, indicated by calcium elevation, increased cilia beat frequency, and increased fluid and cytokine secretion. We exposed primary cells to disease-related modifiers that alter epithelial morphology, including IL-13, cigarette smoke condensate, and retinoic acid deficiency, at concentrations and times that altered epithelial morphology without causing breakdown of the epithelial barrier to model early disease states. These altered primary cultures responded to both apical and basolateral PAR-2 stimulation. Imaging nasal polyps and control middle turbinate explants, we found that nasal polyps, but not turbinates, exhibit apical calcium responses to PAR-2 stimulation. However, isolated ciliated cells from both polyps and turbinates maintained basolateral PAR-2 polarization, suggesting that the calcium responses originated from nonciliated cells. Altered PAR-2 polarization in disease-remodeled epithelia may enhance apical responses and increase sensitivity to inhaled proteases.

Keywords: Aspergillus; G-protein–coupled receptor (GPCR); calcium; chloride transport; cilia; cytokine; inflammation; mucociliary clearance; mucosal immunology; protease.


Conflict of interest statement

The authors declare that they have no conflicts of interest with the contents of this article

Figures

Figure 1.
Figure 1.
A. fumigatus CM directly activates PAR-2 in airway cells. a, diagram of GPCR interaction with β-arrestin after activation and phosphorylation by G-receptor kinase (GRK) b, diagram of the Trio assay (modified from Ref. 26) used to detect PAR-2 activation. A heterologously-expressed GPCR (in this case PAR-2) is tagged at the C-terminal end with the β11-strand of GFP. The receptor is co-expressed with β-arrestin tagged with the β10-strand of GFP along with soluble GFP β-strands 1–9. Association of the PAR-2 with β-arrestin allows the formation of a complete fluorescent GFP molecule; soluble mCherry is included on the plasmid as a transfection control (not shown in the model). c, representative images of A549 cells expressing PAR-2 Trio components (plus mCherry as transfection control) stimulated with 10 μm 2FLI for 0–120 min. Scale bars are 15 μm. d, normalized GFP fluorescence in cells stimulated with 2FLI or buffer alone (HBSS) at time points taken over 2 h. Data points are independent experiments imaged on three different days (n = 5–9). a and b were created with Biorender.com.
Figure 2.
Figure 2.
Activation of PAR-2 by peptide PAR-2 agonist and A. fumigatus CM in A549 cells. Cells were transfected with the PAR-2 Trio system (26) as described in the text to detect receptor–β-arrestin interaction upon PAR-2 activation. Many other studies have already demonstrated that β-arrestin is recruited to PAR-2 upon activation (26, 29, 30, 74–78). Using this assay allows us to directly look at PAR-2 activation in the absence of any other signals downstream of other targets of proteases and/or CM that could impinge on the PAR-2 signaling pathway. a, after 90 min stimulation with PAR-2 agonist 2FLI, GFP fluorescence was increased ∼25-fold compared with buffer (HBSS) only or PAR-4–activating peptide AY-NH2. The GFP fluorescence increase, signaling PAR-2 activation, was lost when cells were stimulated with 2FLI in the presence of 10 μm PAR-2 antagonist FSLLRY-NH2. b, bar graph showing data from experiments as in a with alternative PAR-2 agonists AC 55541 and SLIGRL-NH2 plus scrambled LRGILS-NH2 and cholinergic agonist CCh, histamine, and purinergic agonist ATP (100 μm each). c, representative images of PAR-2 activation with A. fumigatus (A. fum.) CM. Cells were exposed to conditioned media for 10 min followed by washing and resuspension in HBSS for 90 min. Bar graph on right shows normalized GFP fluorescence. Significance was determined by one-way ANOVA with Dunnett's post-test comparing values to media only control; **, p < 0.01. d, A549 cells were transfected with β2AR Trio. A. fumigatus CM did not activate β2AR but 100 nm isoproterenol did. Bar graph shows quantification of results. All bars show data points from ≥7 independent experiments imaging fields from independent transfected wells on separate days. Significance was determined by one-way ANOVA with Dunnett's post-test comparing all values to HBSS alone; **, p < 0.01. Scale bars are 15 μm.
Figure 3.
Figure 3.
A. fumigatus CM and immune cell proteases activate PAR-2 in BEAS-2B immortalized squamous bronchial epithelial cells. a and b, representative images (a) and quantification (b) showing time course of PAR-2–arrestin recruitment and the resulting increase in GFP fluorescence in BEAS-2B cells transfected with the PAR-2 Trio assay components and stimulated with PAR-2 agonist 2FLI (26). c–f, after 90 min stimulation, 2FLI (c) but not HBSS alone (d) or AY-NH2 (e) resulted in ∼20-fold increased GFP fluorescence, quantified in f. g–k, cells were stimulated for 10 min with 25% A. fumigatus (A. fum.) CM (g, strain 13073 left and 1022 right), heat-inactivated A. fumigatus CM (h; 20 min; 100 °C; strain 13073 left and 1022 right), A. niger CM (i), or media only (j) diluted in HBSS, followed by washing with HBSS and incubation for 90 min. GFP quantification is shown in k. l–r, cells were stimulated for 10 min with 25 nm trypsin (l), human lung tryptase (m), neutrophil elastase (n), Der p 3 (o), thrombin (p), or heat-inactivated trypsin (q), followed by washing with HBSS and incubation for 90 min. Quantification of GFP fluorescence is shown in r. Data points in b, f, k, and f are independent experiments performed on different days (n ≥ 5). Significance was determined by one-way ANOVA with Dunnett's post-test comparing all values to HBSS alone; **, p < 0.01. Scale bars are 15 μm.
Figure 4.
Figure 4.
A. fumigatus CM activates PAR-2–dependent calcium responses in A549 airway cells. a, representative calcium traces in response to A. fumigatus CM (strain 1022) diluted 1:4 in HBSS (gray). Also shown are responses to media only (black), CM + 100 μm FSLLRY-NH2 (green), CM + 100 μm AZ3451 (pink, top graph), or CM after heat treatment (100 °C for 20 min; pink, bottom graph). b, peak responses from independent experiments (n = 6–8) as shown in a. Significance was determined by one-way ANOVA with Bonferroni post-test; **, p < 0.01. c, representative calcium traces in response to dialyzed A. fumigatus CM (strain 1022 or 13073 as indicated) shown in green. Also shown are responses to dialyzed CM in the presence of FSLLRY-NH2 (pink, top and middle graphs) or CM after heat treatment (pink, bottom graph). d, peak responses from independent experiments (n = 6–8) as shown in c. Significance was determined by one-way ANOVA with Dunnett's post-test comparing all values to dialyzed media alone; **, p < 0.01.
Figure 5.
Figure 5.
Loss of cilia with IL-13 treatment or submersion of ALI cultures of primary human nasal cells. a, representative immunofluorescence (IF) of cilia (β-tubulin IV; green) and Muc5AC (magenta) in ALIs 21 days after air (top left). Top, middle, and right show cilia loss after further 2–4 days basolateral IL-13. Bottom, middle, and right show loss of cilia with less Muc5AC with apical submersion. b and c, cilia loss (b; normalized β-tubulin IV IF) and Muc5AC increase (c) in cultures (starting at day 21) exposed to subsequent IL-13, apical submersion, or no treatment (control). Ten fields from one ALI from one patient were imaged and averaged for an independent experiment; results shown are mean ± S.E. of 4–6 independent experiments (4–6 patients). d, squamous marker TG-1 quantified by ELISA at day 25 (21 days at air and then 4 subsequent days of IL-13, submersion, or no treatment). Each data point is an independent ALI from a different patient (n = 5 total ALIs). Significance was determined by one-way ANOVA with Dunnett's post-test; **, p < 0.01. e, TEER at time points as in b and c. Significance was determined by one-way ANOVA with Bonferroni post-test; *, p < 0.05, and **, p < 0.01.
Figure 6.
Figure 6.
Polarization of PAR-2 signaling in ALIs. a–d, primary human nasal ALIs loaded with Fluo-4 were stimulated apically or basolaterally with PAR-2 agonist 2FLI or trypsin. ALIs at day 5 (before ciliogenesis) responded to apical 2FLI (a, left) or trypsin (a, right). Basolateral 2FLI elicited further response after apical saturation, suggesting two physically separate PAR-2 pools (a, left). Responses to apical 2FLI or trypsin were lost by day 21 (b) but regained after subsequent 4 days of submersion (c) or basolateral IL-13 (d). Apical responses to 2FLI were observed even with basolateral PAR-2 antagonist (FSLLRY-NH2; 100 μm), supporting distinct PAR-2 pools. Representative traces are shown from single ALIs. e, RPMI 2650 squamous ALIs exhibited responses to apical 2FLI. Subsequent application of basolateral 2FLI or inhibition of basolateral PAR-2 with FSLLRY-NH2 also suggest physically separated apical versus basolateral PAR-2 pools. f, quantification of peak Fluo-4 F/Fo from experiments as in a–e (mean ± S.E.; 5–7 experiments using ALIs each different patients). Significance was determined by one-way ANOVA with Bonferroni post-test comparing apical versus basolateral 2FLI; **, p < 0.01. g, TEER from cultures used in a–f confirmed 4 days of submersion or IL-13 did not disrupt the epithelial barrier. Significance was determined by one-way ANOVA with Bonferroni post-test.
Figure 7.
Figure 7.
Epithelial remodeling is associated with enhanced fluid secretion to apical PAR-2 stimulation. a, representative orthogonal confocal sections of control cultures with Texas Red dextran-labeled ASL showing increase in ASL height (reflecting fluid secretion) with basolateral but not apical 2FLI (∼25 μm). b, representative sections of IL-13–treated cultures showing increased secretion with either basolateral or apical 2FLI and inhibition by the CaCC inhibitor CaCCinh-A01 (∼10 μm). c, peak ASL heights from independent experiments, each the average of 10 ASL measurements from one ALI; there were six experiments per condition. Note no inhibition of secretion with CFTRinh172 (∼10 μm), but there was inhibition with NKCC1 inhibitor bumetanide (100 μm) or PAR-2 antagonist FSLLRY-NH2 (∼10 μm). Drugs applied to the apical (ap.) side were sonicated in perfluorocarbon to not disturb the aqueous ASL layer; thus, apical concentrations are approximate. d, data experiments using ΔF508/ΔF508 homozygous CF ALIs. Note no response in CF cultures to basolateral (bl.) forskolin (20 μm), which elevates cAMP and activates CFTR (non-CF cultures responded in c). Each point is an independent experiment using cells from one patient (five patients total). e, experiments similar to c were performed ± PAR-2 antagonist FSLLRY-NH2 to demonstrate PAR-2 specificity of the response in both apical and basolateral 2FLI exposure. Each point is an independent experiment using an ALI culture from one patient (four to six ALIs from four to six patients per condition). Significance was determined in c–e by one-way ANOVA with Dunnett's post-test; **, p < 0.01 versus control (no stim) for each condition.
Figure 8.
Figure 8.
Altered PAR-2 polarity translates to altered TGF-β2 secretion with PAR-2 stimulation both alone and in combination with TNFα. a, bar graph of RPMI 2650 ALI TGF-β2 secretion with basolateral (bl.) application of 2FLI (20 μm) or TNFα (10 ng/ml) ± pertussis toxin (100 ng/ml; 18 h pretreatment). b, bar graph of primary nasal ALIs showing TGF-β2 secretion with basolateral (bl.) but not apical (ap.) 2FLI (20 μm), trypsin (10 nm), or tryptase (10 nm). c, bar graph showing TGF-β2 secretion with apical versus basolateral 2FLI and combinatorial effects with TNFα. RPMI 2650 squamous ALIs and primary ALIs exposed to 4 days of submersion to induce squamous differentiation exhibited apical 2FLI responses but control ALIs did not. d, bar graph showing TGF-β2 secretion with apical versus basolateral 2FLI as in b ± FSLLRY-NH2 (50 μm). Each point is an independent experiment using an ALI culture from one patient (four to six ALIs from four to six patients per condition). Significance was determined in a–d by one-way ANOVA with Dunnett's post-test comparing values to the respective control; **, p < 0.01. a, ##, p < 0.01 between basolateral 2FLI and 2FLI with PTX by one-way ANOVA with Bonferroni post-test. c, ##, p < 0.01 versus TNFα alone by one-way ANOVA with Bonferroni post-test.
Figure 9.
Figure 9.
Impaired ciliation by CSC exposure alters PAR-2 polarity. a, representative image showing reduction of cilia in ALIs exposed to CSC. b, quantification of β-tubulin IV immunofluorescence (green) and ELISA measurement of acetylated tubulin (gray). c, TEER from cultures exposed to CSC for 20 days of ALI differentiation; 30 μg/ml reduced cilia but maintained TEER. d, FITC–dextran permeability and apical glucose concentration with CSC, confirming barrier integrity at ≤30 μg/ml CSC. e, bar graph showing no statistically significant difference in resting intracellular calcium concentration [Ca2+]i in cultures treated with 0, 10, and 30 μg/ml CSC as in b–d. Significance was tested with one-way ANOVA with Bonferroni post-test. f, peak calcium responses to apical (ap.) and basolateral (bl.) 2FLI (25 μm), Der 3 p (1 μm), and tryptase (1 μm) in ALIs with 0, 10, or 30 μg/ml CSC. Note increase of apical 2FLI responses with increased CSC. g, bar graph showing apical responses to 2FLI or AC 55541 after CSC exposure were inhibited by PAR-2 antagonist FSLLRY-NH2. h, decreases in cAMP during apical PAR-2 stimulation (50 μm 2 FLI or 20 μm AC 55541 ± 100 μm PAR-2 antagonist FSLLRY-NH2 for 10 min) in ALIs treated with 0 or 30 μg/ml CSC as in b–g were quantified by ELISA. As baseline cAMP levels were too low to quantify by this method, cultures were treated concomitantly with 1 μm adenylyl cyclase–activating compound forskolin to elevate cAMP high enough for measurement. i, TGF-β2 and GM-CSF were measured by ELISA after 24 h apical or basolateral stimulation as in e. Note increased cytokine secretion with apical 2FLI in ALIs exposed to CSC. Significance was determined in b–g and i determined by one-way ANOVA with Bonferroni post-test comparing each value to its respective 0 CSC control; **, p < 0.01. Data points are from 6 to 10 individual ALIs from three to five human patients.
Figure 10.
Figure 10.
R.A. deficiency also alters PAR-2 polarity. a, bar graph showing cellular TG-1 increase in primary human ALIs grown with reduced R.A. b, bar graph showing cellular acetylated tubulin reduction with decreased R.A. c, bar graph showing lower TEER measurements in the absence of R.A. No significant difference was observed between 15 and 50 nm R.A. d, representative Fluo-4 traces showing apical 2FLI response in low R.A. (15 nm) but not normal R.A. (50 nm) culture. Note in left trace that basolateral 2FLI increased calcium even after saturating apical 2FLI, supporting two pools of PAR-2 separated by the epithelial barrier. e, peak change in Fluo-4 F/Fo with apical (ap.) versus basolateral (bl.) 2FLI (50 μm), tryptase (10 μm), or PAR-2 agonist AC 55541 (10 μm) in cultures grown in 15 or 50 nm R.A. f, decreases in cAMP during apical versus basolateral PAR-2 stimulation (50 μm) were quantified by ELISA. As baseline cAMP levels were too low to quantify by this method, cultures were treated concomitantly with 1 μm adenylyl cyclase–activating compound forskolin ± 2FLI as indicated. Significance was determined by one-way ANOVA with Bonferroni post-test comparing all bars with control (no 2FLI) at either 15 or 50 nm R.A.; **, p < 0.01. g, GM-CSF was measured by ELISA after apical or basolateral stimulation with 2FLI (10 μm) or tryptase (20 nm). Note responses were observed to apical stimulation in e and f only in cultures with low R.A. All data points are independent experiments (6–10 per condition) using ALIs cultured from three to six patients (two ALIs per patient). Significance was determined by one-way ANOVA with Bonferroni post-test; **, p < 0.01.
Figure 11.
Figure 11.
Nasal polyp exhibited calcium responses to apical PAR-2 stimulation but control turbinate did not. a, representative image of 2-FLI induced calcium response (Calbryte 590) in a thin piece of polyp mucosa mounted in an Ussing chamber holder and imaged with a spinning disk confocal microscope. b and c, representative traces of polyp (b) and turbinate (c) responses to apical 2FLI (50 μm), trypsin (1 μm), Der p 3 (1 μm), or thrombin (1 μm). ATP (100 μm), which activates apical purinergic receptors, was a positive control. d, peak change in calcium in tissue treated apically with PAR-2 agonists. Each data point is an independent experiment using tissue from separate patients (n = 7 per condition). e, peak change in calcium in polyp tissue treated apically with PAR-2 agonist (50 μm 2FLI or 120 μm SLIGRL-NH2) ± antagonist (80 μm FSLLRY-NH2), confirming responses are due to PAR-2. Each data point is an independent experiment using tissue from separate patients (n = 4 per condition). f, immunofluorescence showing lack of apical PAR-2 staining in polyp ciliated cells with Na+K+ ATPase (NKP) as marker for the basolateral membrane and β-tubulin IV (βTubIV) (cilia marker) shown in green. Pearson's correlation and Mander's overlap coefficients for NKP and PAR-2 in ciliated cells were both ≥0.95 in 10 images analyzed. Scale bars are 10 μm. g, peak change in calcium in isolated ciliated cells; n.s., no significant difference was observed between polyp and turbinate. Significance in d and g was determined by one-way ANOVA with Bonferroni post-test and significance in e by one-way ANOVA with Dunnett's post-test comparing all values to HBSS only control; **, p < 0.01.
Figure 12.
Figure 12.
CBF measurements of nasal epithelial cells exposed to apical or basolateral 2FLI. a and b, representative traces of CBF with 2FLI ± carbenoxolone (100 μm; 30 min preincubation). Control cultures (day 25 at ALI) exhibited no increased CBF with apical (ap.) 2FLI application but an ∼50% increase in CBF with basolateral (bl.) 2FLI. CBX did not inhibit effects of basolateral 2FLI. c, representative trace of ∼50% increase in CBF with apical 2FLI in IL-13–treated ALI (21 days differentiation then 4 subsequent days with IL-13). d–f, representative traces showing CBF in the presence of gap junction inhibitors CBX (d and e) or Gap 27 (f; 10 μm; 30 min pretreatment) in cultures treated with IL-13. Apical 2FLI responses were blocked, but basolateral 2 FLI (d) or apical ATP (e and f) responses were intact. g, bar graph showing peak normalized CBF with agonist as used in a–f. Control cultures are shown in green, and IL-13 cultures are shown in magenta. Each data point is an independent ALI culture from a separate individual patient (n = 5 per condition). Significance was determined by one-way ANOVA with Bonferroni post-test; **, p < 0.01 between bracketed values. h and i, schematic of PAR-2 regulation of ciliary function in well-differentiated epithelium (modeled by control cultures; h) versus remodeled epithelium (modeled by IL-13 stimulated cultures; i). Data support that basolateral PAR-2 is expressed under both conditions and can regulate CBF directly within ciliated cells. Apical PAR-2 is not expressed in ciliated cells, but apical PAR-2 stimulation can transmit signals (likely calcium, Ca2+) to ciliated cells through gap junctions. h and i created with Biorender.com.
Figure 13.
Figure 13.
Model of altered PAR-2 signaling in airway disease. We hypothesize that well-differentiated and highly-ciliated airway epithelium can tolerate brief exposure to fungal or dust mite proteases due to the mainly basolateral expression of PAR-2, which is able to activate inflammatory and other responses only if the epithelium is breached. However, airway remodeling through a variety of disease modifiers can change the polarity of epithelial PAR-2 responses and may sensitize the epithelium to proteases and thus enhance inflammatory responses. Created with Biorender.com.

Similar articles

Cited by

References

    1. Peters T., and Henry P. J. (2009) Protease-activated receptors and prostaglandins in inflammatory lung disease. Br. J. Pharmacol. 158, 1017–1033 10.1111/j.1476-5381.2009.00449.x - DOI - PMC - PubMed
    1. Reed C. E., and Kita H. (2004) The role of protease activation of inflammation in allergic respiratory diseases. J. Allergy Clin. Immunol. 114, 997–1008; quiz 1009 10.1016/j.jaci.2004.07.060 - DOI - PubMed
    1. Molino M., Barnathan E. S., Numerof R., Clark J., Dreyer M., Cumashi A., Hoxie J. A., Schechter N., Woolkalis M., and Brass L. F. (1997) Interactions of mast cell tryptase with thrombin receptors and PAR-2. J. Biol. Chem. 272, 4043–4049 10.1074/jbc.272.7.4043 - DOI - PubMed
    1. Zhou J., Perelman J. M., Kolosov V. P., and Zhou X. (2013) Neutrophil elastase induces MUC5AC secretion via protease-activated receptor 2. Mol. Cell. Biochem. 377, 75–85 10.1007/s11010-013-1572-3 - DOI - PubMed
    1. Matsuwaki Y., Wada K., White T., Moriyama H., and Kita H. (2012) Alternaria fungus induces the production of GM-CSF, interleukin-6, and interleukin-8 and calcium signaling in human airway epithelium through protease-activated receptor 2. Int. Arch. Allergy Immunol. 158, Suppl. 1, 19–29 10.1159/000337756 - DOI - PMC - PubMed

Publication types

LinkOut - more resources