. 2020 Apr 3;368(6486):eaax6367.
doi: 10.1126/science.aax6367.

Structural basis for allosteric PARP-1 retention on DNA breaks

Affiliations

Structural basis for allosteric PARP-1 retention on DNA breaks

Levani Zandarashvili et al. Science. .

Abstract

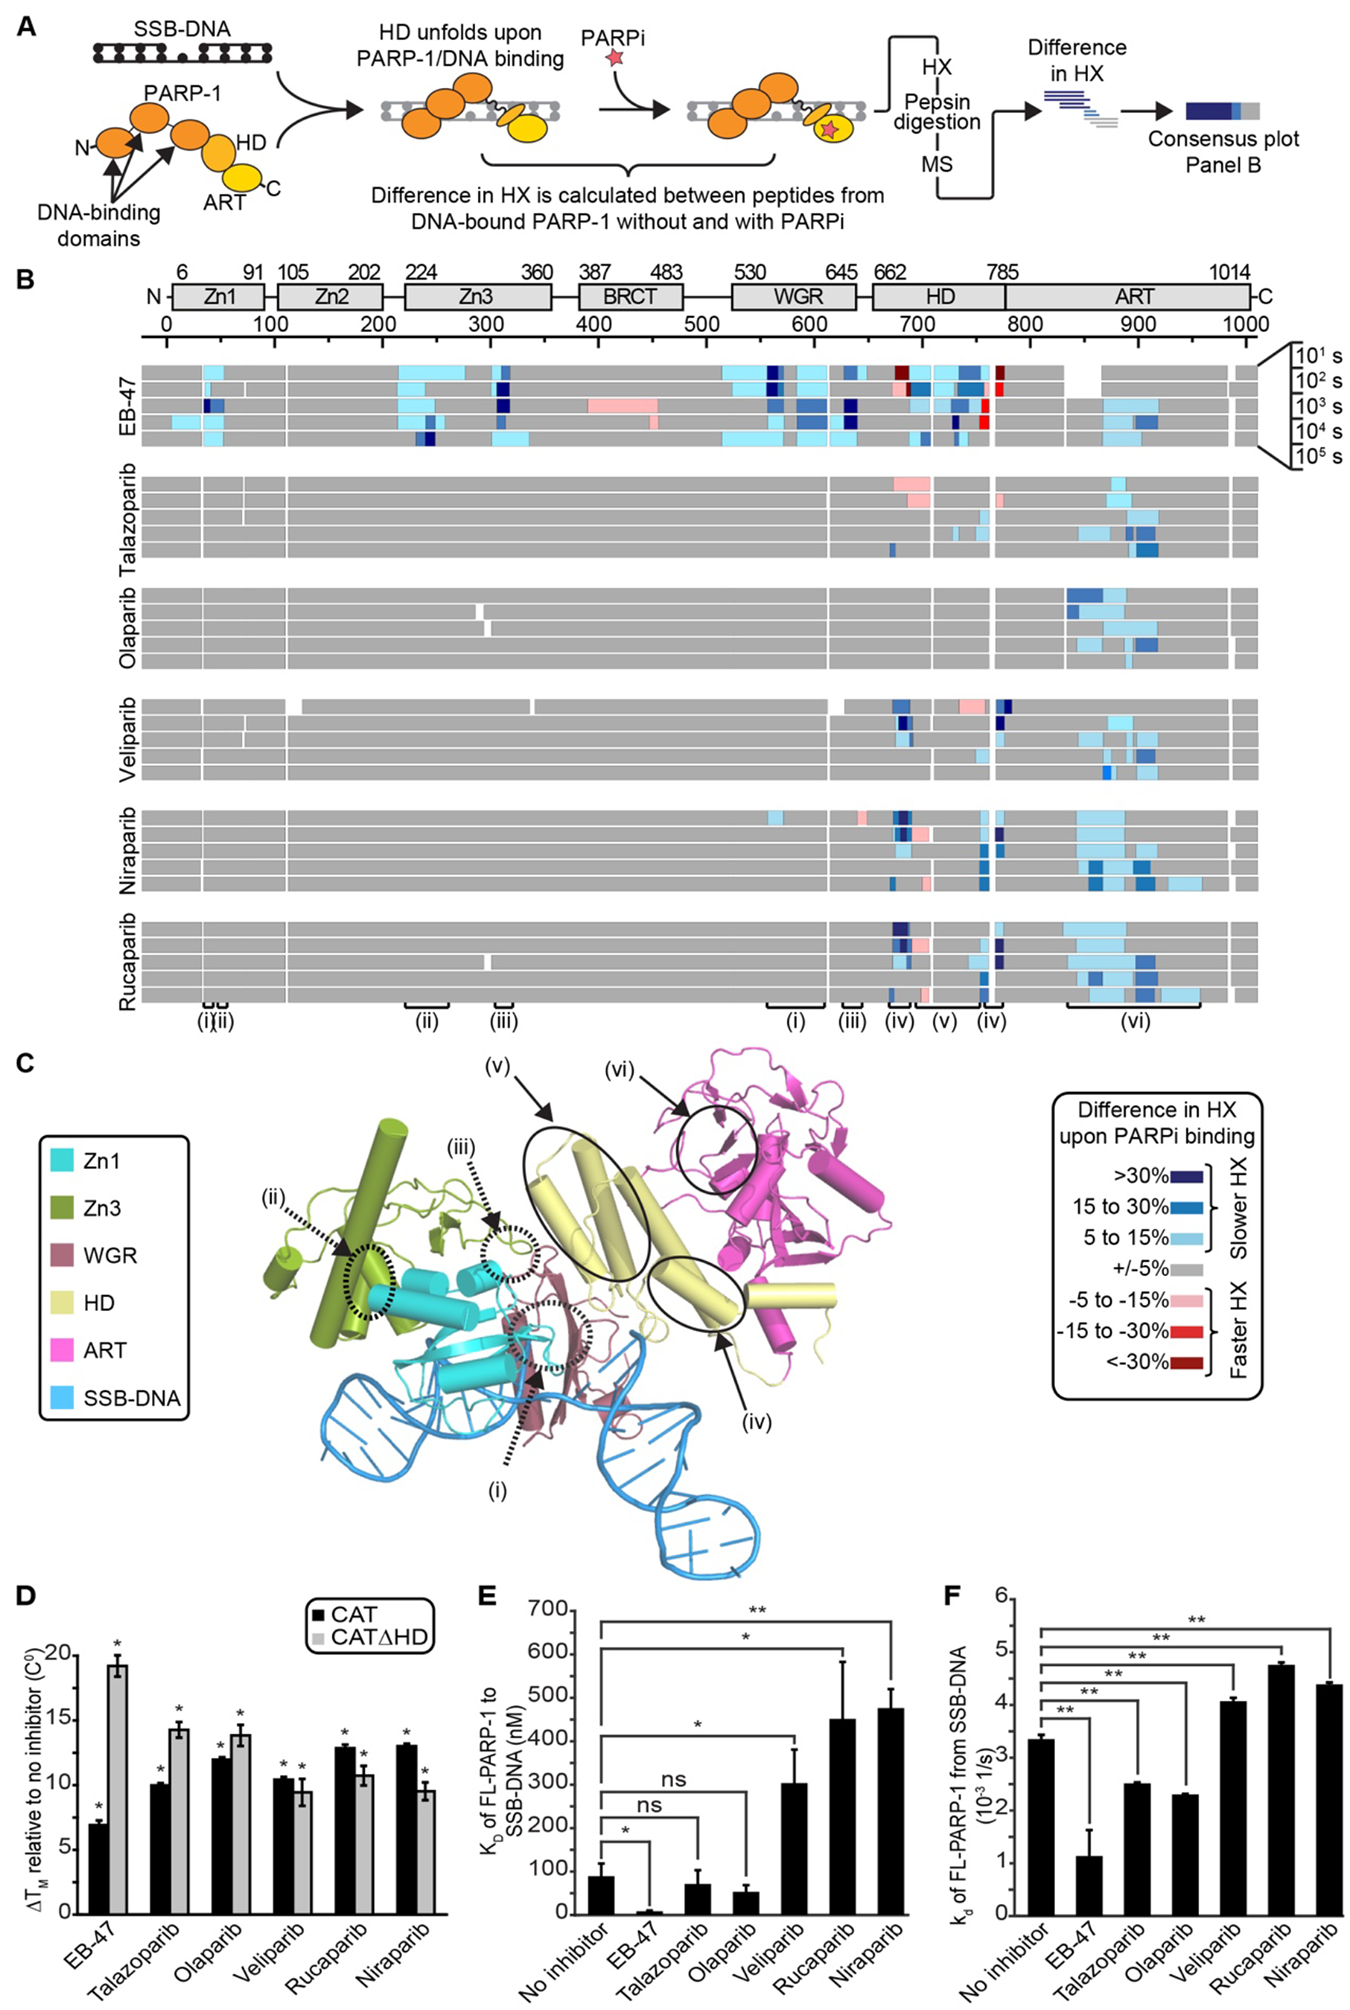
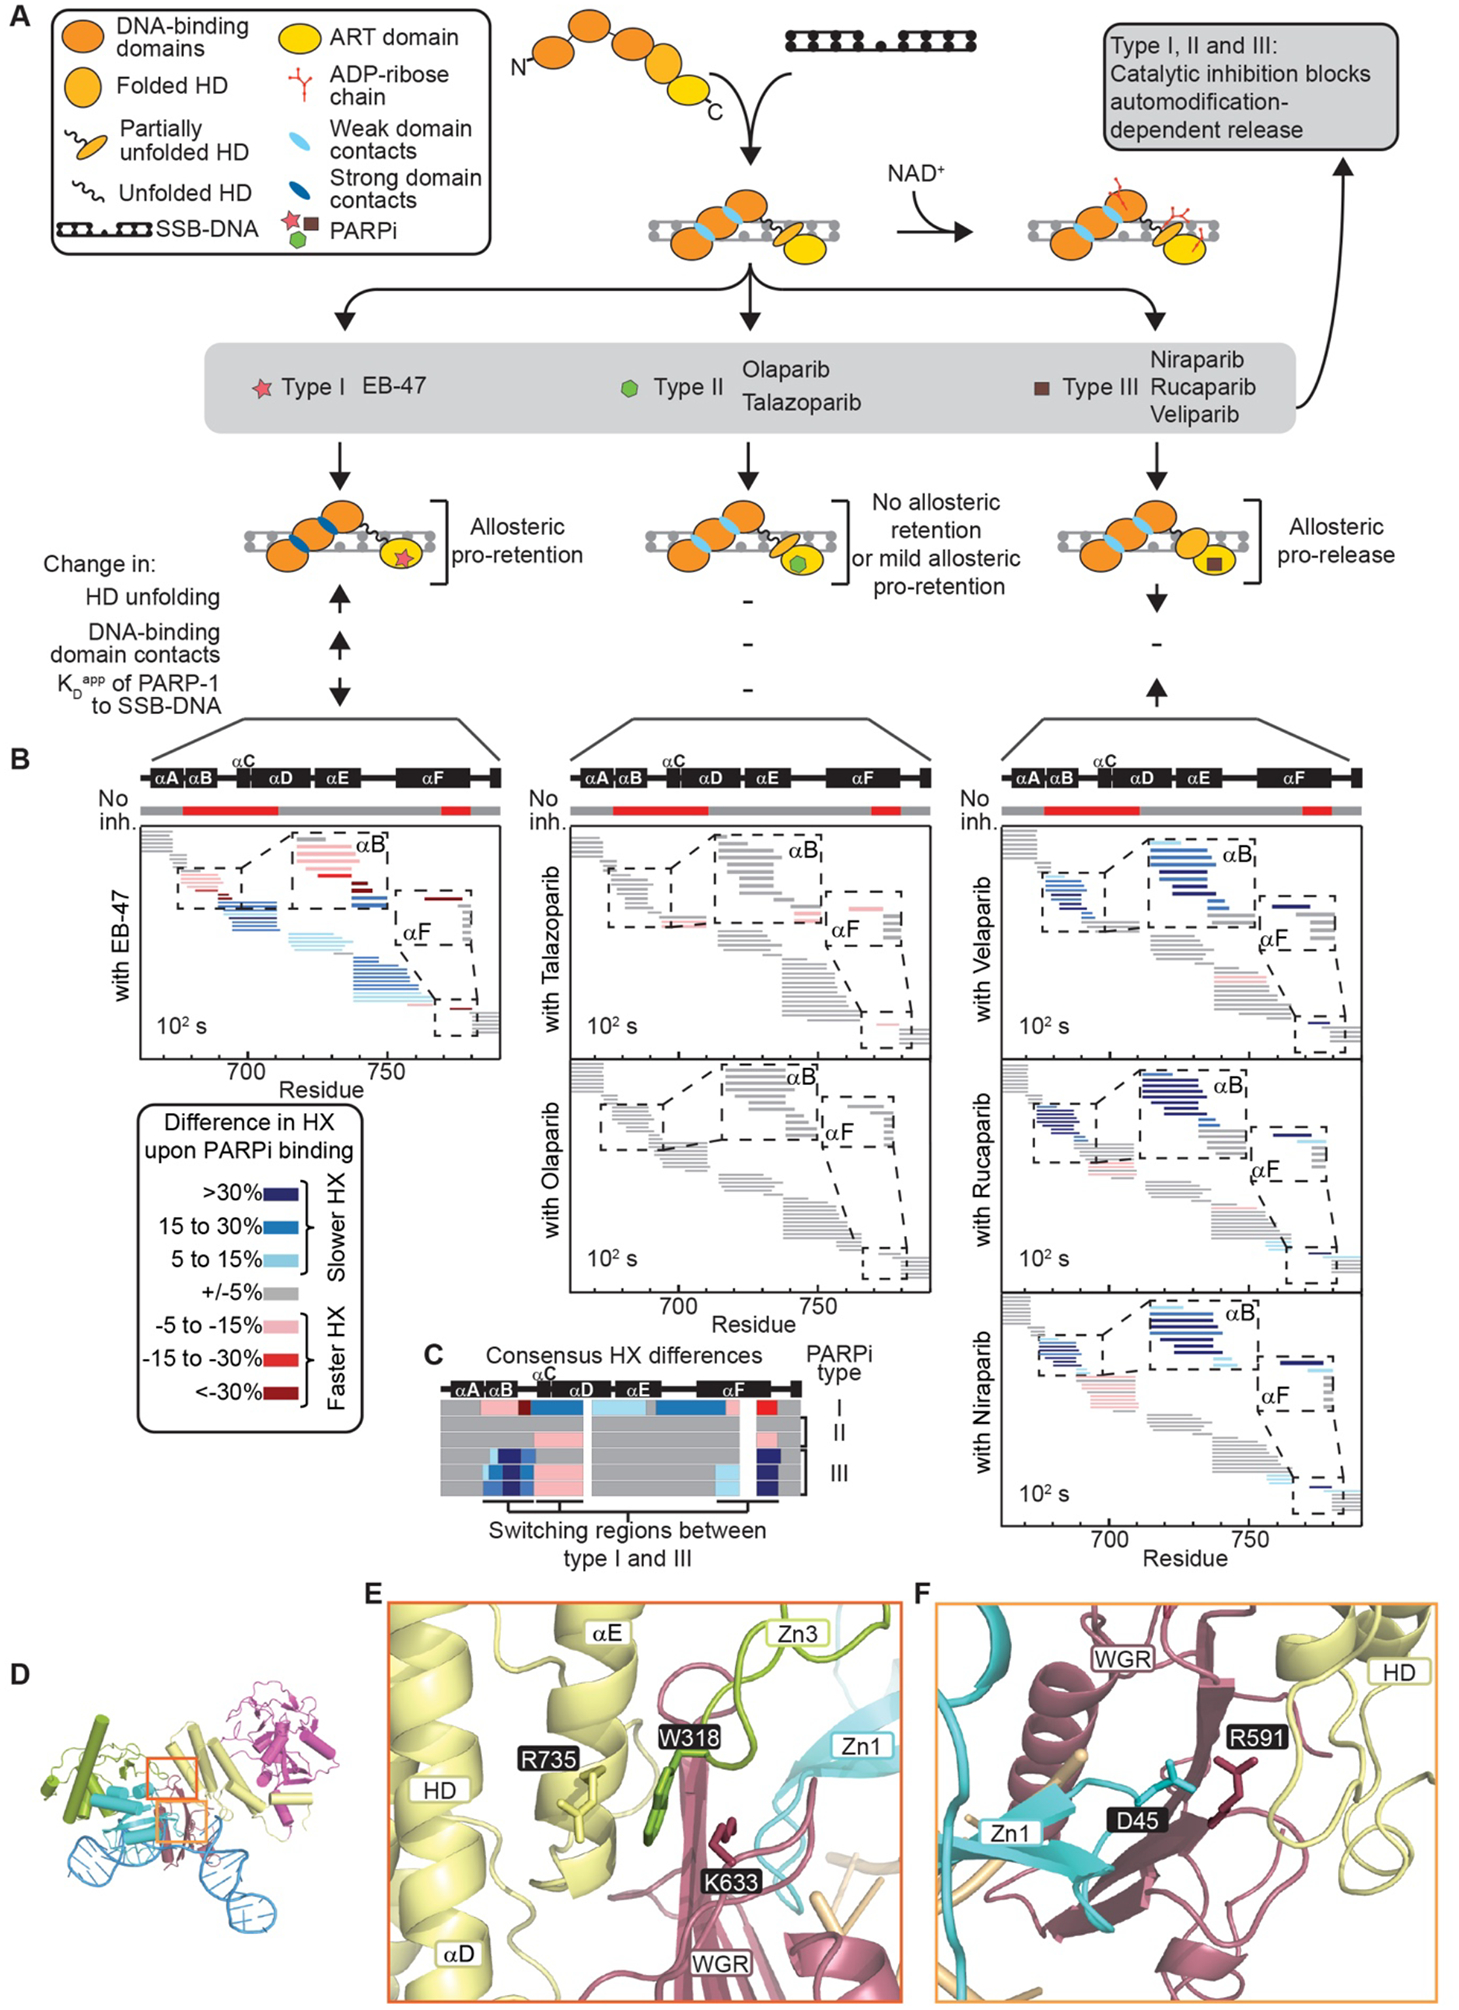
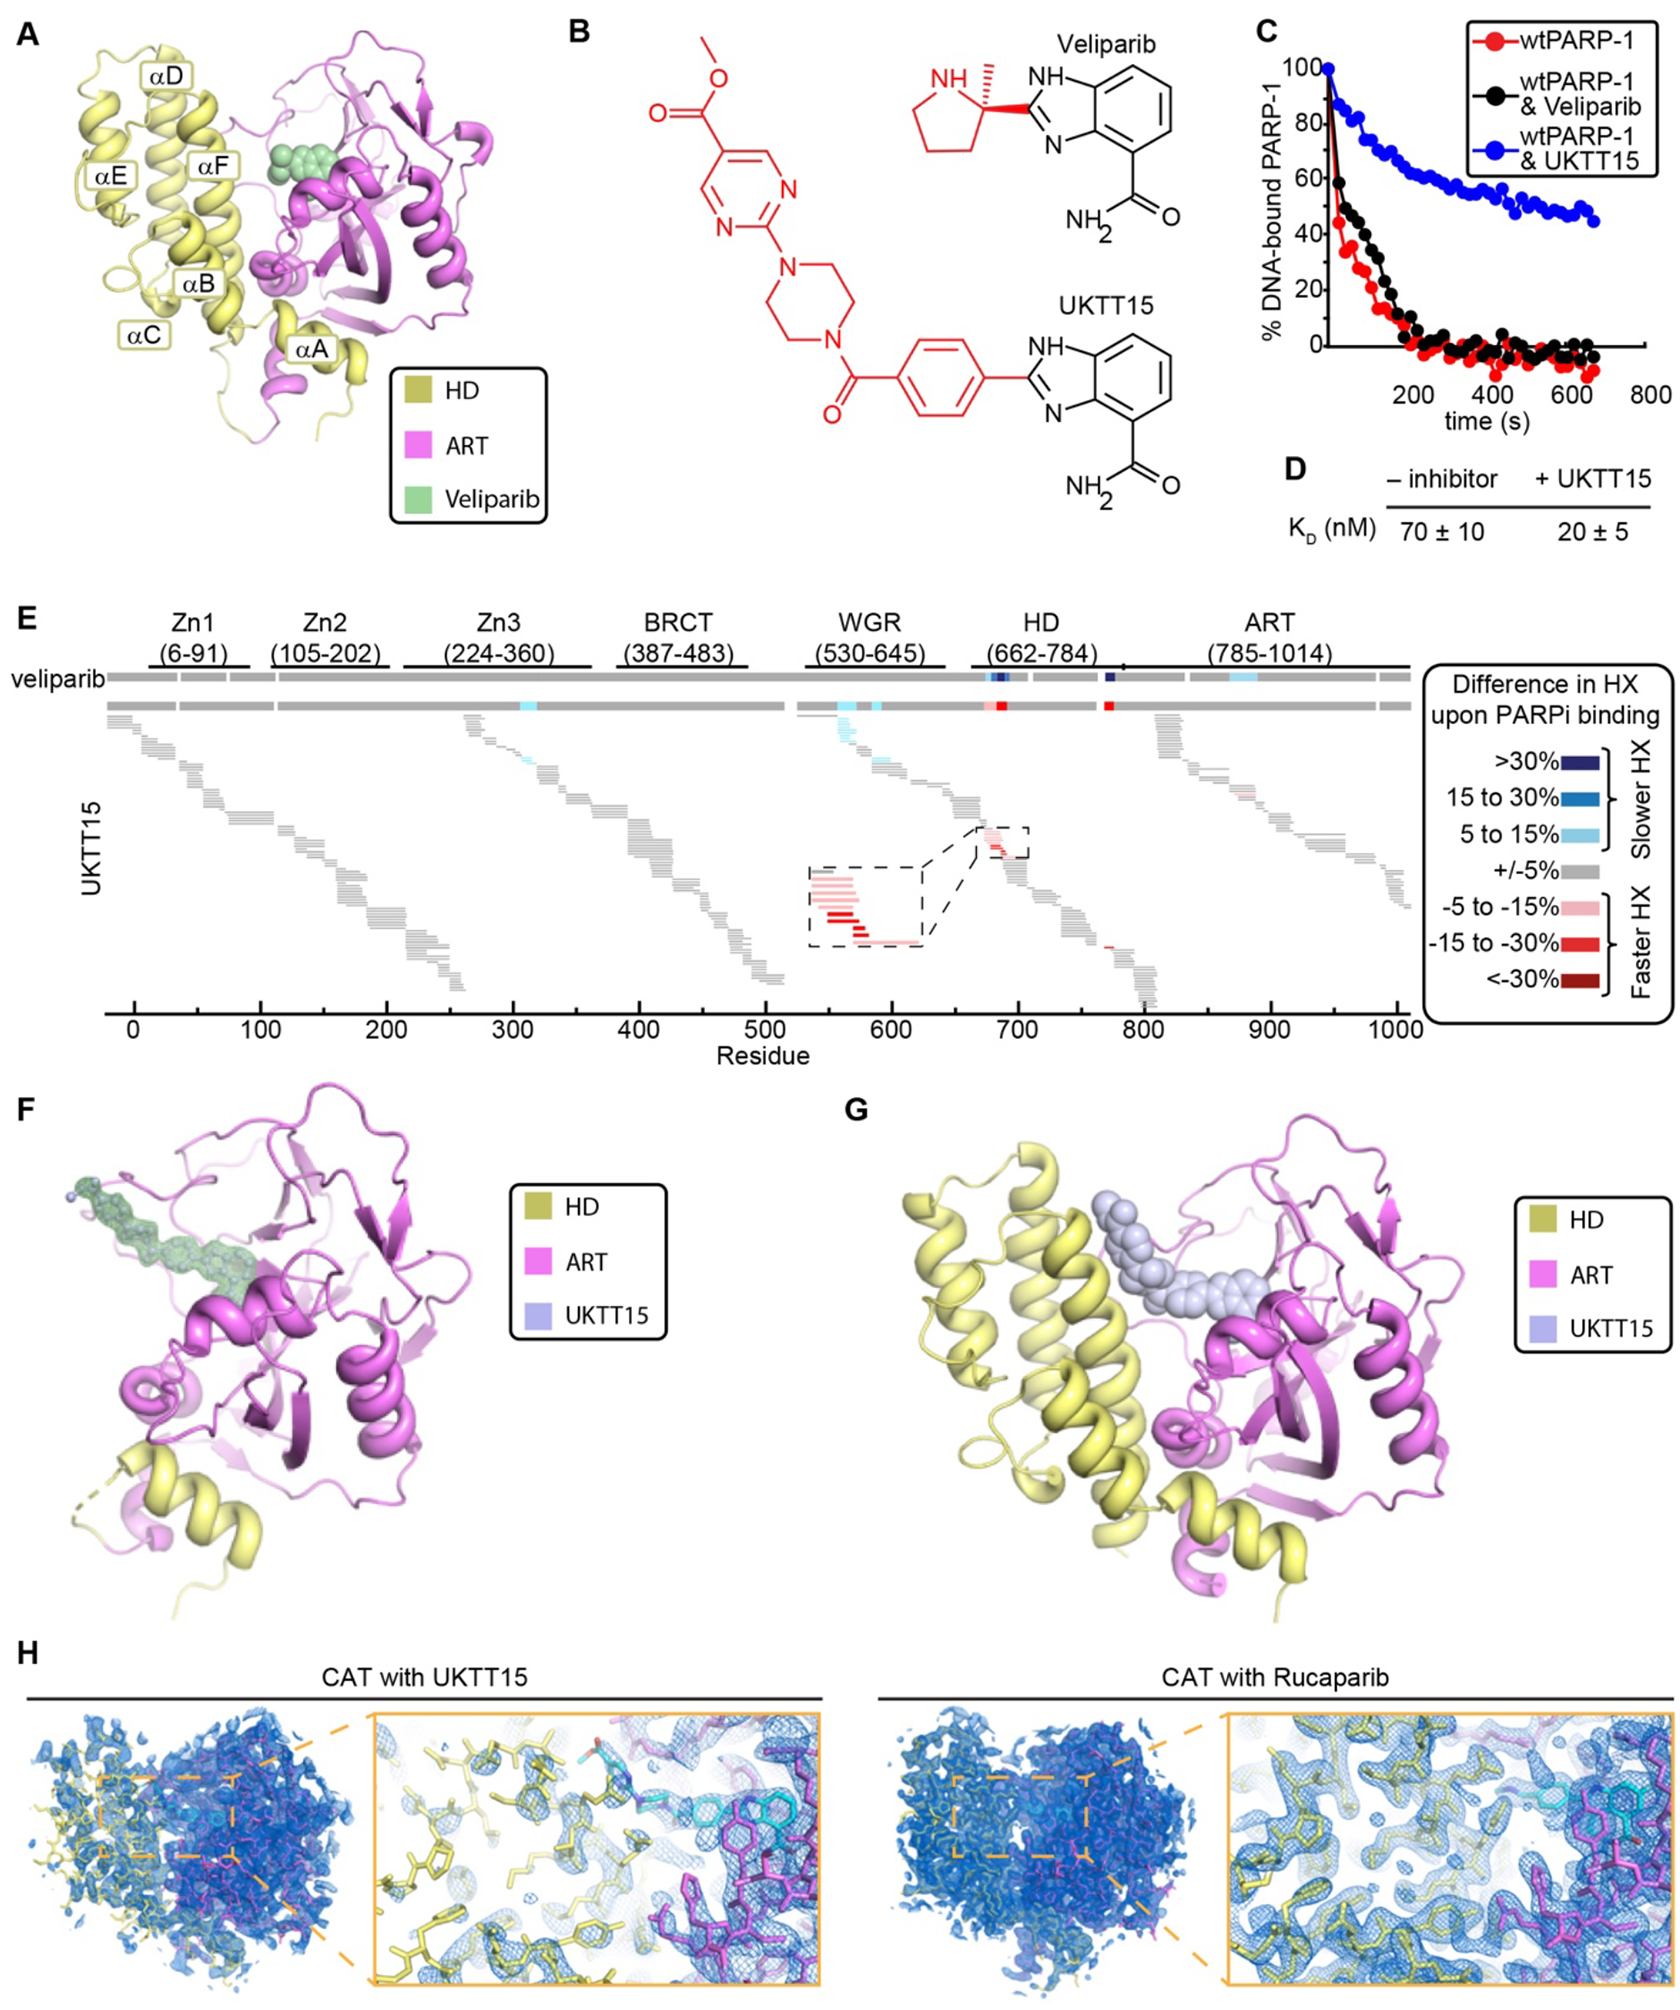
The success of poly(ADP-ribose) polymerase-1 (PARP-1) inhibitors (PARPi) to treat cancer relates to their ability to trap PARP-1 at the site of a DNA break. Although different forms of PARPi all target the catalytic center of the enzyme, they have variable abilities to trap PARP-1. We found that several structurally distinct PARPi drive PARP-1 allostery to promote release from a DNA break. Other inhibitors drive allostery to retain PARP-1 on a DNA break. Further, we generated a new PARPi compound, converting an allosteric pro-release compound to a pro-retention compound and increasing its ability to kill cancer cells. These developments are pertinent to clinical applications where PARP-1 trapping is either desirable or undesirable.


Conflict of interest statement

Competing interests: C.J.L. received research funding from: AstraZeneca, Merck KGaA, Artios. C.J.L. received consultancy, SAB membership or honoraria payments from: Sun Pharma, GLG, Merck KGaA, Vertex, AstraZeneca, Tango, 3rd Rock, Ono Pharma, Artios. C.J.L. has stock in Tango. C.J.L. is also a named inventor on patents describing the use of DNA repair inhibitors and stands to gain from the development as part of the ICR “Rewards to Inventors” scheme. T.T.T., J.M.P., and B.E.B. are co-founders of Hysplex, LLC, with interests in PARPi development.

Figures

Figure 1.
Figure 1.. PARPi drive distinct allosteric effects through the multi-domain architecture of PARP-1, culminating in increases or decreases in affinity for an SSB.
(A) Schematic of HXMS experiments with different forms of PARPi. (B) The percentage difference of HX with and without the indicated form of PARPi is calculated for each of >150 unique partially overlapping peptides for each indicated timepoint (see also Fig. S1), and then the consensus at each amino acid positions is plotted. The color key for binning of HX differences is shown to the lower right of the panel. Small white regions indicate gaps in peptide coverage. Roman numerals indicate regions highlighted in the structural model in panel C. (C) Combined model of the crystal structure of the PARP-1 (Zn1, Zn3, WGR-CAT)/DNA complex, and the NMR structure of the Zn1-Zn2/SSB-DNA complex (39), highlighting numbered regions of interest and colored by domain. Zn2 was omitted for clarity. HD, helical domain; ART, ADP-ribosyl transferase; Zn1/Zn2/Zn3, zinc finger domains; WGR, tryptophan-glycine-arginine domain. (D) DSF thermal stability of CAT and CATΔHD in the presence of the indicated forms of PARPi. (E) Apparent equilibrium binding affinity KD of PARP-1 to SSB-DNA measured by FP in the absence or presence of the indicated form of PARPi. (F) Dissociation rate constant kd of PARP-1 from SSB-DNA measured by SPR in the absence or presence of the indicated PARPi. For panels D-F, error bars represent s.d. from at least three measurements (see also Table S1). The results of student’s T-tests are shown (* represents p values <0.01, ** represents p values <0.001; ns, represents not significant).
Figure 2.
Figure 2.. Three distinct types of PARPi based on the presence and outcome of allosteric changes in PARP-1.
(A) Classification of PARPi into three types based on their mechanistic effects on the PARP-1/SSB-DNA complex. (B) Percent difference in HX upon binding to the indicated form of PARPi at 102 s in the HD region of PARP-1. The horizontal bar on top of the plots indicates in red the regions with faster HX when PARP-1 binds to SSB-DNA (“No inh.” – no inhibitor). Each small horizontal bar represents a peptide in our data set in the indicated region of PARP-1 with coloring indicating the HX difference upon binding each inhibitor. (C) A plot of the consensus HX behavior over the region shown in panel B is shown for each of the inhibitors, highlighting the regions where there is reciprocal behavior in Type I versus Type III PARPi. (D-F) PARP-1 structure (D) highlighting the allosteric pathway and key amino acids involved in interdomain interactions between WGR-Zn3-HD (E) and Zn1-WGR-HD domains (F).
Figure 3.
Figure 3.. Reverse allostery conferred by a Type I PARPi initiates via contact with the HD.
(A) Percent difference in HX upon binding EB-47 is calculated for each peptide in R591C and D766/770A mutant versions of PARP-1 and displayed in a similar manner as in Fig. 2B, except that the entirety of the protein is shown. A plot of the consensus HX differences for WT PARP-1 is shown on the top, and the consensus plot is also shown for R591C and D766/770A. (B) HX of a specific peptide from the αB helix of the HD for the WT (left), R591C (middle) and D766/770A (right) versions of PARP-1 in the indicated conditions. Each experiment was performed in triplicate and * indicates timepoints with a p-value <0.01 for the t-test between PARP-1/SSB-DNA experiments with or without EB-47. Error bars represent s.d. from three measurements. (C) FP DNA competition experiments with WT, R591C, and D766/770A versions of PARP-1 bound to SSB-DNA with or without EB-47. Each experiment was performed three times. Student’s t-test was performed at 60 s and 300 s to compare the percentage of DNA-bound PARP-1 between samples with or without EB-47 for each version of protein. The p-value was <0.001 at both times for the wtPARP-1, but it was not significant (>0.01) for all the mutant samples. (D) Crystal structure of PARP-1 CAT domain in complex with EB-47 (see also Table S2). D766 and D770 amino acids are shown to highlight the clash between EB-47 and αF helix of the HD (see also Fig. S13).
Figure 4.
Figure 4.. Converting a Type III PARPi to Type I.
(A) Crystal structure of PARP-1 CAT domain in complex with veliparib (PDB code 2RD6). (B) Chemical structures of veliparib and UKTT15. (C) FP DNA competition experiments with WT PARP-1 in complex with SSB-DNA in the presence or absence of the indicated compounds. Each experiment was performed three times. A student’s t-test of the release difference caused by the presence of PARPi was calculated at 60 s and 300 s and had a p-value <0.01 at both times for UKTT15, but was not significant (>0.01) for veliparib. (D) KD measurements derived from FP DNA binding assay for WT PARP-1 and SSB-DNA in the presence or absence of UKTT15. (E) Percentage HX difference for each peptide of the WT PARP-1/SSB-DNA complex upon binding of UKTT15 inhibitor (data presented as in Fig. 3A). The consensus HX difference plot for the binding of the parent compound, veliparib, is shown on top for comparison. (F) Crystal structure of PARP-1 CATΔHD in complex with UKTT15. A weighted FO-FC difference electron density map (green) is shown contoured at 3s around UKTT15 (light blue sticks), illustrating the density present prior to the modeling of UKTT15. (G) Crystal structure of PARP-1 CAT domain in complex with UKTT15 (light blue spheres), in which the compound adopts a similar overall conformation as that observed in panel F (see Fig. S13D for comparison). (H) Weighted 2FO-FC electron density maps contoured at 1σ with the designated CAT/PARPi complexes overlaid, and zoomed views around the PARPi/αF helix region. The ART and HD domains are well represented in the electron density of the CAT/rucaparib complex, whereas in the CAT/UKTT15 complex the HD density is weak relative to the ART, most likely reflecting a high level of mobility associated with binding UKTT15.
Figure 5.
Figure 5.. Toxic effect of PARPi in cancer cells can be tuned through modulation of allosteric SSB-DNA retention without altering enzymatic inhibition.
(A) Chromatin fractionation assay for cells in the presence of increasing concentration of veliparib, talazoparib or UKTT15 (1, 10 and 25 μM) and treated with 0.01% MMS. (B) PAR levels in cells treated with the inhibitor veliparib, talazoparib or UKTT15 at 0.01, 0.1, 1 and 10 μM in the presence of 0.01% MMS. (C) Kinetics of PARP-1 trapping at sites of DNA damage in cells. CAL51 PARP-1−/− cells were transfected with PARP-1-GFP and exposed to localized microirradiation. After microirradiation, PARP-1 localization was monitored over time. The experiment was performed in the presence of talazoparib, veliparib, or UKTT15, as well as a DMSO control representing no inhibitor. Student’s t-test was performed at the 150 s time point, comparing the control (DMSO) to the indicated inhibitors, and p-value was <0.0001 in all cases. (D) Dose dependence of kinetics of PARP-1 trapping at sites of DNA damage in cells in presence of the indicated concentrations of UKTT15. Student’s t-test was performed at the 150 s time point, comparing the control (DMSO) to the indicated concentrations of UKTT15, and p-value was <0.0001 in all cases. (E) Survival assay for SUM149PT-BRCA1mut and SUM149PT-BRCA1rev cells. Students t-test was used to calculate p-score between mutant and reverted cell lines for both PARPi. Each concentration point with statistically significant difference (p-value<0.01) is denoted with * of corresponding color. P-values were also calculated between assays using SUM149PT-BRCA1mut cells with different inhibitors and statistically significant differences were indicated with cyan asterisk. (F) Survival assays for the parental or PARP-1−/− cells in the presence of indicated concentrations of UKTT15. Students t-test was used to calculate p-score between parental and PARP-1−/− cell lines.
Figure 6.
Figure 6.. Model for allosteric and non-allosteric contributions to cellular toxicity by Type I, II, and III PARPi.
PARP-1 trapping in a cancer cell generates a lesion that becomes toxic over time. The effectiveness of enzymatic inhibition is a key contributor for all three PARPi Types (vertical dimension of plot). The three PARPi Types vary by how they influence the allosteric communication that culminates in a propensity to either be released or retained at the site of broken DNA (horizontal dimension). Tuning PARPi towards pro-retention drives trapping and cancer cell killing. Tuning towards pro-release may limit trapping and preserve cell viability, which is relevant for PARPi use in other disease contexts (e.g. cardiovascular disease and several common neurodegenerative diseases).

Comment in

  • Tuning drug binding.
    Slade D, Eustermann S. Slade D, et al. Science. 2020 Apr 3;368(6486):30-31. doi: 10.1126/science.abb1462. Science. 2020. PMID: 32241937 Free PMC article. No abstract available.

Similar articles

Cited by

References

    1. D’Amours D, Desnoyers S, D’Silva I, Poirier GG, Poly(ADP-ribosyl)ation reactions in the regulation of nuclear functions. Biochem. J 342 (Pt 2), 249–268 (1999). - PMC - PubMed
    1. Gupte R, Liu Z, Kraus WL, PARPs and ADP-ribosylation: recent advances linking molecular functions to biological outcomes. Genes Dev 31, 101–126 (2017). - PMC - PubMed
    1. Pascal JM, Ellenberger T, The rise and fall of poly(ADP-ribose): An enzymatic perspective. DNA Repair. 32, 10–16 (2015). - PMC - PubMed
    1. Dawicki-McKenna JM, Langelier M-F, DeNizio JE, Riccio AA, Cao CD, Karch KR, McCauley M, Steffen JD, Black BE, Pascal JM, PARP-1 Activation Requires Local Unfolding of an Autoinhibitory Domain. Mol. Cell. 60, 755–768 (2015). - PMC - PubMed
    1. Langelier M-F, Planck JL, Roy S, Pascal JM, Structural basis for DNA damage-dependent poly(ADP-ribosyl)ation by human PARP-1. Science. 336, 728–732 (2012). - PMC - PubMed

Publication types

MeSH terms