. 2020 Apr 2;3(1):158.
doi: 10.1038/s42003-020-0873-9.

Pan-cancer molecular analysis of the RB tumor suppressor pathway

Affiliations

Pan-cancer molecular analysis of the RB tumor suppressor pathway

Erik S Knudsen et al. Commun Biol. .

Abstract

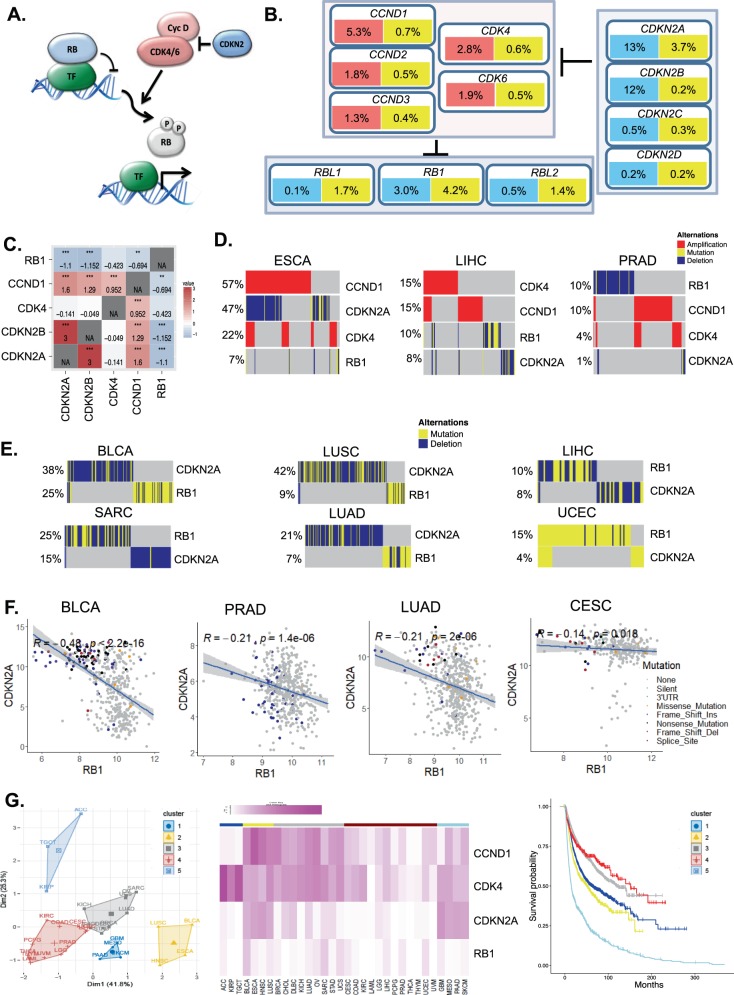
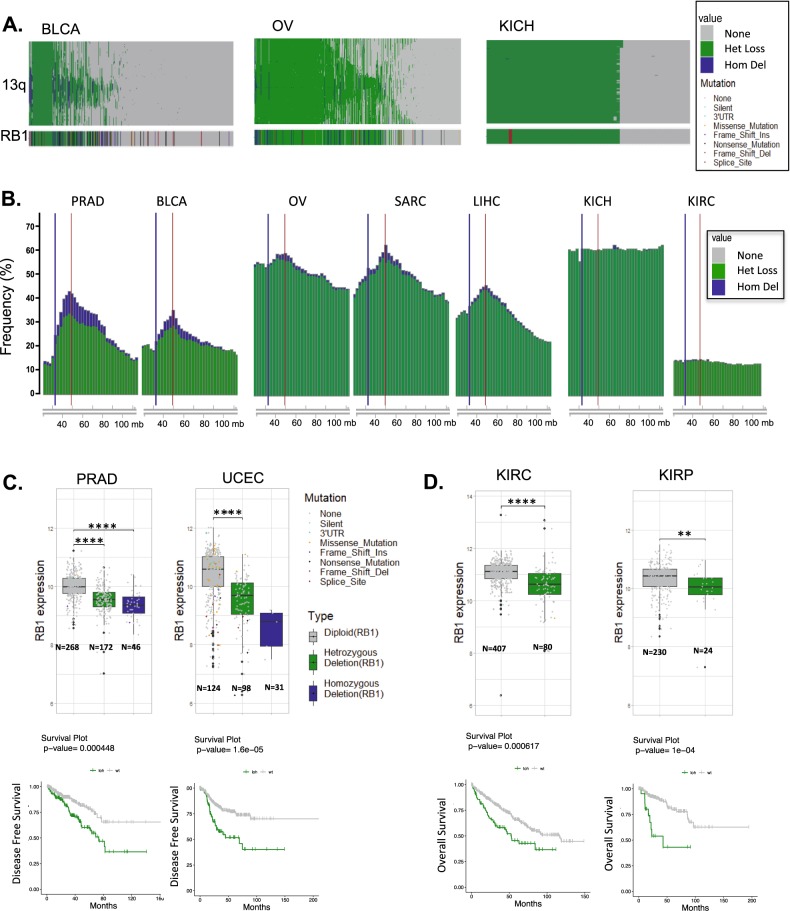
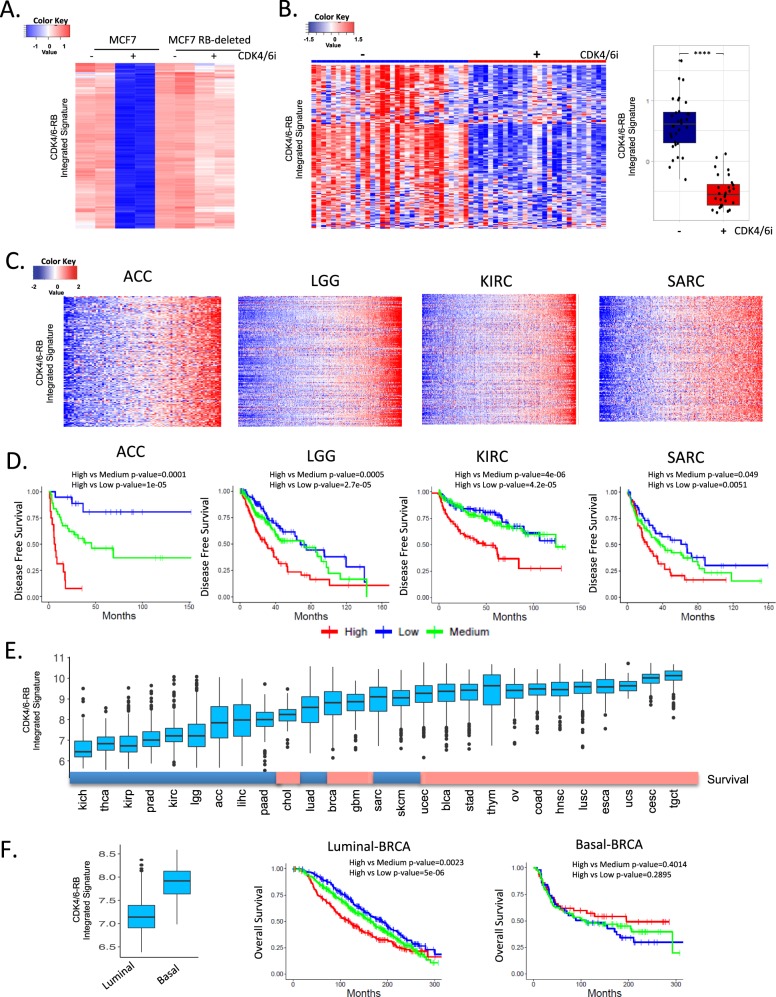
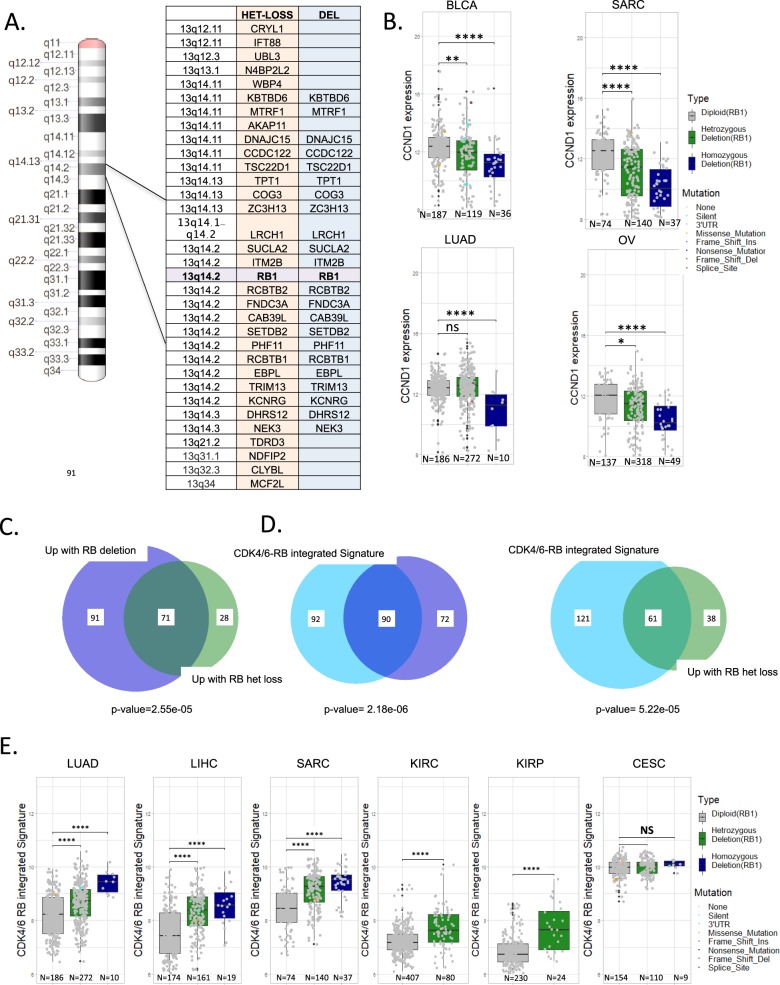
The retinoblastoma tumor suppressor gene (RB1) plays a critical role in coordinating multiple pathways that impact cancer initiation, disease progression, and therapeutic responses. Here we probed molecular features associated with the RB-pathway across 31 tumor-types. While the RB-pathway has been purported to exhibit multiple mutually exclusive genetic events, only RB1 alteration is mutually exclusive with deregulation of CDK4/6 activity. An ER+ breast cancer model with targeted RB1 deletion was used to identify signatures of CDK4/6 activity and RB-dependency (CDK4/6-RB integrated signature). This signature was prognostic in tumor-types with gene expression features indicative of slower growth. Single copy loss on chromosome 13q encompassing the RB1 locus is prevalent in many cancers, yielding reduced expression of multiple genes in cis, and is inversely related to the CDK4/6-RB integrated signature supporting a cause-effect relationship. Genes that are positively and inversely correlated with the CDK4/6-RB integrated signature define new tumor-specific pathways associated with RB-pathway activity.


Conflict of interest statement

The authors have no competing financial or non-financial interests associated with the present study. Erik Knudsen is an Editorial Board Member for Communications Biology, but was not involved in the editorial review of, nor the decision to publish this article.

Figures

Fig. 1
Fig. 1. Analysis of the core RB-pathway.
a Generic depiction of the core RB-pathway. CDK4/6 activity is stimulated by D-type cyclins, which can be inhibited by members of the CDKN2 gene family. CDK4/6 activity converges on RB-family members to mediate phosphorylation and functional inactivation. b Summary of pan-cancer data indicating frequency of deletions (blue), amplifications (red), and mutations (yellow) affecting core pathway genes. c Odds ratio for co-occurrence (red) or mutual exclusivity (blue) are shown in the heatmap from all cancer cases (*p < 0.05, **p < 0.01, ***p < 0.001). d Oncoprints from ESCA, LIHC, and PRAD tumors are shown. e Oncoprints of tumors exhibiting relatively frequent RB loss/mutation. f Pearson correlation analysis was used to define the relationship between the expression of CDKN2A and RB1. The R-value and related p-value are shown, with the shading denoting the 95% confidence interval. The legend summarized genetic variations in the RB1 gene. g The percentage of alterations in CCND1, CDK4, RB1, and CDKN2A were employed for K-means clustering across all tumor types. This approach yielded five clusters. The association of each cluster with disease-free survival is shown in the Kaplan–Meier plot.
Fig. 2
Fig. 2. Perturbations of RB1 locus in cancer.
a Copy number analysis of single copy loss (green) and deletion (blue) of genes in cis along chromosome arm 13q. Data is shown for BLCA, OV, and KICH, the RB1 gene data is shown for reference. b Frequency plots of single copy (green) and deletion (blue) along 13q are shown for the indicated tumor types. The red line denotes the position of RB1 and blue line denotes the position of BRCA2 on chromosome 13q (chromosomal location by nucleotide number is shown). c Analysis of RB1 expression in tumors exhibiting diploid, heterozygous loss, or deletion of the RB1 locus in PRAD and UCEC (Student’s t-test two sided: **p < 0.01, ***p < 0.001,****p < 0.0001). Kaplan–Meier analysis of disease free survival by diploid vs. heterozygous loss of the RB1 locus. Statistical analysis is by log-rank approach. d Analysis of RB1 expression in tumors exhibiting diploid and heterozygous loss of the RB1 locus KIRP and KIRC (Student’s t-test two sided: **p < 0.01, ***p < 0.001). Kaplan–Meier analysis of overall survival stratified by diploid vs. heterozygous loss of RB1 locus. Statistical analysis is by log-rank approach.
Fig. 3
Fig. 3. CDK4/6-RB integrated signature and prognosis.
a MCF7 cells and isogenic RB1 deleted model were treated with CDK4/6 inhibitor (250 nM palbociclib) for 48 h. RNA sequencing was used to define transcriptional repression events that are RB dependent thereby linking CDK4/6 inhibition to RB-activation. b The CDK4/6-RB integrated signature was applied to data from the NeoPalaAnna trial and exhibited consistent repression in this clinical cohort of tumors treated with CDK4/6 inhibitors (pre-treatment N = 32, on treatment N = 28). Box plot shows difference in the integrated signature between pre and on-treatment samples (Student’s t-test two sided: ****p < 0.0001) c Heatmaps illustrate that general behavior of the CDK4/6-RB integrated signature across several tumors types. d Kaplan–Meier analysis of the indicated tumor types stratified by CDK4/6-RB integrated signature. Disease-free survival is shown, and statistical analysis is by log-rank approach. e Pan-cancer relationship of the CDK4/6-RB integrated signature expression value. Color bar indicates tumors wherein high levels of the CDK4/6-RB integrated signature (indicative of high CDK4/6 activity or RB loss) are significantly associated with poor prognosis (blue) or not (red). f Relative expression of the CDK4/6-RB integrated signature in luminal (N = 1175) vs. basal (N = 209) breast cancer subtypes in the METABRIC data set (Student’s t-test two side: p < 0.001). Kaplan–Meier analysis of luminal and basal breast cancer stratified by the CDK4/6-RB integrated signature. Statistical analysis is by log-rank approach.
Fig. 4
Fig. 4. Association of RB1 gene dosage with gene expression.
a Significantly altered genes between heterozygous loss and wild-type or deep deletion and wild-type were determined (1 logFC and p < 0.05). These gene lists were filtered for recurrence of >33% or >66% for heterozygosity and deletion respectively across different tumor types. >90% of the downregulated genes identified in this fashion were located in cis relative to RB1 as shown. b Consistent with CCND1 amplification being mutually exclusive with RB1 loss, RB1 deletion was associated with lower expression levels of CCND1 (Student’s t-test two sided:*p < 0.05, **p < 0.01, ***p < 0.001, ****p < 0.0001). c Relationship between consistently upregulated genes with heterozygous loss and deep deletion. Statistical significance was determined by hypergeometric test. d Intersection between upregulated genes with heterozygous loss or deep deletion with the CDK4/6-RB integrated signature. Statistical significance was determined by hypergeometric test. e Relationship between RB1 gene dosage and the CDK4/6-RB integrated signature in select tumor types (Student’s t-test two sided: ***p < 0.001, **p < 0.01, NS non-significant).
Fig. 5
Fig. 5. Defining pathway features beyond cell cycle.
a To define features beyond cell cycle control bootstrapping was performed to define genes that were positively and inversely correlated with the CDK4/6-RB integrated signature. Ranked gene set enrichment coupled with reactome pathway analysis generated key nodes of regulation for each tumor types. b K-means clustering of the correlation coefficients yielded three predominantly positively correlated clusters, and two inversely correlated clusters. c Gene ontology and transcription factor enrichment analysis for the genes in the positively correlated clusters was performed in ENRICHR. Top enriched gene ontologies and transcription factor binding sites are shown. Heatmap showing selected genes from each of the clusters. d Gene ontology and transcription factor enrichment analysis for the genes in the negatively correlated clusters was performed in ENRICHR. Top enriched gene ontologies and transcription factor binding sites are shown. Heatmap showing selected genes from each of the clusters. e Relationship of correlated genes for breast cancer relative to gene expression analysis from MCF7 cells treated with CDK4/6 inhibitors (red = positively correlated, blue = negatively correlated. f Expression levels of select genes in the positively and negatively correlated expression groups in DMSO control (black) or palbociclib treated (green) groups. The mean and standard deviation of the gene expression are shown. Statistical analysis was determined by Student’s t-test: CHEK1 p = 0.014, BRCA1 p = 0.002, GINS1 p = 0.004, NUP120 p = 0.02, NUP205 p = 0.009, NUP188 p = 0.019 PIK3IP1 p < 0.001, CRY2 p = 0.002, CTO p = 0.014 HLA-DMA p = 0.019.

References

    1. Burkhart DL, Sage J. Cellular mechanisms of tumour suppression by the retinoblastoma gene. Nat. Rev. Cancer. 2008;8:671–682. doi: 10.1038/nrc2399. - DOI - PMC - PubMed
    1. Knudsen ES, Pruitt SC, Hershberger PA, Witkiewicz AK, Goodrich DW. Cell cycle and beyond: exploiting new RB1 controlled mechanisms for cancer therapy. Trends Cancer. 2019;5:308–324. doi: 10.1016/j.trecan.2019.03.005. - DOI - PMC - PubMed
    1. Dick FA, Goodrich DW, Sage J, Dyson NJ. Non-canonical functions of the RB protein in cancer. Nat. Rev. Cancer. 2018;18:442–51.. doi: 10.1038/s41568-018-0008-5. - DOI - PMC - PubMed
    1. Sherr CJ, Beach D, Shapiro GI. Targeting CDK4 and CDK6: from discovery to therapy. Cancer Discov. 2016;6:353–367. doi: 10.1158/2159-8290.CD-15-0894. - DOI - PMC - PubMed
    1. Ciriello G, Cerami E, Sander C, Schultz N. Mutual exclusivity analysis identifies oncogenic network modules. Genome Res. 2012;22:398–406. doi: 10.1101/gr.125567.111. - DOI - PMC - PubMed

Publication types

MeSH terms