. 2020 Apr 2;10(1):5809.
doi: 10.1038/s41598-020-62760-y.

Tumor-penetrating peptide for systemic targeting of Tenascin-C

Affiliations

Tumor-penetrating peptide for systemic targeting of Tenascin-C

Prakash Lingasamy et al. Sci Rep. .

Abstract

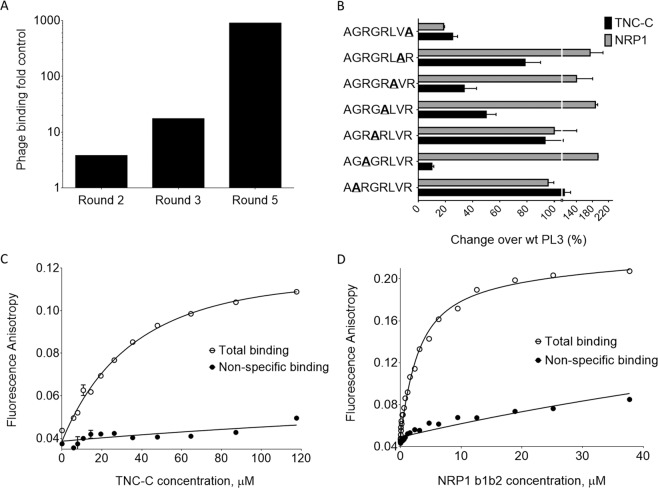
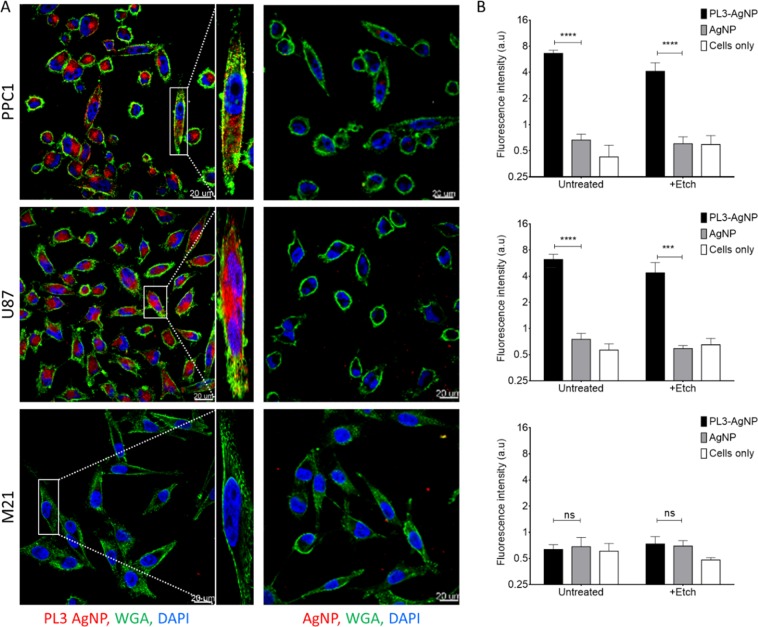
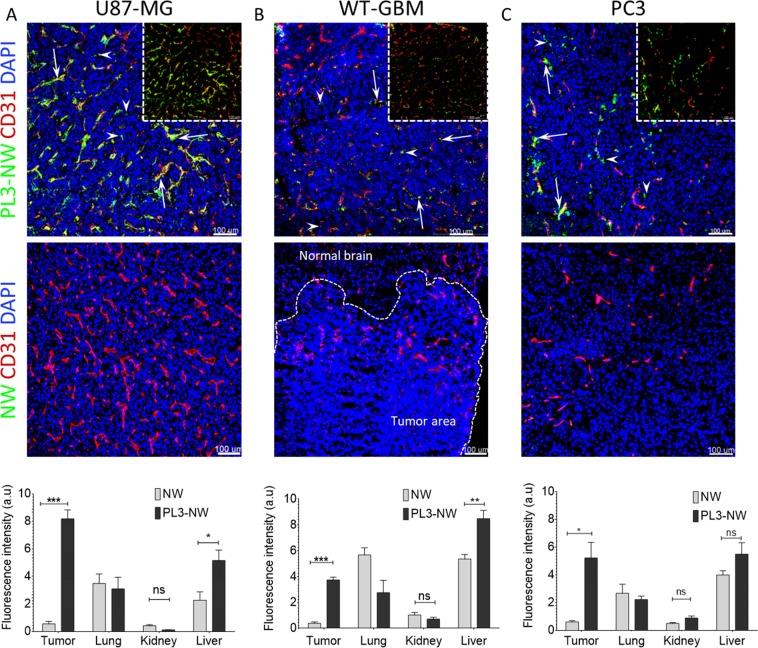
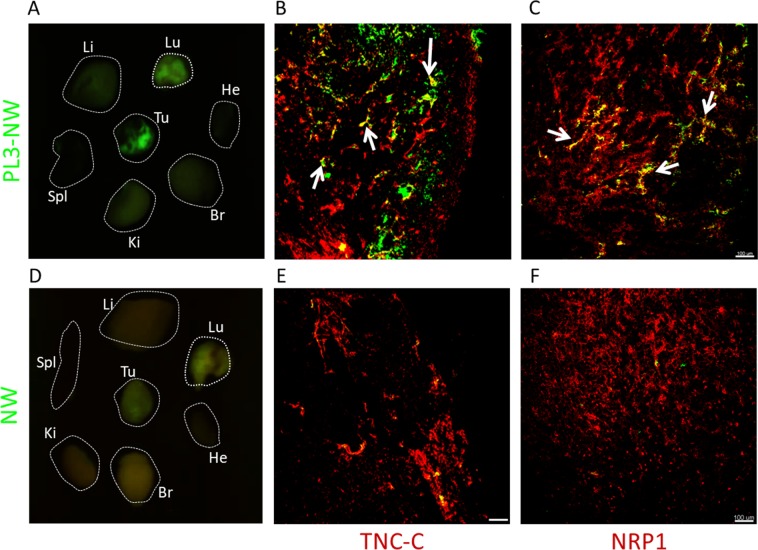
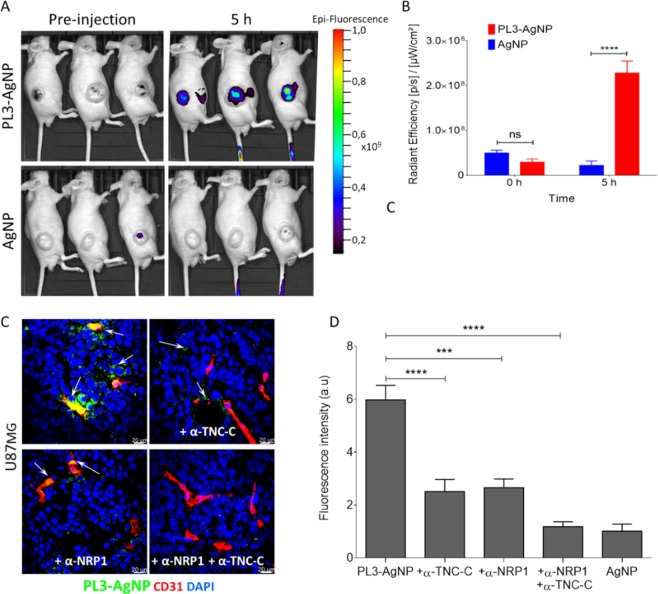
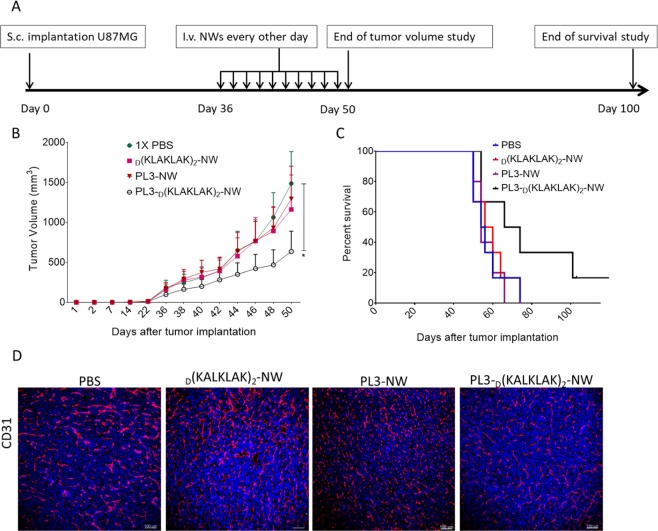
Extracellular matrix in solid tumors has emerged as a specific, stable, and abundant target for affinity-guided delivery of anticancer drugs. Here we describe the homing peptide that interacts with the C-isoform of Tenascin-C (TNC-C) upregulated in malignant tissues. TNC-C binding PL3 peptide (amino acid sequence: AGRGRLVR) was identified by in vitro biopanning on recombinant TNC-C. Besides TNC-C, PL3 interacts via its C-end Rule (CendR) motif with cell-and tissue penetration receptor neuropilin-1 (NRP-1). Functionalization of iron oxide nanoworms (NWs) and metallic silver nanoparticles (AgNPs) with PL3 peptide increased tropism of systemic nanoparticles towards glioblastoma (GBM) and prostate carcinoma xenograft lesions in nude mice (eight and five-fold respectively). Treatment of glioma-bearing mice with proapoptotic PL3-guided NWs improved the survival of the mice, whereas treatment with untargeted particles had no effect. PL3-coated nanoparticles were found to accumulate in TNC-C and NRP-1-positive areas in clinical tumor samples, suggesting a translational relevance. The systemic tumor-targeting properties and binding of PL3-NPs to the clinical tumor sections, suggest that the PL3 peptide may have applications as a targeting moiety for the selective delivery of imaging and therapeutic agents to solid tumors.


Conflict of interest statement

The authors declare no competing interests.

Figures

Figure 1
Figure 1
Identification and cell-free binding of PL3 peptide. (A) Selection of CX7C T7 phage library on immobilized TNC-C resulted in ~1000-fold increase in phage binding in round 5. Binding is expressed fold heptaglycine (G7) control phage. (B) Structural requirements for binding of PL3 peptide to TNC-C and NRP-1. T7-displayed PL3 peptide AGRGRLVR was subjected to alanine scanning mutagenesis (alanine substitutions indicated by underlined bold). Phage binding to TNC-C and NRP-1 is expressed as percent binding of parental PL3 phage. Values represent mean ± standard deviation from 3 independent experiments. (C,D) Saturation curve for the binding of FAM-Cys-PL3 to TNC-C and NRP1. FAM-Cys-PL3 (0.66 µM) was incubated with different concentrations of proteins in the absence (total binding, open circles) or presence (nonspecific binding, filled circles) of 0.5 mM Biotin-Ahx-PL3. After a 24 h incubation at 25 °C, FA values were calculated according to FA = (I | | − G·I⊥)/ (I | | + 2·I⊥) and fitted globally. The data represents the mean ± the standard deviation of 3 independent experiments.
Figure 2
Figure 2
PL3-functionalized AgNPs are taken up in NRP-1-positive PPC1 cells. PL3-AgNPs, or control AgNP particles (37 µL of 100 O.D. stock solution) labeled with CF555 fluorophore were incubated with PPC1 prostate carcinoma, U87-MG glioma, or M21 melanoma cells for 1 h, washed, treated with an optional hexacyanoferrate/thiosulfate redox-based etching solution to dissolve extracellular particles, and processed for confocal imaging. (A) Confocal imaging of cells incubated with peptide-targeted vs. control AgNPs. Note robust uptake of PL3-AgNPs (red) in NRP-1-positive PPC1 and U87-MG (and not NRP-1 negative M21) cells (high-magnification images are on the right of PL1-AgNP images). Control particles did not bind to the cells independent of their NRP-1 expression status. Scale bar: 20 µm (main images), and 2 µm (insets). (B) Quantitation of binding and internalization of CF555-labeled particles using ImageJ for samples from (A) and at least 3 independent experiments were carried out for individual conditions. Error bars: mean ± SD (N = 6), P-values were determined using unpaired Student’s t-test (ns, P > 0.05; ***p ≤ 0.001; ****p < 0.0001).
Figure 3
Figure 3
Systemic PL3-NWs accumulate in solid tumors. PL3-NWs or control FAM-NWs were injected i.v. at 7.5 mg/kg into mice bearing s.c. U87-MG glioblastoma (A), orthotopic WT-GBM glioblastoma (B), or s.c. PC3 prostate carcinoma (C). Five h later, the animals were intracardially perfused with DMEM/BSA and the tumors and control organs were snap-frozen, sectioned, immunostained with rabbit anti-FAM (green) and rat anti-CD31 (red) antibodies, counterstained with DAPI (blue) and imaged by confocal microscopy. Arrows point to PL3-NWs in the CD31-positive vessels and arrowheads point to extravasated PL3-NWs in the tumor parenchyma. Insets: confocal images without DAPI channel. Bar charts: quantitation of homing of NWs by quantitative analysis of FAM fluorescence in tissue sections by Fiji ImageJ. Error bars: mean ± SEM (N = 3–6). Scale bars: 100 μm. P-values were calculated using unpaired Student’s t-test (ns p > 0.05; *p < 0.05; **p ≤ 0.01; ***p ≤ 0.001).
Figure 4
Figure 4
PL3-NWs in tumor localize at areas positive for TNC-C and NRP1 immunoreactivities. PL3-NWs (A–C, upper row), or control NWs (D–F, lower row) were i.v.-administered at 7.5 mg/kg into mice bearing s.c. U87-MG glioblastoma. Five h later, the animals were intracardially perfused with DMEM, and tissues were collected for ex vivo macroscopic imaging and fluorescence microscopy. (A,D) Ex vivo macroscopic Illumatool imaging of PL3 and control NWs in green channel. Tu: tumor; Br: brain, Ki: kidney; Spl: spleen; Li: liver; Lu: lung; He: heart. The images are representative of 3 independent experiments. (B,C,E,F) Confocal imaging of NWs, TNC-C, and NRP-1 in tumor cryosections. PL3-NWs colocalize with perivascular TNC-C and NRP1 (arrows), whereas FAM-NWs show only background accumulation. Tumor tissues were stained with rabbit anti-FAM (green), anti-TNC-C ScFv G11 (red), and rabbit anti-NRP1 (red) antibodies. Arrows point to colocalization of PL3-NW with TNC-C and NRP1. Scale bar, 100 µm. The images are representative of 3 independent experiments.
Figure 5
Figure 5
Systemic PL3-AgNPs home to U87-MG tumors. (A) In vivo imaging of U87-MG s.c. tumor-bearing mice injected with Alexa-647-labeled PL3-AgNPs (upper row), or with non-targeted AgNPs (lower row). The fluorescence imaging was performed using IVIS Lumina Imaging System at pre-injection and at 5 h post-injection. Three mice per group were i.v. injected with AgNPs; images after spectral un-mixing are shown. Note elevated tumor Alexa-647 signal in mice injected with PL3-AgNPs at 5 h post-injection. (B) Quantification of tumor Alexa-647AgNP fluorescence at pre-injection and at 5 h time points. The signal is expressed as Average Radiant Efficiency [p/s]/[µW/cm²]. Error bars: mean ± SEM (N = 3); P-values were determined using two-way ANOVA Fisher’s LSD test (ns, P > 0.05; ****P ≤ 0.0001). (C) The PL3-AgNP green signal was quantified from representative images using Fiji ImageJ. Error bars, mean ± SEM (N = 3 mice per group); scale bars: 20 μm; p-value was determined using Student unpaired t-test, two-tailed; ***p ≤ 0.001; ****p < 0.0001. (D) Effect of TNC-C and NRP-1 antibodies on tumor accumulation of PL3-AgNPs. PL3-AgNPs alone, or in combination with anti-TNC-C or anti-NRP1 antibodies, or a cocktail of both antibodies were i.v injected into mice bearing U87-MG xenograft tumors. Mice were perfused through the heart with PBS/DMEM 5 h after injection and organs were collected for cryosectioning and confocal microscopy. Colors: PL3-AgNPs (green), CD31-positive blood vessels (red) and DAPI (blue).control, we confirmed that preincubation of the antibody with recombinant TNC-C resulted in reduced staining (Fig. S10).
Figure 6
Figure 6
Experimental therapy with PL3-D(KLAKLAK)2-NWs suppresses glioblastoma growth. (A) Experimental design of the tumor treatment study. Treatment of mice bearing s.c. U87-MG tumors with systemic injections of NWs were initiated on day 36 when the tumors had reached 100 mm3 volume; groups of 6 randomized mice were treated every other day for 10 injections. The body weight, survival, behavior, and tumor volume were monitored every two days until the end of the treatment. (B) Tumor size dynamics of mice treated with 5 mg/kg of D(KLAKLAK)2-NW, PL3-NW and PL3-D(KLAKLAK)2-NW, or control PBS (N = 6 mice/group). The tumor volume was measured with a digital caliper and calculated using the formula: Volume (V) (mm3) = [length × (width × 2)]/2. Data were analyzed with 2-way ANOVA and log-rank test. Error bars: mean ± SEM; *P < 0.05. (C) Kaplan-Meier survival analysis. At the endpoint of the study the mice were sacrificed by perfusion, and organs and tumors were collected. Tumor volume, Kaplan–Meier survival curve and body weight curve were calculated for each group using the GraphPad Prism 6 software with p values <0.05 considered significant. (D) Treatment with PL3-D(KLAKLAK)2-NWs resulted in decreased tumor vascularization. Cryosections of tumors were stained with vascular endothelial marker CD31 to visualize tumor blood vessels using confocal microscopy. Red: blood vessels stained by the anti-CD31 antibody; blue: nuclei stained with DAPI. The images are representative of 3 independent tumors.

References

    1. Pickup MW, Mouw JK, Weaver VM. The extracellular matrix modulates the hallmarks of cancer. EMBO Rep. 2014;15:1243–1253. doi: 10.15252/embr.201439246. - DOI - PMC - PubMed
    1. Lu P, Weaver VM, Werb Z. The extracellular matrix: A dynamic niche in cancer progression. J. Cell Biol. 2012;196:395–406. doi: 10.1083/jcb.201102147. - DOI - PMC - PubMed
    1. Venning FA, Wullkopf L, Erler JT. Targeting ECM Disrupts Cancer Progression. Front. Oncol. 2015;5:224. doi: 10.3389/fonc.2015.00224. - DOI - PMC - PubMed
    1. Spenlé C, et al. Tenascin-C: Exploitation and collateral damage in cancer management. Cell Adh. Migr. 2015;9:141–53. doi: 10.1080/19336918.2014.1000074. - DOI - PMC - PubMed
    1. Silacci M, et al. Human monoclonal antibodies to domain C of tenascin-C selectively target solid tumors in vivo. Protein Eng. Des. Sel. 2006;19:471–478. doi: 10.1093/protein/gzl033. - DOI - PubMed

Publication types

MeSH terms