Comparative Study
. 2020 Apr 2;3(1):153.
doi: 10.1038/s42003-020-0884-6.

DNA copy number motifs are strong and independent predictors of survival in breast cancer

Collaborators, Affiliations
Comparative Study

DNA copy number motifs are strong and independent predictors of survival in breast cancer

Arne V Pladsen et al. Commun Biol. .

Abstract

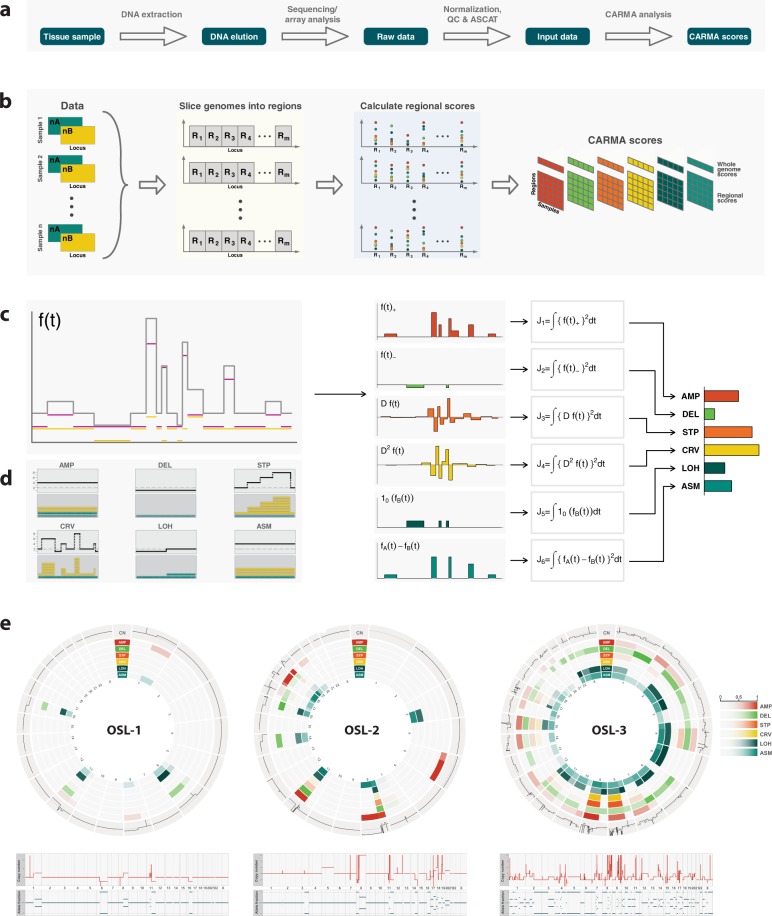
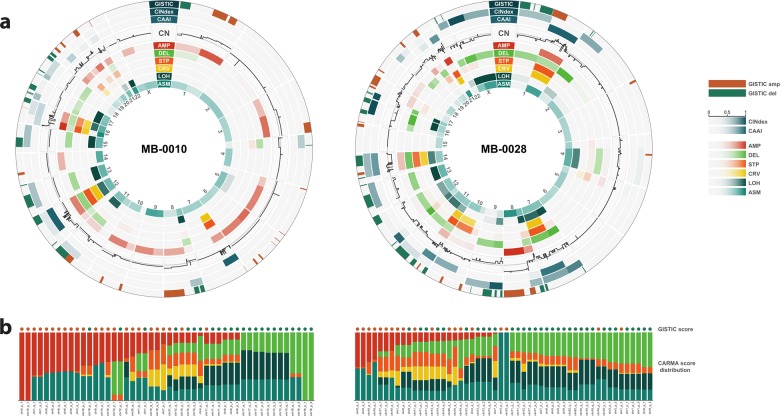
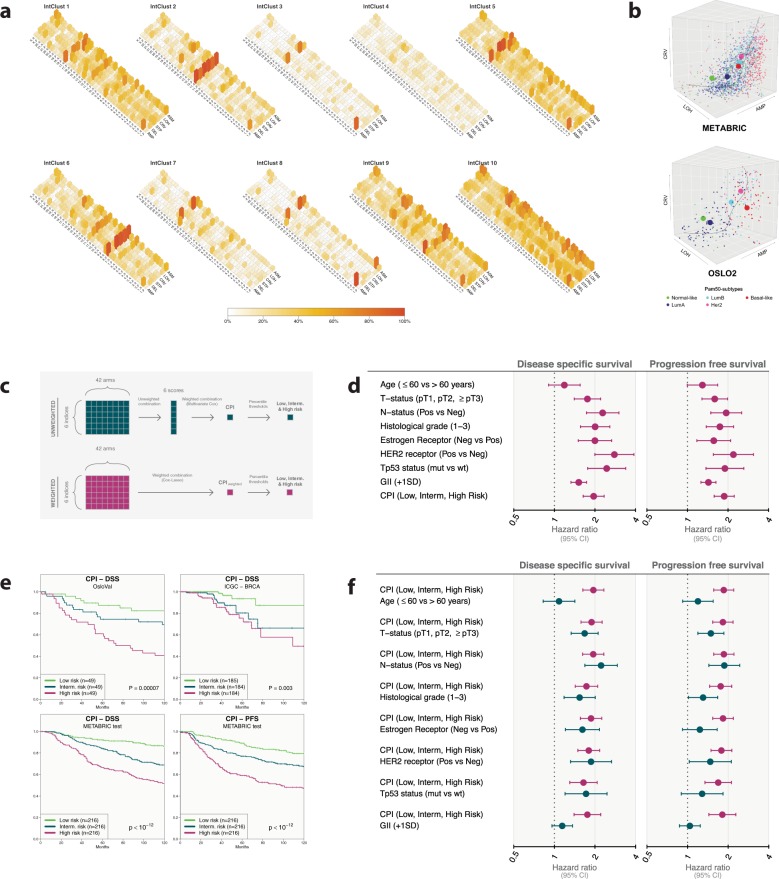
Somatic copy number alterations are a frequent sign of genome instability in cancer. A precise characterization of the genome architecture would reveal underlying instability mechanisms and provide an instrument for outcome prediction and treatment guidance. Here we show that the local spatial behavior of copy number profiles conveys important information about this architecture. Six filters were defined to characterize regional traits in copy number profiles, and the resulting Copy Aberration Regional Mapping Analysis (CARMA) algorithm was applied to tumors in four breast cancer cohorts (n = 2919). The derived motifs represent a layer of information that complements established molecular classifications of breast cancer. A score reflecting presence or absence of motifs provided a highly significant independent prognostic predictor. Results were consistent between cohorts. The nonsite-specific occurrence of the detected patterns suggests that CARMA captures underlying replication and repair defects and could have a future potential in treatment stratification.


Conflict of interest statement

The authors declare that they have no competing interests.

Figures

Fig. 1
Fig. 1. Outline of the CARMA algorithm.
a Complete analysis pipeline. b Steps included in the CARMA analysis. The input is one or more allele-specific copy number profiles. The algorithm extracts local features and accumulates these across genomic regions to form six regional scores. c Calculation of CARMA scores within a specified region. d Prototype patterns captured by each of the six CARMA scores. e An application of the algorithm to three breast tumor samples in the Oslo2 cohort. Lower panel: total copy number and allele fraction as a function of genomic locus. Upper panel: circos plots of regional (arm-wise) CARMA scores.
Fig. 2
Fig. 2. Relation to other methods.
a Circos plots of arm-wise CARMA scores for two selected samples in the METABRIC cohort, together with results from GISTIC, CINdex, and CAAI. Only focal aberrations are shown for GISTIC, and scores indicate whether a significant region according to GISTIC is aberrant in this sample. The color indicates the direction of change (loss or gain). For CINdex and CAAI, continuous scores are shown. b Relative distribution of CARMA scores within GISTIC regions. Each bar corresponds to a region which is found to be significant across all METABRIC samples according to GISTIC, and which is called as a gain or loss in the given sample. The colors in each bar represents the relative contributions of the six CARMA scores in that region, found by dividing the CARMA scores in a region by their sum. Regions are ordered according to decreasing contribution of AMP and then on increasing contribution of DEL.
Fig. 3
Fig. 3. Stratification and outcome prediction with CARMA.
a CARMA score distribution in METABRIC within the IntClust subtypes defined in Curtis et al.. The height of each bar represents the proportion of samples in the subgroup with arm score above the median, calculated across all arms within each CARMA score and ignoring zeros. b Three-dimensional scatter plots of tumors using three of the CARMA scores designed to detect three major categories of copy number aberration patterns in tumors (amplifications AMP, allelic loss LOH, complex rearrangements CRV). Colors indicate PAM50 subtype (see legend at bottom) and large spheres show subtype centroids. Upper panel: Oslo2 (n = 276); Lower panel: METABRIC (n = 1943). c Flow chart depicting the construction of prognostic indices from the arm-wise CARMA scores, using the METABRIC discovery cohort. Upper panel: construction of CPI. Arm-wise scores are collapsed using an unweighted average, and the resulting genome-wide scores are combined by multivariate Cox regression. Thresholds corresponding to the 1/3 and 2/3 percentiles were applied to classify samples into groups of low, intermediate and high risk. Lower panel: construction of CPIweighted. Arm-wise scores are combined by cross-validated multivariate Cox-Lasso regression, resulting in one genome-wide score. Thresholds corresponding to the 1/3 and 2/3 percentiles were applied as above to classify samples into three risk groups. d Hazard ratios and 95% confidence intervals (CI) for clinical variables, CPI scores, and the genomic instability index (GII). Shown are unadjusted estimates for disease-specific survival (DSS) and progression-free survival (PFS). e Survival prediction using CPI stratified into low, intermediate, and high risk. Kaplan–Meier plots of DSS for the three risk groups in the METABRIC test set, OsloVal set, and ICGC set as well as for PFS within the METABRIC test set. f Hazard ratios and 95% CI for clinical variables, CPI, and GII. Shown are adjusted estimates for DSS and PFS.

References

    1. Curtis C, et al. The genomic and transcriptomic architecture of 2,000 breast tumours reveals novel subgroups. Nature. 2012;486:346–352. doi: 10.1038/nature10983. - DOI - PMC - PubMed
    1. Beroukhim R, et al. The landscape of somatic copy-number alteration across human cancers. Nature. 2010;463:899–905. doi: 10.1038/nature08822. - DOI - PMC - PubMed
    1. Yates LR, et al. Genomic evolution of breast cancer metastasis and relapse. Cancer Cell. 2017;32:169–184.e7. doi: 10.1016/j.ccell.2017.07.005. - DOI - PMC - PubMed
    1. Yi K, Ju YS. Patterns and mechanisms of structural variations in human cancer. Exp. Mol. Med. 2018;50:98. doi: 10.1038/s12276-018-0112-3. - DOI - PMC - PubMed
    1. McClintock B. The stability of broken ends of chromosomes in zea mays. Genetics. 1941;26:234–282. - PMC - PubMed

Publication types

Substances