. 2020 Apr 2;10(1):5829.
doi: 10.1038/s41598-020-62674-9.

Real-time Burn Classification using Ultrasound Imaging

Affiliations

Real-time Burn Classification using Ultrasound Imaging

Sangrock Lee et al. Sci Rep. .

Abstract

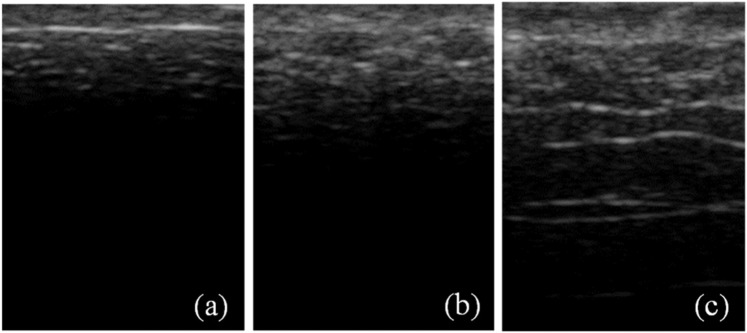
This article presents a real-time approach for classification of burn depth based on B-mode ultrasound imaging. A grey-level co-occurrence matrix (GLCM) computed from the ultrasound images of the tissue is employed to construct the textural feature set and the classification is performed using nonlinear support vector machine and kernel Fisher discriminant analysis. A leave-one-out cross-validation is used for the independent assessment of the classifiers. The model is tested for pair-wise binary classification of four burn conditions in ex vivo porcine skin tissue: (i) 200 °F for 10 s, (ii) 200 °F for 30 s, (iii) 450 °F for 10 s, and (iv) 450 °F for 30 s. The average classification accuracy for pairwise separation is 99% with just over 30 samples in each burn group and the average multiclass classification accuracy is 93%. The results highlight that the ultrasound imaging-based burn classification approach in conjunction with the GLCM texture features provide an accurate assessment of altered tissue characteristics with relatively moderate sample sizes, which is often the case with experimental and clinical datasets. The proposed method is shown to have the potential to assist with the real-time clinical assessment of burn degrees, particularly for discriminating between superficial and deep second degree burns, which is challenging in clinical practice.


Conflict of interest statement

The authors declare no competing interests.

Figures

Figure 1
Figure 1
The SVM-based classification approach described in two steps: (i) extraction of GLCM texture features from the ultrasound images, and (ii) independent assessment (LOOCV) of the SVM classifier.
Figure 2
Figure 2
Maximum average accuracies of six pair-wise burn classifications for the given number of GLCM features.
Figure 3
Figure 3
Supervised clustering of the burn groups using KFDA; s1, s2 and s3 are the discriminant analysis scores (Supplementary equation (S2.2)).
Figure 4
Figure 4
SVM score plots of the burn groups which are obtained from independent assessment of pairwise binary classification. The score on the y-axis is defined by Supplementary equation (S3.5) and the sign of the designated data determines the burn group to which the data belongs.
Figure 5
Figure 5
The ultrasound images of dimension 1.5 cm × 1.1 cm of porcine skin tissues showing a gradual increase in speckles with increasing burn severity starting from (a) unburned state to burn at 200 °F for (b) 10 s, (c) 30 s.
Figure 6
Figure 6
The ultrasound images of dimension 1.5 cm × 1.1 cm of porcine skin tissues showing a gradual increase in speckles with increasing burn severity starting from (a) unburned state to burn at 450 °F for (b) 10 s, (c) 30 s.
Figure 7
Figure 7
Histology of porcine skin for (a) unburned tissue and samples that are burned at (b) 200 °F for 10 s, (c) 200 °F for 30 s, (d) 450 °F for 10 s, (e) 450 °F for 30 s. For histology examination, a section punch biopsy is fixed in 10% formalin and embedded in paraffin, which is stained with haematoxylin and eosin (H&E) before examination under Olympus IX-71 microscope at 10× magnification.
Figure 8
Figure 8
Average GLCM of the ultrasound image of ex vivo porcine skin tissue for (a) unburned state and samples burned at 200 °F for (b) 10 s, and (c) 30 s. The x- and y-axis are the row and column numbers of the GLCM and the contour is in log scale.
Figure 9
Figure 9
Average GLCM of the ultrasound image of ex vivo porcine skin tissue for (a) unburned state and samples burned at 450 °F for (b) 10 s, and (c) 30 s. The x- and y-axis are the row and column numbers of the GLCM and the contour is in log scale.
Figure 10
Figure 10
Mean values of normalized GLCM features of the burn groups (a) burned at 200 °F and (b) burned at 450 °F.

References

    1. Goans RE, Cantrell JH, Meyers FB. Ultrasonic pulse‐echo determination of thermal injury in deep dermal burns. Medical Physics. 1977;4:259–263. doi: 10.1118/1.594376. - DOI - PubMed
    1. Kalus A, Aindow J, Caulfield M. Application of ultrasound in assessing burn depth. The Lancet. 1979;313:188–189. doi: 10.1016/S0140-6736(79)90583-X. - DOI - PubMed
    1. Iraniha S, et al. Determination of Burn Depth With Noncontact Ultrasonography. The Journal of Burn Care & Rehabilitation. 2000;21:333–338. doi: 10.1097/00004630-200021040-00008. - DOI - PubMed
    1. Brink JA, et al. Quantitative Assessment of Burn Injury in Porcine Skin with High-Frequency Ultrasonic Imaging. Investigative Radiology. 1986;21:645–651. doi: 10.1097/00004424-198608000-00008. - DOI - PubMed
    1. Ye H, De S. Thermal injury of skin and subcutaneous tissues: A review of experimental approaches and numerical models. Burns. 2017;43:909–932. doi: 10.1016/j.burns.2016.11.014. - DOI - PMC - PubMed

Publication types