School Opening Delay Effect on Transmission Dynamics of Coronavirus Disease 2019 in Korea: Based on Mathematical Modeling and Simulation Study
- PMID: 32242349
- PMCID: PMC7131906
- DOI: 10.3346/jkms.2020.35.e143
School Opening Delay Effect on Transmission Dynamics of Coronavirus Disease 2019 in Korea: Based on Mathematical Modeling and Simulation Study
Abstract
Background: Nonpharmaceutical intervention strategy is significantly important to mitigate the coronavirus disease 2019 (COVID-19) spread. One of the interventions implemented by the government is a school closure. The Ministry of Education decided to postpone the school opening from March 2 to April 6 to minimize epidemic size. We aimed to quantify the school closure effect on the COVID-19 epidemic.
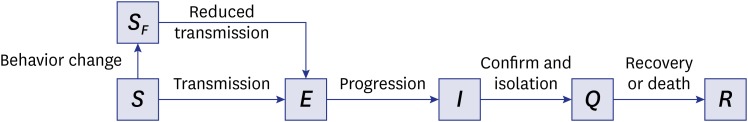
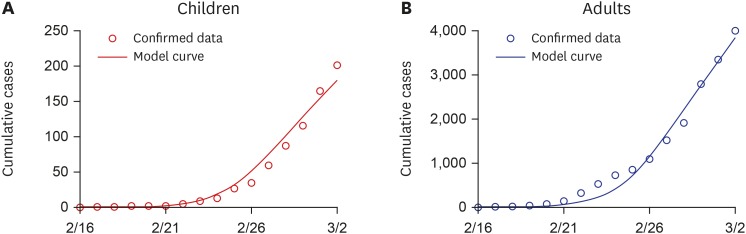
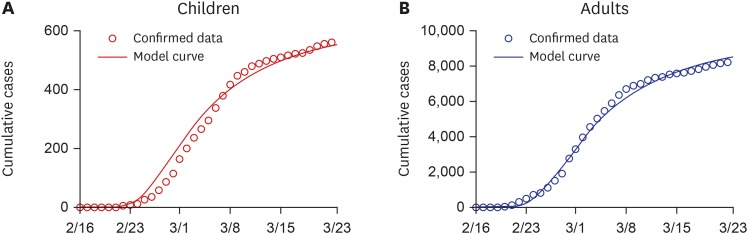
Methods: The potential effects of school opening were measured using a mathematical model considering two age groups: children (aged 19 years and younger) and adults (aged over 19). Based on susceptible-exposed-infectious-recovered model, isolation and behavior-changed susceptible individuals are additionally considered. The transmission parameters were estimated from the laboratory confirmed data reported by the Korea Centers for Disease Control and Prevention from February 16 to March 22. The model was extended with estimated parameters and estimated the expected number of confirmed cases as the transmission rate increased after school opening.
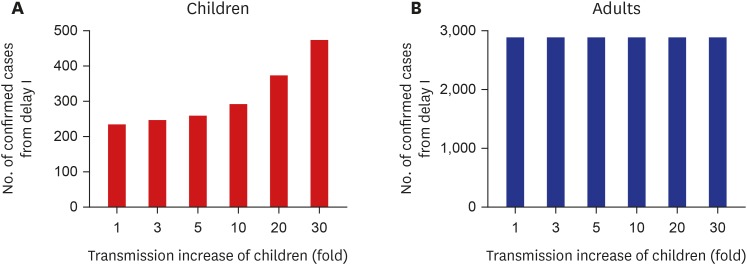
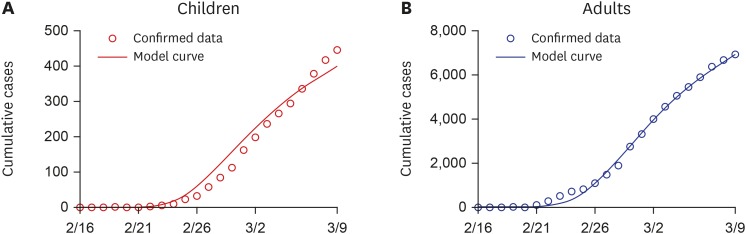
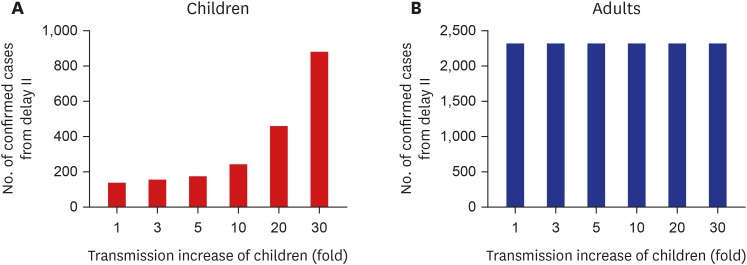
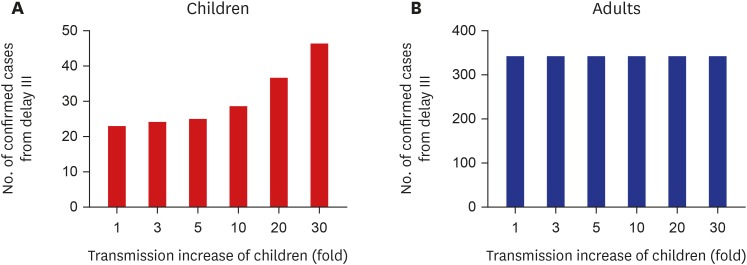
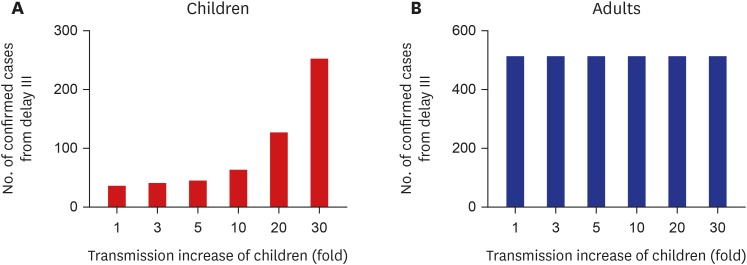
Results: Assuming the transmission rate between children group would be increasing 10 fold after the schools open, approximately additional 60 cases are expected to occur from March 2 to March 9, and approximately additional 100 children cases are expected from March 9 to March 23. After March 23, the number of expected cases for children is 28.4 for 7 days and 33.6 for 14 days.
Conclusion: The simulation results show that the government could reduce at least 200 cases, with two announcements by the Ministry of education. After March 23, although the possibility of massive transmission in the children's age group is lower, group transmission is possible to occur.
Keywords: Behavior Changes; COVID-19; Mathematical Modeling; School Closures; School Opening Delay.
© 2020 The Korean Academy of Medical Sciences.
Conflict of interest statement
The authors have no potential conflicts of interest to disclose.
Figures
References
-
- Korean Society of Infectious DiseasesKorean Society of Pediatric Infectious DiseasesKorean Society of EpidemiologyKorean Society for Antimicrobial TherapyKorean Society for Healthcare-associated Infection Control and PreventionKorea Centers for Disease Control and Prevention. Report on the Epidemiological features of coronavirus disease 2019 (COVID-19) outbreak in the Republic of Korea from January 19 to March 2, 2020. J Korean Med Sci. 2020;35(10):e112. - PMC - PubMed
-
- KCDC Press. Daily Cumulative Confirmed Data. Cheongju: Korea Centers for Disease Control and Prevention; 2020.
-
- Statistics Korea. Resident Registration Population by Administrative District and Age: Korean, Author's Translation. Daejeon: Statistics Korea; 2020.
-
- Towers S, Feng Z. Pandemic H1N1 influenza: predicting the course of a pandemic and assessing the efficacy of the planned vaccination programme in the United States. Euro Surveill. 2009;14(41):19358. - PubMed
-
- Kim S, Lee J, Jung E. Mathematical model of transmission dynamics and optimal control strategies for 2009 A/H1N1 influenza in the Republic of Korea. J Theor Biol. 2017;412:74–85. - PubMed
MeSH terms
Grants and funding
LinkOut - more resources
Full Text Sources
Miscellaneous