

Cryptosporidium infection among people living with HIV/AIDS in Ethiopia: a systematic review and meta-analysis
- PMID: 32242508
- PMCID: PMC7448945
- DOI: 10.1080/20477724.2020.1746888
Cryptosporidium infection among people living with HIV/AIDS in Ethiopia: a systematic review and meta-analysis
Abstract
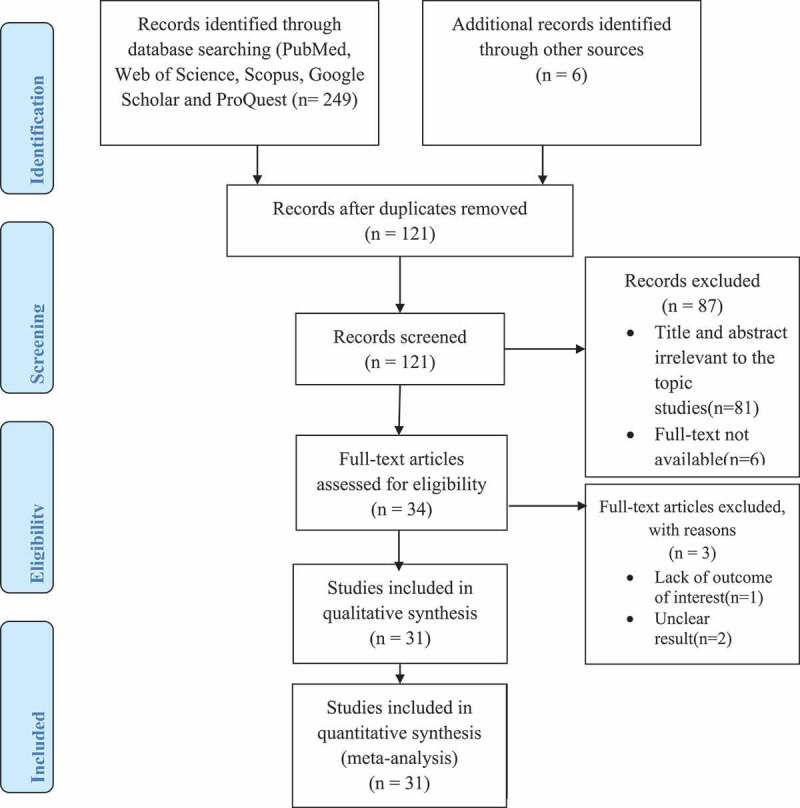
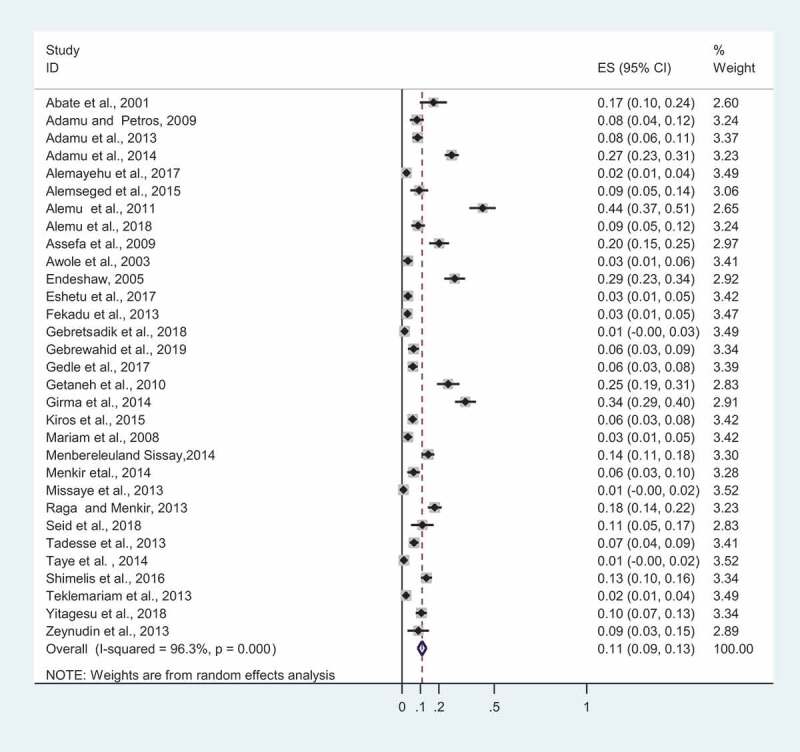
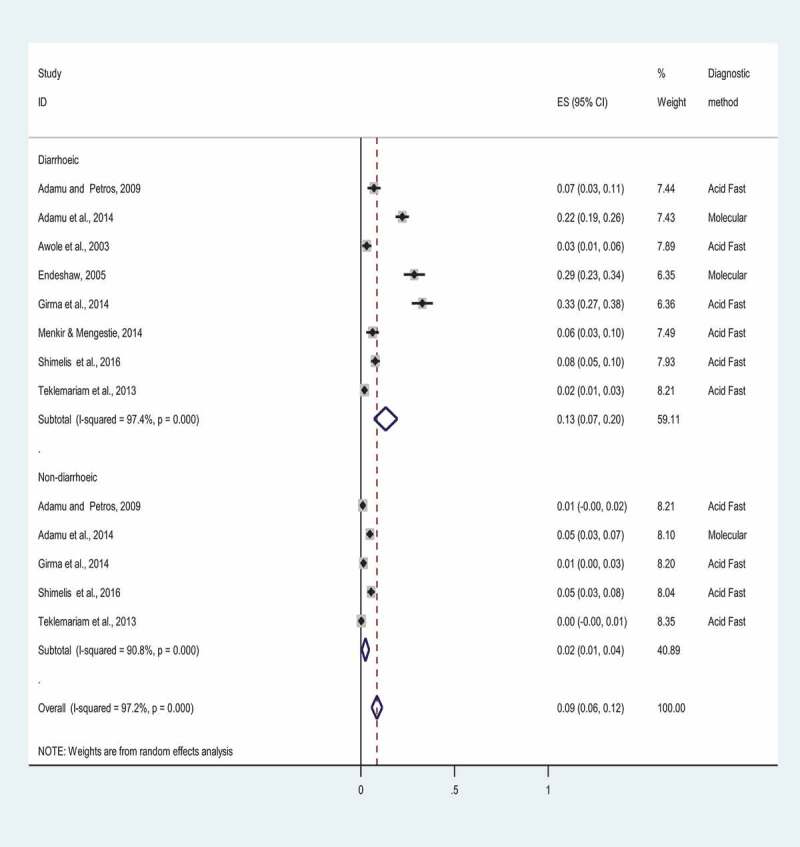
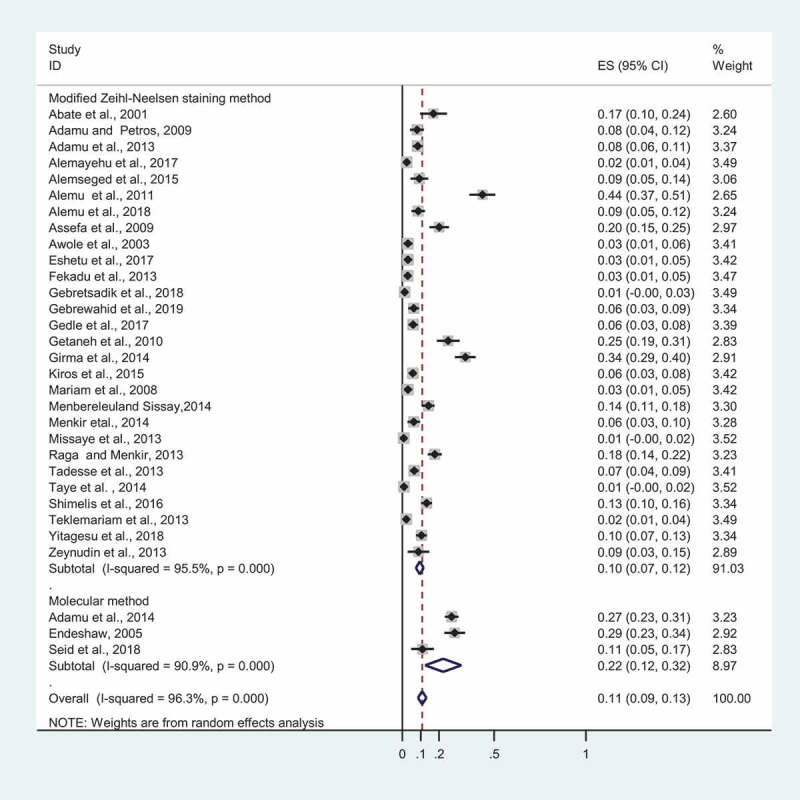
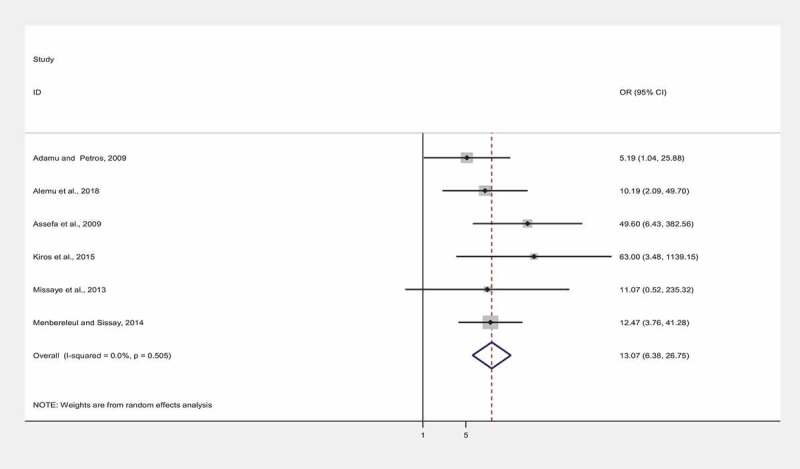
Studies on the prevalence of Cryptosporidium infection in People Living with HIV/AIDS (PLWHA) are inconsistent and heterogeneous. Therefore, this systematic review with meta-analysis was performed to assess the burden of the infection relative to the proportion of CD4 + T cell count among PLWHA in Ethiopia. Articles published before 15 May 2019, have been retrieved for this systematic review using five databases; PubMed, Scopus, Web of Science, Google Scholar and ProQuest, supplemented by the search for gray literature. The overall pooled prevalence and pooled Odds Ratio (OR) with their 95% Confidence Intervals (CI) were estimated using STATA 14 statistical Software. Of the 255 studies retrieved, 31 were considered for the final analysis. As many as 8,645 Ethiopians infected with HIV were included in the final quantitative synthesis. The overall pooled prevalence estimate of Cryptosporidium infection among PLWHA in Ethiopia was 11% (95%CI: 0.09-0.13). HIV-infected people with low CD4 + T cell count (CD4 < 200 cells/mm3) were 13.07 times more likely to become infected with Cryptosporidium than those with high CD4 + T cell count (CD4 > 500 cells/mm3) (OR: 13.07 (95%CI: 6.38-26.75). Cryptosporidium infection in PLWHA in Ethiopia showed decreasing patterns in 2001-2010, 2011-2014, and in 2015-2019, 14.6% (95%CI: 0.076-0.217), 12.71% (95%CI: 0.086-0.167) and 6.7% (95%CI: 0.044-0.090), respectively (p < 0.001). Though the pattern of Cryptosporidium infection in HIV-infected Ethiopians showed a declining trend; it remains a considerable problem that requires improvement in routine screening for Cryptosporidium in HIV-infected people, particularly with poor or declining CD4 + T cell count.
Keywords: CD4+ T cell count; Cryptosporidium; Ethiopia; human Immunodeficiency virus; meta-analysis.
Conflict of interest statement
No potential conflict of interest was reported by the authors.
Figures
References
-
- Gupta S, Narang S, Nunavath V, et al. Chronic diarrhoea in HIV patients: prevalence of coccidian parasites. Indian J Med Microbiol. 2008;26(2):172. - PubMed
-
- Organization WH: Prevention and control of schistosomiasis and soil-transmitted helminthiasis: report of a WHO expert committee. 2002:https://apps.who.int/iris/handle/10665/42588. - PubMed
Publication types
MeSH terms
LinkOut - more resources
Full Text Sources
Medical
Research Materials