. 2020 Jul;41(10):2846-2861.
doi: 10.1002/hbm.24981. Epub 2020 Apr 3.

Global resting-state functional connectivity of neural oscillations in tinnitus with and without hearing loss

Affiliations

Global resting-state functional connectivity of neural oscillations in tinnitus with and without hearing loss

Carly Demopoulos et al. Hum Brain Mapp. 2020 Jul.

Abstract

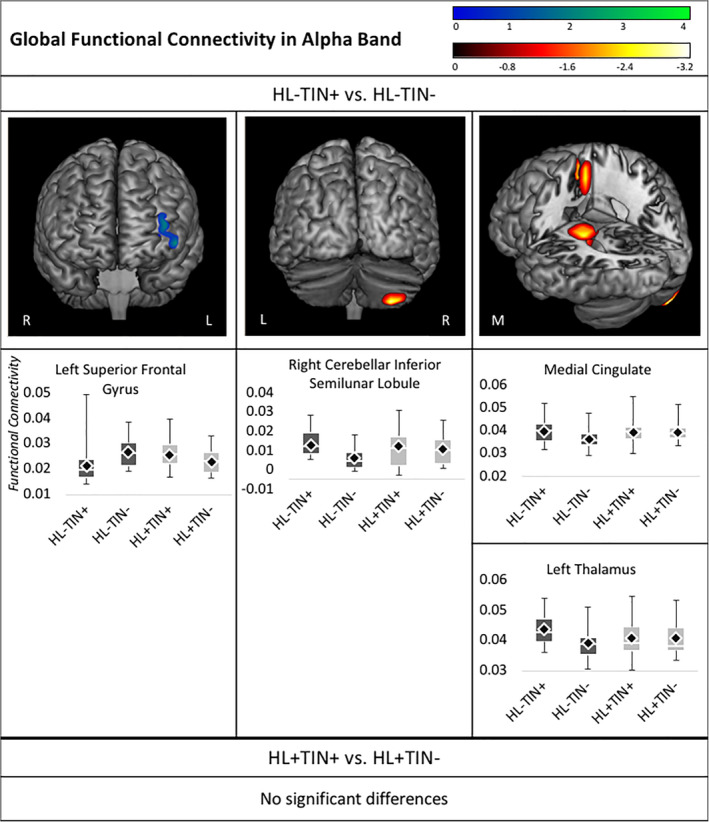
This study examined global resting-state functional connectivity of neural oscillations in individuals with chronic tinnitus and normal and impaired hearing. We tested the hypothesis that distinct neural oscillatory networks are engaged in tinnitus with and without hearing loss. In both tinnitus groups, with and without hearing loss, we identified multiple frequency band-dependent regions of increased and decreased global functional connectivity. We also found that the auditory domain of tinnitus severity, assayed by the Tinnitus Functional Index, was associated with global functional connectivity in both auditory and nonauditory regions. These findings provide candidate biomarkers to target and monitor treatments for tinnitus with and without hearing loss.

Keywords: biomarkers; electroencephalography; functional brain imaging; hearing loss; magnetoencephalography; tinnitus.


Conflict of interest statement

The authors declare no potential conflict of interest.

Figures

Figure 1
Figure 1
Whole brain global functional connectivity in the theta band. Images show regions of significant group differences following 5% FDR and 5‐voxel cluster correction. Boxplots below each image illustrate differences across all groups in the voxel with the maximum group differences within each cluster. Groups with normal hearing (HL−) are shaded in dark gray and hearing loss groups (HL+) are shaded in light gray. Global functional connectivity is quantified by the mean imaginary coherence values of each voxel and represented in the boxplots by the black diamond and the median is represented by the white line. FDR, false discovery rate
Figure 2
Figure 2
Whole brain contrasts in alpha connectivity. Images depict regions of significant group differences following 5% FDR and 5‐voxel cluster correction. Boxplots below each image illustrate differences across all groups in the voxel with the maximum group differences within each cluster. Groups with normal hearing (HL−) are shaded in dark gray and hearing loss groups (HL+) are shaded in light gray. Mean imaginary coherence values are represented in the boxplots by the black diamond, and the median is represented by the white line. FDR, false discovery rate
Figure 3
Figure 3
Whole brain contrasts in beta connectivity. Images depict regions of significant group differences following 5% FDR and 5‐voxel cluster correction. Boxplots below each image illustrate differences across all groups in the voxel with the maximum group differences within each cluster. Groups with normal hearing (HL−) are shaded in dark gray and hearing loss groups (HL+) are shaded in light gray. Mean imaginary coherence values are represented in the boxplots by the black diamond and the median is represented by the white line. FDR, false discovery rate
Figure 4
Figure 4
Whole brain contrasts in low gamma connectivity. Images depict regions of significant group differences following 5% FDR and 5‐voxel cluster correction. Boxplots below each image illustrate differences across all groups in the voxel with the maximum group differences within each cluster. Groups with normal hearing (HL−) are shaded in dark gray and hearing loss groups (HL+) are shaded in light gray. Mean imaginary coherence values are represented in the boxplots by the black diamond and the median is represented by the white line. FDR, false discovery rate
Figure 5
Figure 5
Whole brain correlations between tinnitus symptoms and theta connectivity. Images depict regions of significant group differences following 5% FDR and 5‐voxel cluster correction. Scatterplots below each image illustrate associations for the voxel with the maximum group correlation within each cluster. FDR, false discovery rate
Figure 6
Figure 6
Whole brain correlations between tinnitus symptoms and alpha connectivity. Images depict regions of significant group differences following 5% FDR and 5‐voxel cluster correction. Scatterplots below each image illustrate associations for the voxel with the maximum group correlation within each cluster. FDR, false discovery rate
Figure 7
Figure 7
Whole brain correlations between tinnitus symptoms and beta connectivity. Images depict regions of significant group differences following 5% FDR and 5‐voxel cluster correction. Scatterplots below each image illustrate associations for the voxel with the maximum group correlation within each cluster
Figure 8
Figure 8
Whole brain correlations between tinnitus symptoms and low gamma (30‐50 Hz) connectivity. Images depict regions of significant group differences following 5% FDR and 5‐voxel cluster correction. Scatterplots below each image illustrate associations for the voxel with the maximum group correlation within each cluster

Similar articles

Cited by

References

    1. Acoustical Society of America (ANSI) . (2004). American National Standards on acoustics. Melville, NY: Author.
    1. Adamchic, I. , Hauptmann, C. , & Tass, P. A. (2012). Changes of oscillatory activity in pitch processing network and related tinnitus relief induced by acoustic CR neuromodulation. Frontiers in Systems Neuroscience, 6, 1–11. 10.3389/fnsys.2012.00018 - DOI - PMC - PubMed
    1. Adamchic, I. , Toth, T. , Hauptmann, C. , Walger, M. , Langguth, B. , Klingmann, I. , & Tass, P. A. (2017). Acute effects and after‐effects of acoustic coordinated reset neuromodulation in patients with chronic subjective tinnitus. NeuroImage: Clinical, 15, 541–558. 10.1016/j.nicl.2017.05.017 - DOI - PMC - PubMed
    1. Adjamian, P. (2014). The application of electro‐ and magneto‐encephalography in tinnitus research‐methods and interpretations. Frontiers in Neurology, 5, 1–24. 10.3389/fneur.2014.00228 - DOI - PMC - PubMed
    1. Benjamini, Y. & Hochberg, Y. (1995). Controlling the false discovery rate: A practical and powerful approach to multiple testing. Journal of the Royal Statistical Society, 57, 289–300.

Publication types

MeSH terms