. 2020 Apr 3;17(4):e1003082.
doi: 10.1371/journal.pmed.1003082. eCollection 2020 Apr.

CINeMA: An approach for assessing confidence in the results of a network meta-analysis

Affiliations

CINeMA: An approach for assessing confidence in the results of a network meta-analysis

Adriani Nikolakopoulou et al. PLoS Med. .

Abstract

Background: The evaluation of the credibility of results from a meta-analysis has become an important part of the evidence synthesis process. We present a methodological framework to evaluate confidence in the results from network meta-analyses, Confidence in Network Meta-Analysis (CINeMA), when multiple interventions are compared.

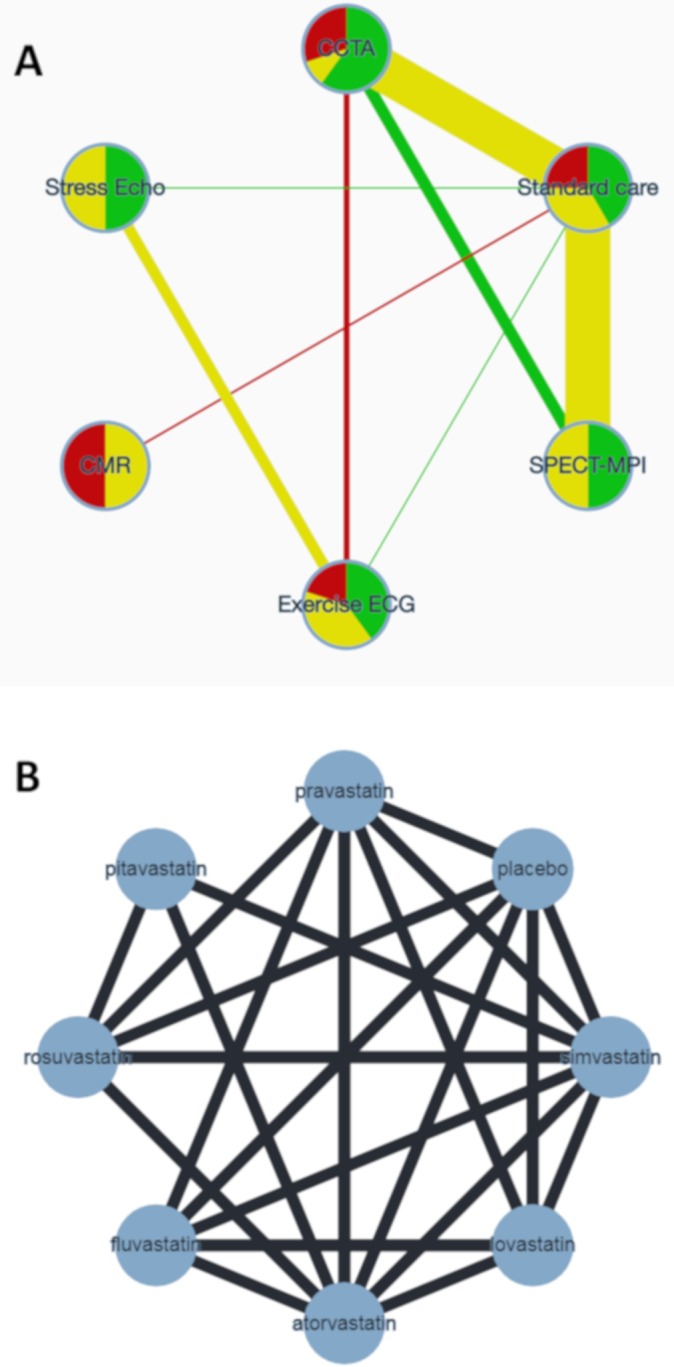
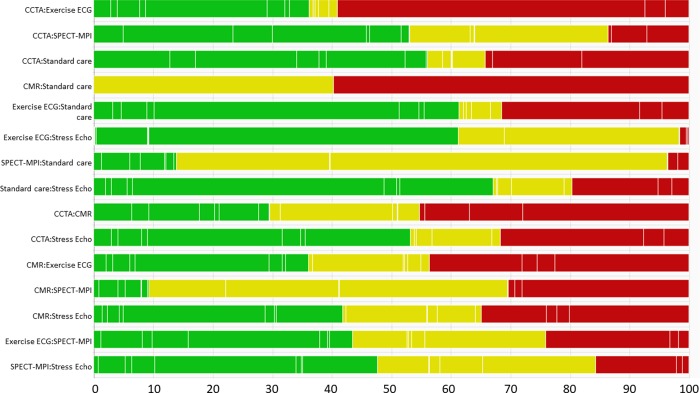
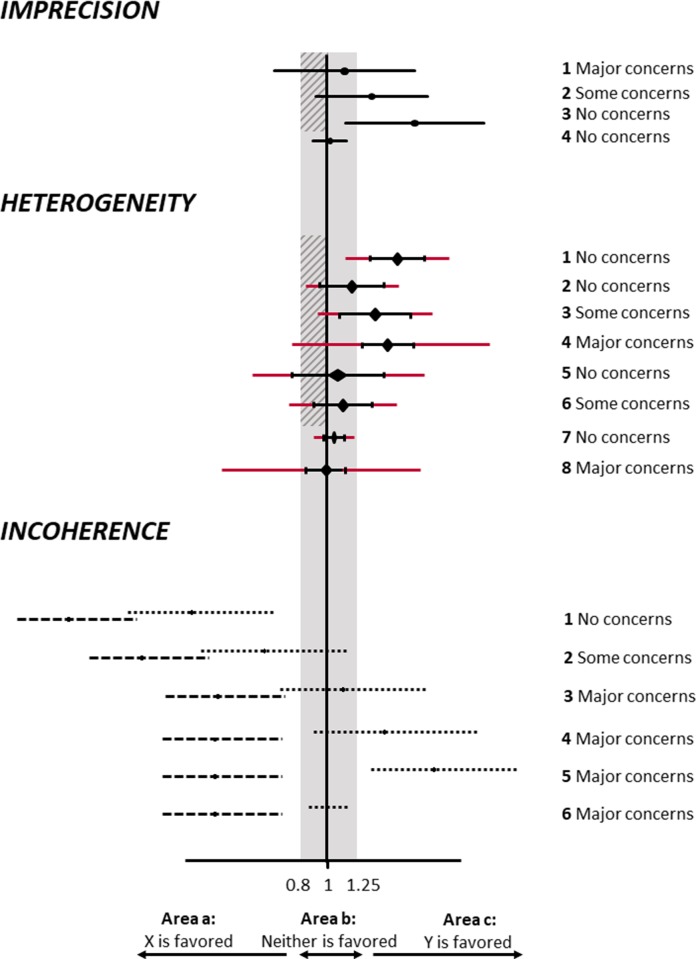
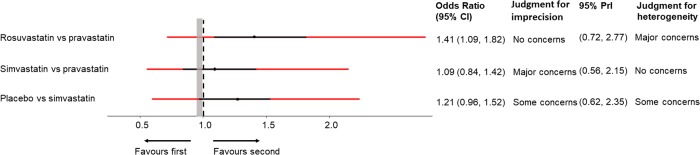
Methodology: CINeMA considers 6 domains: (i) within-study bias, (ii) reporting bias, (iii) indirectness, (iv) imprecision, (v) heterogeneity, and (vi) incoherence. Key to judgments about within-study bias and indirectness is the percentage contribution matrix, which shows how much information each study contributes to the results from network meta-analysis. The contribution matrix can easily be computed using a freely available web application. In evaluating imprecision, heterogeneity, and incoherence, we consider the impact of these components of variability in forming clinical decisions.

Conclusions: Via 3 examples, we show that CINeMA improves transparency and avoids the selective use of evidence when forming judgments, thus limiting subjectivity in the process. CINeMA is easy to apply even in large and complicated networks.


Conflict of interest statement

I have read the journal's policy and the authors of this manuscript have the following competing interests: ME is a member of the Editorial Board of PLOS Medicine.

Figures

Fig 1
Fig 1. Network plots of 2 network meta-analyses.
(A) Network of randomised controlled trials comparing non-invasive diagnostic strategies for the detection of coronary artery disease in patients presenting with symptoms suggestive of acute coronary syndrome. The width of the edges is proportional to the number of patients randomised in each comparison. The colours of edges and nodes refer to the risk of bias: low (green), moderate (yellow), and high (red). (B) Network of randomised controlled trials comparing statins with respect to adverse effects. CCTA, coronary computed tomography angiography; CMR, cardiovascular magnetic resonance; ECG, electrocardiogram; echo, echocardiography; SPECT-MPI, single photon emission computed tomography–myocardial perfusion imaging.
Fig 2
Fig 2. Risk of bias bar chart for the comparison of non-invasive diagnostic strategies for the detection of coronary artery disease.
Each bar represents a relative treatment effect estimated from the network shown in Fig 1A. White vertical lines separate the percentage contribution of different studies. Each bar shows the percentage contribution from studies judged to be at low (green), moderate (yellow), and high (red) risk of bias.
Fig 3
Fig 3. CINeMA rules to assess imprecision, heterogeneity, and incoherence of network treatment effects.
Black lines show confidence intervals, and red lines prediction intervals. The shaded grey area represents values that favour neither of the competing interventions: the range of equivalence, from 0.8 to 1.25. The hatched area shows the interval between the no effect line and a clinically important effect in the opposite direction to the observed effect. For incoherence, dashed lines represent direct effects, and dotted lines indirect effects.
Fig 4
Fig 4. Odds ratios for treatment discontinuation due to adverse effects from the network of statins with their 95% CIs and their 95% PrIs.
Black lines represent 95% CIs, and red lines represent 95% PrIs. The range of equivalence is from 0.95 to 1.05. CI, confidence interval; PrI, prediction interval; vs, versus.

References

    1. Zarin W, Veroniki AA, Nincic V, Vafaei A, Reynen E, Motiwala SS, et al. Characteristics and knowledge synthesis approach for 456 network meta-analyses: a scoping review. BMC Med. 2017;15:3 10.1186/s12916-016-0764-6 - DOI - PMC - PubMed
    1. Guyatt GH, Oxman AD, Vist GE, Kunz R, Falck-Ytter Y, Alonso-Coello P, et al. GRADE: an emerging consensus on rating quality of evidence and strength of recommendations. BMJ. 2008;336:924–6. 10.1136/bmj.39489.470347.AD - DOI - PMC - PubMed
    1. Guyatt G, Oxman AD, Akl EA, Kunz R, Vist G, Brozek J, et al. GRADE guidelines: 1. Introduction—GRADE evidence profiles and summary of findings tables. J Clin Epidemiol. 2011;64:383–94. 10.1016/j.jclinepi.2010.04.026 - DOI - PubMed
    1. Puhan MA, Schünemann HJ, Murad MH, Li T, Brignardello-Petersen R, Singh JA, et al. A GRADE Working Group approach for rating the quality of treatment effect estimates from network meta-analysis. BMJ. 2014;349:g5630 10.1136/bmj.g5630 - DOI - PubMed
    1. Salanti G, Del Giovane C, Chaimani A, Caldwell DM, Higgins JPT. Evaluating the quality of evidence from a network meta-analysis. PLoS ONE. 2014;9(7):e99682 10.1371/journal.pone.0099682 - DOI - PMC - PubMed

Publication types

MeSH terms