. 2020 May 4;152(5):e201912523.
doi: 10.1085/jgp.201912523.

Differentially poised vesicles underlie fast and slow components of release at single synapses

Affiliations

Differentially poised vesicles underlie fast and slow components of release at single synapses

Kris Blanchard et al. J Gen Physiol. .

Abstract

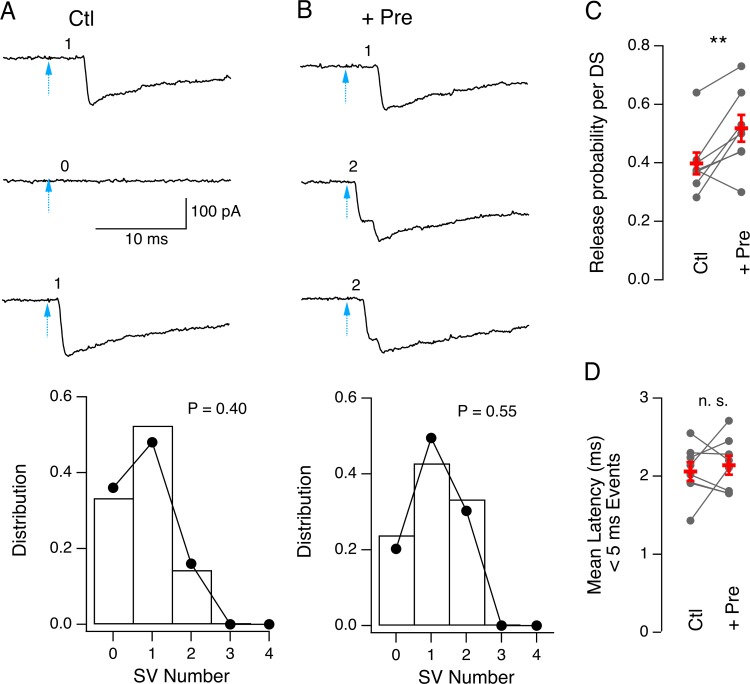
In several types of central mammalian synapses, sustained presynaptic stimulation leads to a sequence of two components of synaptic vesicle release, reflecting the consecutive contributions of a fast-releasing pool (FRP) and of a slow-releasing pool (SRP). Previous work has shown that following common depletion by a strong stimulation, FRP and SRP recover with different kinetics. However, it has remained unclear whether any manipulation could lead to a selective enhancement of either FRP or SRP. To address this question, we have performed local presynaptic calcium uncaging in single presynaptic varicosities of cerebellar interneurons. These varicosities typically form "simple synapses" onto postsynaptic interneurons, involving several (one to six) docking/release sites within a single active zone. We find that strong uncaging laser pulses elicit two phases of release with time constants of ∼1 ms (FRP release) and ∼20 ms (SRP release). When uncaging was preceded by action potential-evoked vesicular release, the extent of SRP release was specifically enhanced. We interpret this effect as reflecting an increased likelihood of two-step release (docking then release) following the elimination of docked synaptic vesicles by action potential-evoked release. In contrast, a subthreshold laser-evoked calcium elevation in the presynaptic varicosity resulted in an enhancement of the FRP release. We interpret this latter effect as reflecting an increased probability of occupancy of docking sites following subthreshold calcium increase. In conclusion, both fast and slow components of release can be specifically enhanced by certain presynaptic manipulations. Our results have implications for the mechanism of docking site replenishment and the regulation of synaptic responses, in particular following activation of ionotropic presynaptic receptors.


Figures

Figure S1.
Figure S1.
Simple synapse response to double laser stimulation with increasing intensities. Having established a simple synapse recording, two laser pulses were applied to the presynaptic varicosity, with 30-ms intervals between stimulations (arrows) and 1-min waiting times between pairs of stimulations. In conformity with previous observations (Trigo et al., 2012), when increasing the laser energy, initially only failures were obtained, and then multivesicular release responses were obtained with latencies that decreased as a function of laser intensity. Note that for laser intensities of 0.3 or 0.4 µJ, no response was recorded within 5 ms following the second laser stimulation (between black and gray vertical lines). Recording conditions for the second part of this work (Figs. 4 and 5) correspond to laser intensities of 0.3 or 0.4 µJ in this example; first latencies are then close to 2 ms. Recording conditions for the first part of this work (Figs. 1, 2, and 3) correspond to slightly larger laser intensities, with first latencies on the order of 1 ms.
Figure 1.
Figure 1.
Two-component response to local calcium uncaging at simple MLI–MLI synapses. (A) Left: Dual-color image of presynaptic (red) and postsynaptic (green) MLIs with synaptic contact (dotted rectangle). Right: Reconstruction of pre- and postsynaptic cells (thick lines, dendrites; thin red line, presynaptic axon) together with positioning of laser spot illumination. (B) Left: Responses to individual laser stimulations (duration, 100 µs; power, 0.1 µJ; interstimulus period, 1 min). Right: Blowup of first response with measured latencies. Each latency likely corresponds to the release of one SV in this recording. Note the smaller amplitude of the second event, due to partial saturation of postsynaptic receptors. Note also that in some of the traces on the left (e.g., third trace), the exact number of released SVs is ambiguous because several SVs appear to be released almost simultaneously. The blue arrow corresponds to the laser stimulation; gray arrows indicate the beginning of the postsynaptic responses. (C) Group results showing latency distribution (236 events from 12 pairs). The distribution is well fit with a double exponential (right; amplitude of slow component, 27%). A lag of 0.6 ms was introduced between the laser pulse and the single or double exponential fits to account for the minimal latency of release responses.
Figure 2.
Figure 2.
Selective enhancement of slow component with conditioning AP train. (A) Left: Fast response to laser stimulation following a train of five presynaptic APs without any synaptic response (Ctrl). Right: Following another five-AP train, a synaptic response is obtained (+Rel). The fast response is then reduced in amplitude and is followed by several release events with latencies >5 ms (slow response). (B) Average fast response amplitudes are reduced in six out of seven experiments following AP-induced synaptic responses compared with AP-induced failures, with an average amplitude reduction of 26%. (C) Cumulative latency distributions indicate a larger slow component following AP-induced synaptic responses (57%; blue) compared with trials where APs led to synaptic failures (21%; gray) or trials without conditioning AP (29%; brown, same data as in Fig. 1C; all fits were constrained to a common fast time constant value of 1.2 ms and a common slow time constant value of 28 ms, based on the blue data points). (D) Paired comparison shows larger average latencies for trials displaying synaptic responses compared with trials where APs led to failures (n = 7 experiments). (E) Paired comparison shows similar numbers of short release events (<5-ms latencies, left) and larger numbers of slow release events (>5-ms latencies, right) for trials displaying synaptic responses compared with trials where APs led to failures (n = 7 experiments). Gray points show averages in Ctrl and +Rel conditions in B, D, and E, while average values across experiments and associated ± SEM bars are in red. n.s., not significant *, P < 0.05, paired t test.
Figure 3.
Figure 3.
Conditioning AP train does not alter calcium response to subsequent laser stimulation. (A) Inset: Calcium imaging of presynaptic varicosity (0.5 mM OGB5 in recording pipette) before (left) and after (right) laser stimulation, without (top) or with (bottom) conditioning AP train. Main plot: Traces of OGB5 fluorescence signal in response to laser pulse (blue), without (black) or with (yellow) conditioning AP train (yellow trace). (B) Group results (n = 10; gray, individual cells; red, averages ± SEM) showing no effect of conditioning AP train on laser-evoked calcium transient peak amplitude (left) or time constant of decay (right; see exemplar exponential fits in A). n.s., not significant.
Figure 4.
Figure 4.
Potentiation of fast release component following subthreshold calcium uncaging. (A) Exemplar traces (presented in chronological sequence, from left to right and from top to bottom) showing responses to large test laser stimulations in either the absence (left, black traces) or the presence (right, yellow traces) of a series of five small-amplitude laser prepulses (bottom, blue traces). (B) Average traces without (black) and with (yellow) prepulses from the same experiment as in A. (C) Group results (gray, averages across trials for individual experiments; red, averages ± SEM across experiments) reveal a significant amplitude potentiation following prepulses (left) as well as a significant shortening of first latencies (right) when using prepulses (+Pre) compared with control (delay to test pulse, 100 or 200 ms). *, P < 0.05, paired t test. (D) Increasing the delay from 100–200 ms to 2 s abolishes the potentiation of the peak amplitude (left) as well as the shortening of the first latency (right). n.s., not significant (E) Exemplar calcium imaging traces from a single presynaptic varicosity in response to a test laser flash alone (black) or preceded by a train of five small-amplitude flashes (yellow), with superimposed exponential fits of test laser-induced response. (F) Group results showing no effect of preceding laser pulses on peak amplitude (left) or time constant of decay (right) of test flash response (n = 9 varicosities; gray, individual experiments; red, averages ± SEM).
Figure S2.
Figure S2.
Calcium response to conditioning laser pulses in a presynaptic terminal as measured with the high-affinity dye OGB1. In this experiment, a presynaptic terminal was dialyzed with the high-affinity dye OGB1 (100 µM). A series of five laser pulses with small amplitude preceded a test laser pulse with large amplitude (blue trace). As illustrated in this recording, the peak OGB1 signal following the fifth prepulse is approximately half the peak amplitude recorded in response to the test pulse (mean ratio ± SD between these two amplitudes, 0.5 ± 0.09; n = 3 experiments). As the peak amplitude in response to the test pulse presumably reflects the maximum response of the dye, while the basal calcium concentration is negligible, this indicates that the peak amplitude following the fifth prepulse is close to the Kd of the dye, namely 170 nM.
Figure 5.
Figure 5.
Enhancement of release probability following subthreshold calcium uncaging. (A) Top: Sample traces showing examples of failure (middle trace) and single SV responses (top and bottom traces) to test laser stimulation (arrows). Bottom: Experimental distribution of SV release numbers (bar graph) and superimposed fit with a binomial distribution (dots) assuming two independent docking sites. (B) Top: Intercalated trials including prepulses from the same experiment display more frequent examples of dual SV responses (second and third traces). Bottom: Binomial analysis of these data indicates an increase of the release probability per docking site from P = 0.40 in control to P = 0.55 with prepulses. (C) Group analysis from seven pairs showing a significant increase in P with prepulses. **, P < 0.01, paired t test. (D) Prepulses do not alter the means calculated for all latencies of the fast component (<5 ms). DS, docking site; n.s., not significant.
Figure 6.
Figure 6.
Interpreting changes in the proportion of fast and slow components of laser-induced responses. Schematic representation of an MLI active zone possessing three docking sites (DSs), two of which are occupied at rest, and three associated replacement sites (RSs), two of which are occupied at rest. Under control conditions, docked SVs give rise to fast release (F), whereas replacement SVs give rise to slow release (S), in a two-step process including docking then release (vertical arrows). Following AP-induced release, some docking sites are freed, so that the proportion of slow release is increased. By contrast, following prepulse-induced docking, the proportion of fast release is increased.

References

    1. Auger C., and Marty A.. 1997. Heterogeneity of functional synaptic parameters among single release sites. Neuron. 19:139–150. 10.1016/S0896-6273(00)80354-2 - DOI - PubMed
    1. Auger C., Kondo S., and Marty A.. 1998. Multivesicular release at single functional synaptic sites in cerebellar stellate and basket cells. J. Neurosci. 18:4532–4547. 10.1523/JNEUROSCI.18-12-04532.1998 - DOI - PMC - PubMed
    1. Awatramani G.B., Price G.D., and Trussell L.O.. 2005. Modulation of transmitter release by presynaptic resting potential and background calcium levels. Neuron. 48:109–121. 10.1016/j.neuron.2005.08.038 - DOI - PubMed
    1. Barrett E.F., and Stevens C.F.. 1972. The kinetics of transmitter release at the frog neuromuscular junction. J. Physiol. 227:691–708. 10.1113/jphysiol.1972.sp010054 - DOI - PMC - PubMed
    1. Bouhours B., Trigo F.F., and Marty A.. 2011. Somatic depolarization enhances GABA release in cerebellar interneurons via a calcium/protein kinase C pathway. J. Neurosci. 31:5804–5815. 10.1523/JNEUROSCI.5127-10.2011 - DOI - PMC - PubMed

Publication types