. 2020 Jun;9(11):3964-3973.
doi: 10.1002/cam4.3028. Epub 2020 Apr 3.

Lower tumorigenesis without life extension in rats receiving lifelong deep ocean minerals

Affiliations

Lower tumorigenesis without life extension in rats receiving lifelong deep ocean minerals

Suchada Saovieng et al. Cancer Med. 2020 Jun.

Abstract

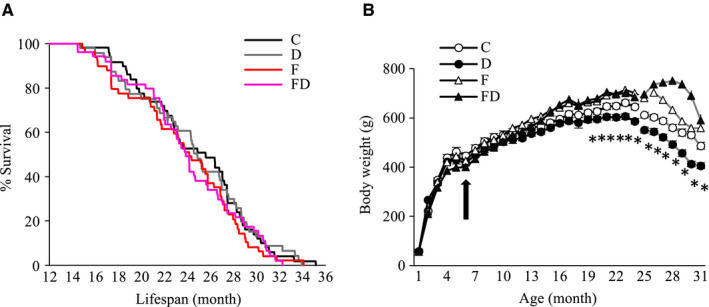
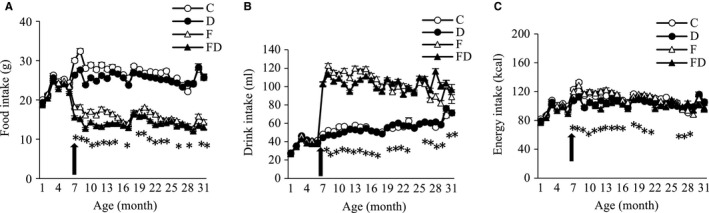
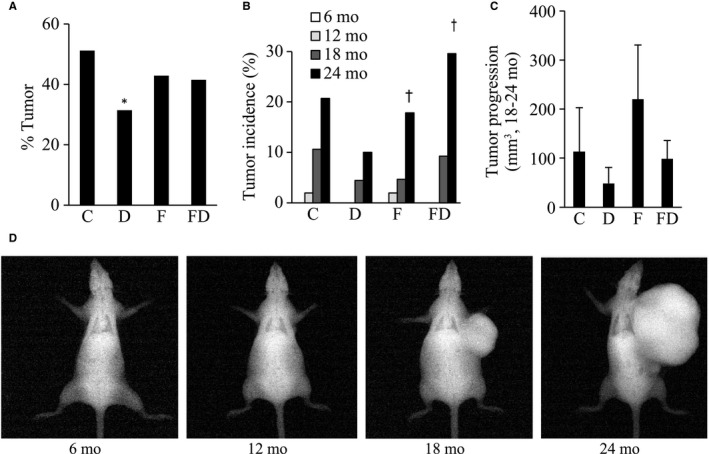
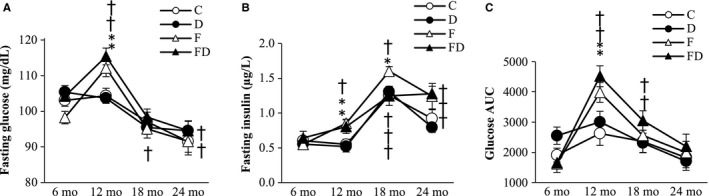
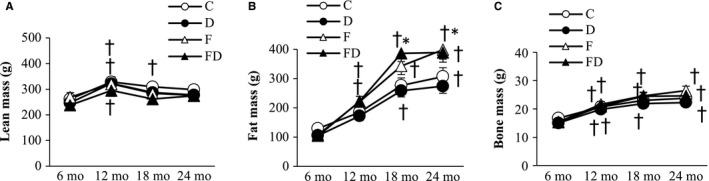
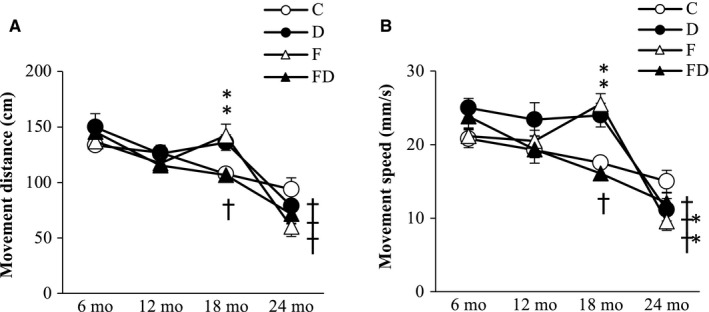
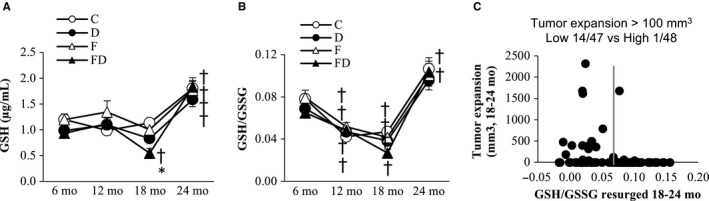
Naturally occurring tumor in animals receiving high minerals from deep oceans (DOM: hardness 600 mg/L) from 6 months of age until natural death was firstly assessed in 200 Sprague Dawley rats, randomized into four groups: Control (C), DOM (D), Fructose (F), and Fructose + DOM (FD). Fructose drink contained 11% fructose. Tumor incidence (necropsy at death) in the D group was ~40% lower than that in the C group (P < .05), together with lower body mass gain and greater locomotive activity during their initial 18 months (P < .05) but not during later life. X-ray image analysis on abnormal solid tissue among survivors at 18 and 24 months of age confirms a similar trend, exhibiting ~50% and ~65% lower tumor incidence than the C and F groups, respectively. Reduced-to-oxidized glutathione ratio (GSH/GSSG) declined with age for the first three quarters of life on all groups (P < .05), followed by a resurgence during end-life among survivors at 24 months. This resurgence is markedly associated with lower tumor expansion but unrelated with DOM supplementation. Our results demonstrate valuable application of minerals and trace elements from deep oceans, as a vastly available natural source, on tumor suppression during normal aging.

Keywords: cancer; fructose; glutathione; lifespan; tumor.


Conflict of interest statement

CHK were invited as a scientific consultant for Taiwan Yes Corporation during the research period. Travel expenses for international scientific presentations and open access fee were supported by Taiwan Yes Corporation.

Figures

FIGURE 1
FIGURE 1
Longevity and body mass. No significant difference in cumulative survival (A) of the rats (n = 194, average lifespan: ~24 mo) survived over 12 mo among 4 groups (C, n = 49; D, n = 48; F, n = 49; FD, n = 48). Trajectory lines represent evolution of mean body mass of survivors (n = 102) at 24 mo (B) (C, n = 26; D, n = 28; F, n = 25; FD, n = 23). Significant body mass loss was observed for all groups after 24 mo of age. The D group had the lowest body mass from 19 mo of age. *P < .05 compared with C, F, and FD groups. Abbreviation: C, Control; D, Deep ocean mineral water; F, Fructose; FD, Fructose + Deep ocean mineral water
FIGURE 2
FIGURE 2
Food and drink consumption. Fructose drinks reduced food consumption by nearly 50% (A) and substantially increased water consumption (B) from 6 mo of age. Total energy intake in the DOM‐treated groups was moderately lower than those in the non‐DOM groups from 6 to 12 mo of age (P < .05) (C). Trajectory lines represent mean values of each group (n = 102) survived at 24 mo (B) (C, n = 26; D, n = 28; F, n = 25; FD, n = 23). Abbreviation: C, Control; D, Deep ocean mineral water; F, Fructose; FD, Fructose + Deep ocean mineral water. The arrow in the figure represents the time when the experiment was started
FIGURE 3
FIGURE 3
Tumor incidence and tumor size expansion. Tumor incidence (necropsy) of the rats in the D group was ~40% less than that in the C group (A). Representative X‐ray tumor image of a rat (D), measured every 6 mo until 24 mo of age. Age‐dependent tumor incidence (X‐ray image) increased dramatically from 18 to 20 mo of age, in which fructose‐fed groups showed greater increases in tumor incidence than those non‐fructose‐fed groups (B). Tumor size expansion from 18 to 24 mo showed similar trend among four groups but no statistical significance is reached (C). Abbreviation: C, Control; D, Deep ocean mineral water; F, Fructose; FD, Fructose + Deep ocean mineral water. *P < .05 compared against the C group; P < .05 compared between 18 and 24 mo
FIGURE 4
FIGURE 4
Glucose and insulin. No significant effect of DOM treatment on fasting glucose (A), fasting insulin (B), and glucose AUC (C) in blood of the survivors (n = 102) at 24 mo (C, n = 26; D, n = 28; F, n = 25; FD, n = 23) are detected according to two‐way ANOVA. Significant fructose effect on fasting glucose and glucose AUC was observed at 12 mo of age, but this effect was diminished at 24 mo of age. Abbreviation: C, Control; D, Deep ocean mineral water; F, Fructose; FD, Fructose + Deep ocean mineral water, Glucose area under curve (Glucose AUC). *P < .05 compared against the C group at the same time point; P < .05 compared against their baseline value at 6 mo
FIGURE 5
FIGURE 5
Body composition. Lean mass slightly increased from 6 to 12 mo of age and decreased thereafter (A). Fat mass increased progressively from 6 mo and reaching plateau after 18 mo of age (B). Significant fructose effect on fat mass was observed from 18 to 24 mo of age (main effect). These data were collected based on the survivors (n = 102) at 24 mo (C, n = 26; D, n = 28; F, n = 25; FD, n = 23). Bone mass showed similar trend as fat mass, but fructose effect was less notable (C). Abbreviation: C, Control; D, Deep ocean mineral water; F, Fructose; FD, Fructose + Deep ocean mineral water dual‐energy x‐ray absorptiometry. *P < .05 compared against the C group at the same time point; P < .05 compared against their baseline value at 6 mo
FIGURE 6
FIGURE 6
Physical vitality. Horizontal movement distance (A) and movement speed (B) decreased with age. However, the D and F groups sustained higher spontaneous locomotive activity until 18 mo of age. The trajectory data were collected based on the survivors (n = 102) at 24 mo (C, n = 26; D, n = 28; F, n = 25; FD, n = 23). Abbreviation: C, Control; D, Deep ocean mineral water; F, Fructose; FD, Fructose + Deep ocean mineral water. *P < .05 compared against the C group at the same time point; P < .05 compared within the same group against the baseline at 6 mo
FIGURE 7
FIGURE 7
Plasma glutathione. Reduced glutathione (GSH) (A) and reduced‐to‐oxidized glutathione ratio (GSH/GSSG) (B) decreased with age until 18 mo and resurged at 24 mo of age above 6 mo level. Scatter plot between tumor size progression and magnitude of GSH/GSSG resurged from 18 to 24 mo of rats (low GSH/GSSG resurged group vs high GSH/GSSG resurged group) (C). High GSH/GSSG resurged group showed low incidence of tumor progression. These data were collected based on the survivors (n = 102) at 24 mo (C, n = 26; D, n = 28; F, n = 25; FD, n = 23). Abbreviation: C, Control; D, Deep ocean mineral water; F, Fructose; FD, Fructose + Deep ocean mineral water. *P < .05 compared against the C group at the same time point; P < .05 compared within the same group against the baseline at 6 mo

Similar articles

References

    1. Martin W, Baross J, Kelley D, Russell MJ. Hydrothermal vents and the origin of life. Nat Rev Microbiol. 2008;6:805. - PubMed
    1. Othmer DF, Roels OA. Power, fresh water, and food from cold, deep sea water. Science. 1973;182:121‐125. - PubMed
    1. Miyamura M, Yoshioka S, Hamada A, et al. Difference between deep seawater and surface seawater in the preventive effect of atherosclerosis. Biol Pharm Bull. 2004;27:1784‐1787. - PubMed
    1. Kim S, Chun S‐Y, Lee D‐H, Lee K‐S, Nam K‐S. Mineral‐enriched deep‐sea water inhibits the metastatic potential of human breast cancer cell lines. Int J Oncol. 2013;43:1691‐1700. - PubMed
    1. Lee K, Lee D, Kwon Y, Chun S, Nam K. Deep‐sea water inhibits metastatic potential in HT‐29 human colorectal adenocarcinomas via MAPK/NF‐κB signaling pathway. Biotechnol Bioprocess Bioeng. 2014;19:733‐739.

Publication types