. 2020 Jun 4;26(6):910-925.e6.
doi: 10.1016/j.stem.2020.03.006. Epub 2020 Apr 2.

A Metformin-Responsive Metabolic Pathway Controls Distinct Steps in Gastric Progenitor Fate Decisions and Maturation

Affiliations

A Metformin-Responsive Metabolic Pathway Controls Distinct Steps in Gastric Progenitor Fate Decisions and Maturation

Zhi-Feng Miao et al. Cell Stem Cell. .

Abstract

Cellular metabolism plays important functions in dictating stem cell behaviors, although its role in stomach epithelial homeostasis has not been evaluated in depth. Here, we show that the energy sensor AMP kinase (AMPK) governs gastric epithelial progenitor differentiation. Administering the AMPK activator metformin decreases epithelial progenitor proliferation and increases acid-secreting parietal cells (PCs) in mice and organoids. AMPK activation targets Krüppel-like factor 4 (KLF4), known to govern progenitor proliferation and PC fate choice, and PGC1α, which we show controls PC maturation after their specification. PC-specific deletion of AMPKα or PGC1α causes defective PC maturation, which could not be rescued by metformin. However, metformin treatment still increases KLF4 levels and suppresses progenitor proliferation. Thus, AMPK activates KLF4 in progenitors to reduce self-renewal and promote PC fate, whereas AMPK-PGC1α activation within the PC lineage promotes maturation, providing a potential suggestion for why metformin increases acid secretion and reduces gastric cancer risk in humans.

Keywords: ADM; SPEM; mTORC1; metaplasia; mitochondria; paligenosis; ribosomes.


Conflict of interest statement

Declaration of Interests The authors declare no competing interests.

Figures

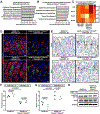
Figure 1.
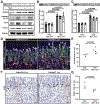
Figure 1.. Parietal cells express AMPK-pathway-related transcripts; metformin decreases isthmal progenitor proliferation and increases parietal cell census
A. Gene set enrichment analysis (GSEA) of Affymetrix GeneChip expression profiles of flow-sorted parietal cell (PCs) from Atp4b-cre;Rosa;mT/mG mice. Broad Gene Ontology (GO) genesets with highest normalized enrichment and FDR are depicted. B. GSEA plot for the Reactome Regulation of AMPK Stimulating Fatty Acid Oxidation geneset. C. Immunohistochemistry for AMPKα2. Scale bar, 30 μm. D. Immunofluorescence for PCs (VEGFB, white), mucous neck cells (lectin GSII, green), digestive-enzyme-secreting chief cells (Gastric Intrinsic Factor, GIF, red,) and nuclei (DAPI, blue) in wildtype mouse stomach after 14 days metformin treatment. Scale bar, 30 μm. E. Quantification of principle, corpus epithelial cell lineages of wildtype mouse stomach after 14 days ±metformin. Data represented as mean change ±SEM in cell number from ≥35 gastric units in a metformin-treated mouse vs. its vehicle-treated control. F. Immunohistochemistry for BrdU, a marker of cell cycle S-phase. Scale bar, 30 μm. G. Quantification of results as in panel (F). Each datapoint represents the mean BrdU+ cells per gastric unit from ≥20 gastric units per mouse. Statistical information: Significance calculated using two-tailed Student’s t-test.
Figure 2.
Figure 2.. Metformin decreases isthmal progenitor proliferation and increases parietal cell census during regeneration from parietal cell ablation
A. Representative western blot of AMPKα pathway proteins (total AMPKα, p-AMPKα Thr172, KLF4, PGC1α; β-tubulin as loading control) from wildtype mice whole stomach body ±3 days high-dose tamoxifen (TAM) ±metformin (MET), euthanized at 14 days (see SFig.2B–D for mouse treatment scheme). B. qRT-PCR of AMPKα pathway genes (Prkaa1, Prkaa2, Ppargc1a, Tbp used to normalize) from wildtype mice whole stomach body after 3 days high-dose tamoxifen ± metformin, euthanized at 14 days as for panel (A). Data represented as mean ±SEM from each mouse normalized to average ΔCt of vehicle-treated mice, n=3 independent experiments. C. qRT-PCR for mRNAs expressed preferentially in PCs (Ezrin, Atp4b, Vegfb, Tbp as loading control) as for panel (B). D. Immunofluorescence for PCs (VEGFB, white), mucous neck cells (lectin GSII, green), chief cells (Gastric Intrinsic Factor, red) and nuclei (DAPI, blue) in wildtype mouse stomach + high-dose tamoxifen ± metformin, euthanized at d14. Yellow dotted line depicts a single gastric unit. Scale bar, 30 μm. E. Quantification of PC number as in panel (D). Each datapoint represents the mean number of PCs per gastric unit from ≥40 gastric units per mouse. F. Immunohistochemistry for BrdU. Red dotted line depicts a single gastric unit. Scale bar, 30 μm. G. Quantification of BrdU+ cells as in panel (F). Each datapoint represents the mean number of BrdU+ cells per gastric unit from ≥20 gastric units per mouse. Statistical information: Significance calculated using one-tailed Student’s t-test.
Figure 3.
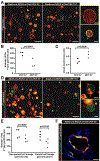
Figure 3.. Metformin decreases proliferation and increases relative representation of parietal cell lineage ex vivo in gastric organoids
A. Gastric organoids derived directly from Atp4b-cre;ROSA mT/mG mice (“1st generation” gastroids). Red (tdTomato): non-parietal lineage cells; Green (GFP): PC lineage. Scale bar, 500 μm; insets show magnified organoids at left, 200 μm. B. Quantification of diameter of 1st generation gastroids as in panel (A). Statistical information: Each datapoint represents the mean value of all measurable organoids in all wells from an individual mouse. C. Quantification of the relative representation (area) of PC lineage (green cells) vs. non-parietal lineage cells (red) ±metformin. Each datapoint represents the mean value of all measureable organoids in all wells from an individual mouse. D. 2nd generation gastroids were generated as clones from single cells dissociated from 1st generation gastroids. Metformin or vehicle was introduced as single cell suspensions were replated. Scale bar, 500 μm; box area, 200 μm. E. Quantification of diameter of 2nd generation gastroids as in panel (D). Each datapoint represents the mean value of all measurable organoids in all wells from an individual mouse. F. Immunofluorescence for GFP (anti-GFP here is pseudocolored red) co-labeled with PC marker VEGFB (green), and nuclei (blue, DAPI) in 2nd generation gastroid. Scale bar, 50 μm. Statistical information: Significance calculated using one-tailed Student’s t-test.
Figure 4.
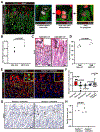
Figure 4.. KLF4 and PGC1α are downstream targets of AMPK that influence progenitor cell behavior and parietal cell maturation
A. Immunofluorescence for KLF4 (red) expression with proliferation (BrdU, white), and PCs (thick Ezrin, green) in wildtype mice stomachs after 3 days high-dose tamoxifen ±metformin, euthanized at d7. Insets show apparent stages in progenitor cell fate choice towards PC lineage. Progenitor cells were BrdU+ with scant apical ezrin (blue inset, cell outlined). BrdU+/KLF4+ cells with slightly thicker apical ezrin were consistent with early differentiation, likely towards PC fate (pink inset, cell outlined). The gold inset shows a BrdU+ and KLF4+ cell with thick, apical ezrin, specific to the PC lineage. Scattered mucous neck cells (yellow arrowhead) were BrdU+, yet lacked detectable ezrin and were never KLF4+. White arrowhead marks non-epithelial and/or non-specific labeling. Scale bar, 30 μm. B. Quantification of KLF4+/Ezrin+ cells in wildtype mice with 14 days ±metformin at homeostasis. Each datapoint represents the mean value of KLF4+/Ezrin+ cells per gastric from ≥80 gastric units per mouse. C. Immunohistochemistry images of KLF4 staining of wildtype mice stomachs after 3 days high-dose tamoxifen ±metformin, euthanized at d7. Scale bar, 30 μm. D. Quantification of KLF4+ cells as in panel (C). Each datapoint represents the mean value of KLF4+ cells per gastric from ≥40 gastric units per mouse. E. Immunofluorescence for homeostatic PGC1α (green) expression with PCs (Ezrin, red) and nuclei marker (DAPI, blue) in stomachs from wildtype and Ppargc1−/− mice. Inset highlights intracellular staining pattern. Scale bar, 30 μm, 15 for inset. F. Quantification of principal, corpus epithelial cell lineages in wildtype and Ppargc1−/− mouse stomach in homeostasis. Data represented as mean difference in mutant vs. control cell count ±SEM (≥20 gastric units counted mouse). Significance calculated using two-tailed Student’s t-test; error bars are ±SEM. G. Immunohistochemistry for BrdU in wildtype and Ppargc1−/− mouse stomach in homeostasis. Scale bar, 30 μm H. Quantification of BrdU+ cells as in panel (F). Each datapoint represents the mean value of BrdU+ cells per gastric unit from ≥80 gastric units per mouse. Significance calculated using two-tailed Student’s t-test. Statistical information: Significance calculated using one-tailed Student’s t-test unless otherwise stated.
Figure 5.
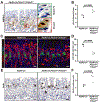
Figure 5.. Parietal cell-lineage deletion of AMPK decreases parietal cell census and increases progenitor cell proliferation in homeostasis
A. Immunohistochemistry of AMPKα2 expression in Atp4b-cre;Prkaa1Δ/Δ;Prkaa2Δ/Δ mice in homeostasis. Boxed area highlights a mutant PC, with characteristic eccentric nucleus and reduced size and an escaper PC that looks essentially normal. Scale bar, 30 μm. B. Quantification of gastric juice pH value of Atp4b-cre;Prkaa1Δ/Δ;Prkaa2Δ/Δ and Atp4b-cre control mice Each datapoint represents the pH value from an individual mouse. C. Immunofluorescence for PCs (VEGFB, red), mucous neck cells (lectin GSII, green), and nuclei (DAPI, blue) from Atp4b-cre;Prkaa1Δ/Δ;Prkaa2Δ/Δ and Atp4b-cre mice. Scale bar, 30 μm. D. Quantification of VEGFB+ PCs as in panel (C). Each datapoint represents the mean number of PCs per gastric unit from ≥35 gastric units per mouse. E. Immunohistochemistry images of BrdU staining of Atp4b-cre;Prkaa1Δ/Δ;Prkaa2Δ/Δ and Atp4b-cre control mice in homeostasis. Scale bar, 30 μm. F. Quantification of VEGFB+ cells as in panel (E). Each datapoint represents the mean value of BrdU+ cells per gastric unit from ≥40 gastric units counted per mouse. Statistical information: Significance calculated using two-tailed Student’s t-test.
Figure 6.
Figure 6.. Metformin still decreases progenitor proliferation and fate choice but not parietal cell maturation in mice with PC-specific AMPK deletion
A. GSEA analysis of top hits from the Broad Gene Ontology (GO) genesets in 14d-metformintreated wildtype (WT) vs. vehicle-treated wildtype mice are depicted. B. GSEA analysis of top hits from GO genesets as for panel (A) for Atp4b-cre; Prkaa1Δ/Δ;Prkaa2Δ/Δ mice treated with 14 days of metformin vs vehicle treatment are depicted. C. Heat map depicting data from panels (A-B) of AMPK targets that are known transcriptional regulators (Klf4, Hdac5, Foxo3, Ep300) across the 4 conditions/genotypes. Gene expression is expressed as fold change relative to vehicle-treated control genotype mice. D. Immunofluorescence for PCs (red, VEGFB); mucous neck cells (green, GSII), and nuclei (blue, DAPI) from Atp4b-cre;Prkaa1Δ/Δ;Prkaa2Δ/Δ and Atp4b-cre control mice after 3 days high-dose tamoxifen ±metformin during mid-regeneration timepoint (euthanized at d7). Scale bar, 30 μm. E. Immunohistochemistry of BrdU staining in mice treated as for panel (D). Scale bar, 30 μm. F. Quantification of VEGFB+ PC number as in panel (D). Each datapoint represents mean value of PCs per gastric unit from ≥35 gastric units per mouse. G. Quantification of BrdU+ cells per gastric unit as in panel (E). Each datapoint represents the mean value of BrdU+ cells per gastric unit from ≥40 gastric units per mouse. H. Western blot of whole stomach body at homeostasis, showing AMPKα pathway proteins (pAMPKα Thr172, KLF4; β-tubulin as loading control) from Atp4b-cre;Prkaa1Δ/Δ;Prkaa2Δ/Δ and Atp4b-cre control mice ±metformin, euthanasia at d14. Statistical information: Significance calculated using one-tailed Student’s t-test.
Figure 7.
Figure 7.. AMPKα and its target PGC1α dictate maturation of the parietal cell lineage
A. Immunofluorescence for PCs (red, VEGFB); mucous neck cells (green, GSII) and nuclei (blue, DAPI) from Atp4b-cre;Ppargc1Δ/Δ mice. Scale bar, 30 μm. B. Immunofluorescence for PGC1α (green), Ezrin (red), and nuclei (blue, DAPI) in Atp4b-cre; Prkaa1Δ/Δ;Prkaa2Δ/Δ, Atp4b-cre;Ppargc1Δ/Δ and Atp4b-cre control mice. Yellow boxes highlight PCs with PGC1α, white boxes highlight those without PGC1α. Scale bar, 30 μm. C. Quantification of PC size as in panel (A) and Fig.5C. Each datapoint represents the mean PC size from ≥200 PCs per mouse. Significance calculated using an ANOVA with multiple comparisons to the Atp4b-cre control (Dunnett post-hoc test). D. Immunofluorescence for anti-Cytochrome C (green, mitochondria), Ezrin (red, PC), and nuclei (blue, DAPI) in Atp4b-cre;Prkaa1Δ/Δ;Prkaa2Δ/Δ, Atp4b-cre;Ppargc1Δ/Δ and Atp4b-cre control mice. PCs in mutant mice were small and had markedly aberrant ezrin and cytochrome C distribution (arrowheads). Scale bar, 30 μm. E. Transmission EM of control and mutant mice. Electron dense regions at periphery of mutant cells contained scattered mitochondria and abundant free ribosomes (higher magnification to visualize mitochondrial and ribosomal morphology of the same cells are shown in SFig.6H). Scale bar, 2 μm. F. Quantification of mitochondria per PC from tEM images as for panel (E). Each datapoints represents a single PC scored from tEM of ≥60 PCs. Significance calculated using ANOVA with Dunnett multiple comparisons to the Atp4b-cre control.

Similar articles

Cited by

References

    1. Abe K, Irie K, Nakanishi H, Suzuki H, and Fujiyoshi Y (2018). Crystal structures of the gastric proton pump. Nature 556, 214–218. - PubMed
    1. Adami JG (1900). On growth and overgrowth In “Festschrift” in honor of Abraham Jacobi, MD, LLD: to commemorate the seventieth anniversary of his birth, May sixth, 1900, Huber F, Sondern FE (eds) (New Rochelle, NY: Knickerbocker Press; ), pp. 422–432.
    1. Adami JG, and Nicholls AG (1910). The principles of pathology (Philadelphia: : Lea & Febiger, 1908-1909).
    1. Babcook MA, Shukla S, Fu P, Vazquez EJ, Puchowicz MA, Molter JP, Oak CZ, MacLennan GT, Flask CA, Lindner DJ, et al. (2014). Synergistic simvastatin and metformin combination chemotherapy for osseous metastatic castration-resistant prostate cancer. Mol Cancer Ther 13, 2288–2302. - PMC - PubMed
    1. Bao X, Tang J, Lopez-Pajares V, Tao S, Qu K, Crabtree GR, and Khavari PA (2013). ACTL6a enforces the epidermal progenitor state by suppressing SWI/SNF-dependent induction of KLF4. Cell Stem Cell 12, 193–203. - PMC - PubMed

Publication types