. 2020 Apr 20;53(2):199-211.e6.
doi: 10.1016/j.devcel.2020.03.005. Epub 2020 Apr 2.

Metabolic Reprogramming Promotes Neural Crest Migration via Yap/Tead Signaling

Affiliations

Metabolic Reprogramming Promotes Neural Crest Migration via Yap/Tead Signaling

Debadrita Bhattacharya et al. Dev Cell. .

Abstract

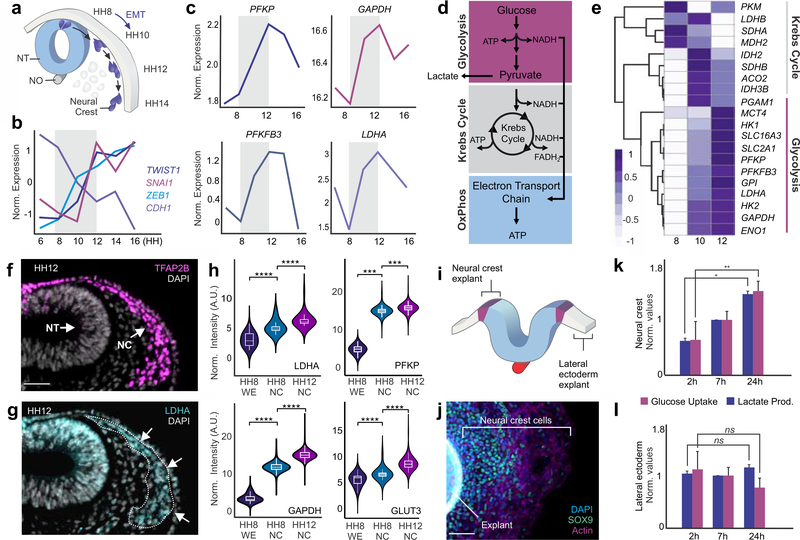
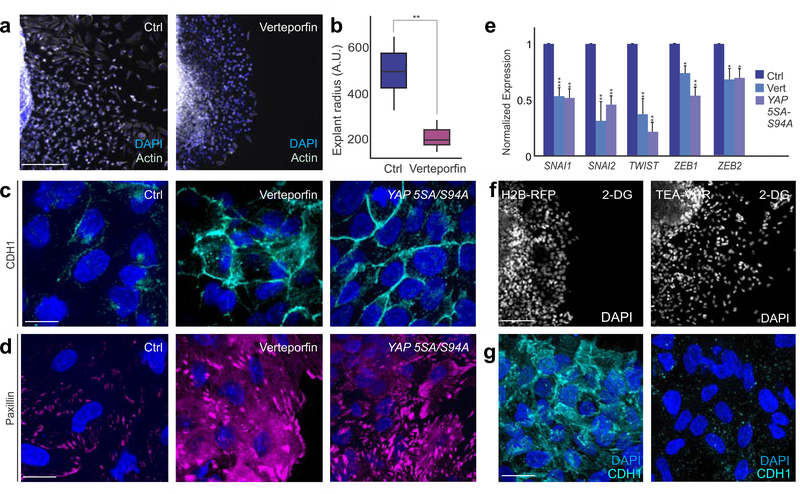
The Warburg effect is one of the metabolic hallmarks of cancer cells, characterized by enhanced glycolysis even under aerobic conditions. This physiological adaptation is associated with metastasis , but we still have a superficial understanding of how it affects cellular processes during embryonic development. Here we report that the neural crest, a migratory stem cell population in vertebrate embryos, undergoes an extensive metabolic remodeling to engage in aerobic glycolysis prior to delamination. This increase in glycolytic flux promotes Yap/Tead signaling, which activates the expression of a set of transcription factors to drive epithelial-to-mesenchymal transition. Our results demonstrate how shifts in carbon metabolism can trigger the gene regulatory circuits that control complex cell behaviors. These findings support the hypothesis that the Warburg effect is a precisely regulated developmental mechanism that is anomalously reactivated during tumorigenesis and metastasis.

Keywords: Warburg effect; Yap/Tead signaling; cell metabolism; cell migration; epithelial to mesenchymal transition; glycolysis; neural crest.


Conflict of interest statement

Declaration of Interests The authors declare no competing interests.

Figures

Figure 1.
Figure 1.. The expression of glycolytic enzymes is upregulated in migratory neural crest cells
(a) Diagram of avian neural tube transverse section, showing the position of cranial neural crest cells at distinct developmental stages. (b) Transcriptional profiles of EMT regulators in developing neural crest cells. Expression of TWIST1, SNAI1, ZEB1 increases during migration while there is a reduction in CDH1 (E-cadherin) transcript levels. (c) Expression levels of rate-limiting glycolytic enzymes increase during neural crest EMT. (d) Simplified schematic of carbohydrate metabolism in eukaryotic cells. (e) Clustering analysis showing an increase in the expression of glycolytic enzymes in pre-migratory (HH8), migratory (HH10) and late migratory (HH12) neural crest cells. The heatmap shows z-score normalized expression levels of each metabolic genes. (f-g) Immunostaining for glycolytic enzyme LDHA reveals high protein expression in TFAP2B+ migratory neural crest cells. (h) The protein levels of glycolytic enzymes LDHA, PFKP, GAPDH, and GLUT3 are enriched in pre-migratory neural crest cells (HH8) and increases further upon neural crest migration. (i) Diagram indicating the regions of the ectoderm that were dissected for explant culture. (j) Neural fold explant with a halo of migratory SOX9+ neural crest cells. (k-l) Cultured neural crest cells increase in glucose uptake and lactate production during migration, while these parameters remain constant in lateral ectoderm explants. Ect: Ectoderm; EMT: epithelial-mesenchymal transition; HH: Hamburger and Hamilton stage; NC: Neural Crest; NT: neural tube; NO: notochord. Error bars represent ± S.E.M. Scale bar : 50 um (f-g), 200um (j).
Figure 2.
Figure 2.. Cranial neural crest cells display the Warburg effect at the onset of migration
(a) Basal oxygen consumption and extracellular acidification rates measured using Seahorse XF indicate that metabolically quiescent neural crest cells (NC HH7) become highly glycolytic during delamination (NC HH9). Lateral ectoderm cells remain quiescent (Ect HH9), whereas neural crest-derived melanocytes have been reported to be highly aerobic. (b-c) Despite the increased rates of extracellular acidification (ECAR) and proton efflux (PER) in HH9 neural crest, the oxygen consumption rates (OCR) in these cells is not significantly different from other tissues (b). This manifests in reduced OCR/ECAR ratio in HH9 cells compared to HH7 neural crest (c). (d) Diagram showing the electroporation scheme for assessing the activity of metabolic reporters in avian neural crest cells and neural progenitors at different developmental stages. (e-h) Transverse sections of HH10 transgenic embryos transfected with reporters of intracellular NAD+/NADH ratio (Rex-YFP) and Tfap2aE1:Cherry (e-f) and cytoplasmic glucose levels (Green Glifon50) and Sox2N2:Cherry (g-h). (i-j) Flow cytometry quantification of Rex:YFP (i) and Green Glifon50 (j) activity in isolated neural crest (NC) and neural cells at two developmental stages. Both metabolic reporters have high activity in Tfap2E1+ neural crest cells and display low overlap with Sox2N2+ neural progenitor cells. (k) Diagram depicting Tfap2aE1:Cherry transgenic embryos treatment with fluorescent glucose analog 2-NBDG. (l-m) Transverse section of an HH10 embryo showing colocalization of 2-NBDG and Tfap2aE1+ neural crest cells. (n) Boxplots showing the intensity of 2-NBDG in Tfap2aE1+ neural crest cells and Tfap2aE1- whole embryo cells at stages HH8 and HH10.che: Cherry ECAR: Extracellular Acidification Rate; Ect: Ectoderm; EMT: epithelial-mesenchymal transition; HH: Hamburger and Hamilton stage; PER: Proton Efflux Rate, NC: Neural Crest; Ne: Neural, OCR: Oxygen Consumption Rate. Error bars represent ± S.E.M. Also see Fig. S1. Scale bar : 50 um.
Figure 3.
Figure 3.. Inhibition of glycolysis disrupts neural crest migration
(a) Measurement of basal OCR and ECAR show that inhibition of glycolysis with 2-DG drives neural crest cells to adopt aerobic, rather than glycolytic, metabolism. (b) Lactate production by neural crest cells is inhibited by 2-DG treatment in a dose-dependent manner. (c) Despite reducing glycolytic flux, 2-DG treatment does not affect ATP levels in neural crest cells. (d) Images of control and 2-DG-treated neural crest explants after 24h of incubation. (e) Inhibition of glycolysis results in smaller neural crest explants. (f) Overlay of tracks of individual cells from a 12h time-lapse movie of a neural fold explant. Neural crest cells were transfected with vectors expressing H2B-RFP and Actin-GFP for live imaging. Cell trajectories in control and 2-DG treated explants show decreased neural crest migration following inhibition of aerobic glycolysis. (g-i) Treatment with 2-DG results in reduction of the maximum distance traveled, total displacement and mean speed of individual neural crest cells. ECAR: Extracellular Acidification Rate; HH: Hamburger and Hamilton stage; NC: neural crest; OCR: Oxygen Consumption Rate. 2-DG : 2- Deoxy-Glucose, Ctrl: Control, HH: Hamburger and Hamilton stage .Error bar represents ± S.E.M. Scale bar: 200um. Also see Fig. S2 and Fig. S3.
Figure 4.
Figure 4.. Aerobic glycolysis is required for neural crest EMT
(a) Immunofluorescence for different EMT markers reveals that cells in 2-DG treated explants retain epithelial features. (b) Transverse sections of HH12 embryos show that 2-DG treatment inhibits neural crest EMT and migration in vivo, resulting in the majority of cells being trapped adjacent to the dorsal neural tube. (c) Nanostring assay comparing gene expression profiles of control and 2-DG treated explants. Genes below the diagonal lines are significantly downregulated following inhibition of aerobic glycolysis. (d) Neural crest genes related to EMT are more strongly affected by 2-DG treatment, while many markers remain unchanged. (e) qPCR analysis confirms the loss of expression of bona fide EMT markers following inhibition of aerobic glycolysis. (f) Motif enrichment analysis performed with H3K27ac peaks in the loci of glycolysis-responsive genes identified the TEAD1 as one of the motifs to be statistically overrepresented. 2-DG : 2- Deoxy-Glucose, Ctrl: Control, NC: neural crest; NT: neural tube.Error bar represents ± S.E.M. Scale bar : 35 um (a), 50 um (b). Also see Fig. S4.
Figure 5.
Figure 5.. Glycolysis activates Yap/Tead signaling in neural crest cells by promoting YAP1-TEAD1 interaction
(a-c) Transverse section showing immunofluorescence for the non-phosphorylated form of YAP1 (Active YAP) and neural crest marker TFAP2B in an HH12 embryo. Arrows show enrichment of Active YAP in migratory neural crest cells. Inserts (b-c) depict nuclei marked by blue arrows. (d) Effect of inhibition of aerobic glycolysis on Yap signaling reporter. Neural crest 460 cells electroporated with HOP-GFP reporter and the transfection control plasmid pCI-CherryRas in control and in the presence of 2-DG. (e) Luminescence assay with luciferase version of the reporter (HOP-Flash) shows a reduction in Yap/Tead signaling activity. (f)Immunofluorescence for Active YAP1 in control and 2-DG explants. (g) Quantification of the nuclear intensity of active YAP1 staining shows a non-significant difference between control and 2-DG treated cells. (h) Proximity ligation assay (PLA) performed to detect YAP1 and TEAD1 interaction frequency in control vs 2-DG treated explants. (i) Quantification of PLA puncta revealed a significant decrease in YAP1-TEAD1 interaction frequency upon glycolytic inhibition. 2-DG: 2-Deoxy-Glucose, HH: Hamburger and Hamilton, PLA: Proximity Ligation Assay. Error bar represents ± S.E.M. Scale bar: 50 um (a-c,d), 35 um (f,h). Also see Fig. S5.
Figure 6.
Figure 6.. Pharmacological inhibition of YAP1-TEAD1 interaction prevents neural crest EMT.
(a-b) Inhibition of YAP1-TEAD1 interaction with Verteporfin inhibits neural crest migration and results in smaller neural crest explants. (c-d) Images of CDH1 and Paxillin staining in control, Verteporfin treated and dominant negative YAP 5SA-S94A transfected neural crest explants, show retention of epithelial features following inhibition of Yap/Tead signaling.(e) qPCR for EMT transcription factors following pharmacological (Vert) and competitive inhibition (mutant YAP5SA-S94A construct) of YAP1-TEAD1 interaction in neural crest cells.(f) Expression of TEA-VPR construct that mimics constitutively active TEAD1, rescues phenotypes of glycolytic inhibition. DAPI staining of control and TEA-VPR overexpressing explants treated with 2-DG. (g) Immunofluorescence for CDH1 shows successful EMT in TEA-VPR expressing explants, even in the presence of 2-DG. Error bars represents ± S.E.M.Scale bar : 200um (a,f), 35um (c-d,g). Also see Fig. S6.
Figure 7.
Figure 7.. YAP1 activates neural crest EMT via tissue-specific enhancers
(a) Diagram of CUT&RUN experiments to map genome occupancy of ActYAP1. (b) YAP-associated regions are mostly intergenic. (c) Heatmaps displaying ATAC-seq and H3K27ac signal at ActYAP1 bound regions show that YAP1 binds to open, active chromatin regions.(d) Transcription factor binding sites identified in YAP1-associated peaks. Tead1 was the enriched motif with the highest confidence score. (e) Gene ontology analysis of the genes closest to the YAP1-associated peaks suggests that Yap/Tead signaling is a major regulator of cell signaling and cell-cell adhesion. The plot shows the four most significant biological processes identified by the GO analysis. (f) Examples of regulatory regions associated with YAP1 in the vicinity of EMT regulators Sox9 and Zeb2. (g) Swarm plots showing GFP intensity driven by YAP-associated regions in neural crest cells. Neural crest cells were identified by a specific reporter (Tfap2E1:Che), and GFP expression was measured by flow cytometry. The regions tested were in the loci of the SOX9(Sox9E1), ETS1(Ets1ECR1), ZEB2(Zeb2E1), SNAI2(Snai2E1) and MYCN(MycNE1) genes. GFP intensity analysis was performed in 3500 Tfap2aE1:Che+ cells. (h) Transgenic chick embryos showing tissue-specific activity of Sox9E1, Ets1ECR1, and Zeb2E1. (i-j) Images of embryos transfected with YAP5SA-S94A mutant construct and Sox9E1, Ets1ECR1 and Zeb2E1 respectively. Embryos were injected with the enhancer and a control vector on the left side and the same enhancer and the Yap5SA-S94A on the right side. The expression of enhancer driven GFP was lost on the embryo side transfected with mutant YAP1 construct. (k) Inhibition of Yap/Tead signaling with YAP5SA-S94A prevents neural crest EMT and migration. HH: Hamburger and Hamilton. Scale bar: 200um. Error bars 505 represents ± S.E.M. Also see Fig. S7.

Comment in

References

    1. Acloque H, Adams MS, Fishwick K, Bronner-Fraser M, and Nieto MA (2009). Epithelial-mesenchymal transitions: the importance of changing cell state in development and disease. The Journal of clinical investigation 119, 1438–1449. - PMC - PubMed
    1. Azzarelli R, Simons BD, and Philpott A (2018). The developmental origin of brain tumours: a cellular and molecular framework. Development 145. - PMC - PubMed
    1. Bailey TL, Boden M, Buske FA, Frith M, Grant CE, Clementi L, Ren J, Li WW, and Noble WS (2009). MEME SUITE: tools for motif discovery and searching. Nucleic Acids Res 37, W202–208. - PMC - PubMed
    1. Barban S, and Schulze HO (1961). The effects of 2-deoxyglucose on the growth and metabolism of cultured human cells. J Biol Chem 236, 1887–1890. - PubMed
    1. Barembaum M, and Bronner ME (2013). Identification and dissection of a key enhancer mediating cranial neural crest specific expression of transcription factor, Ets-1. Dev Biol 382, 567–575. - PMC - PubMed

Publication types

Substances