. 2020 Apr 2;26(4):542-557.e11.
doi: 10.1016/j.stem.2020.02.013.

Smooth Muscle Cell Reprogramming in Aortic Aneurysms

Affiliations

Smooth Muscle Cell Reprogramming in Aortic Aneurysms

Pei-Yu Chen et al. Cell Stem Cell. .

Abstract

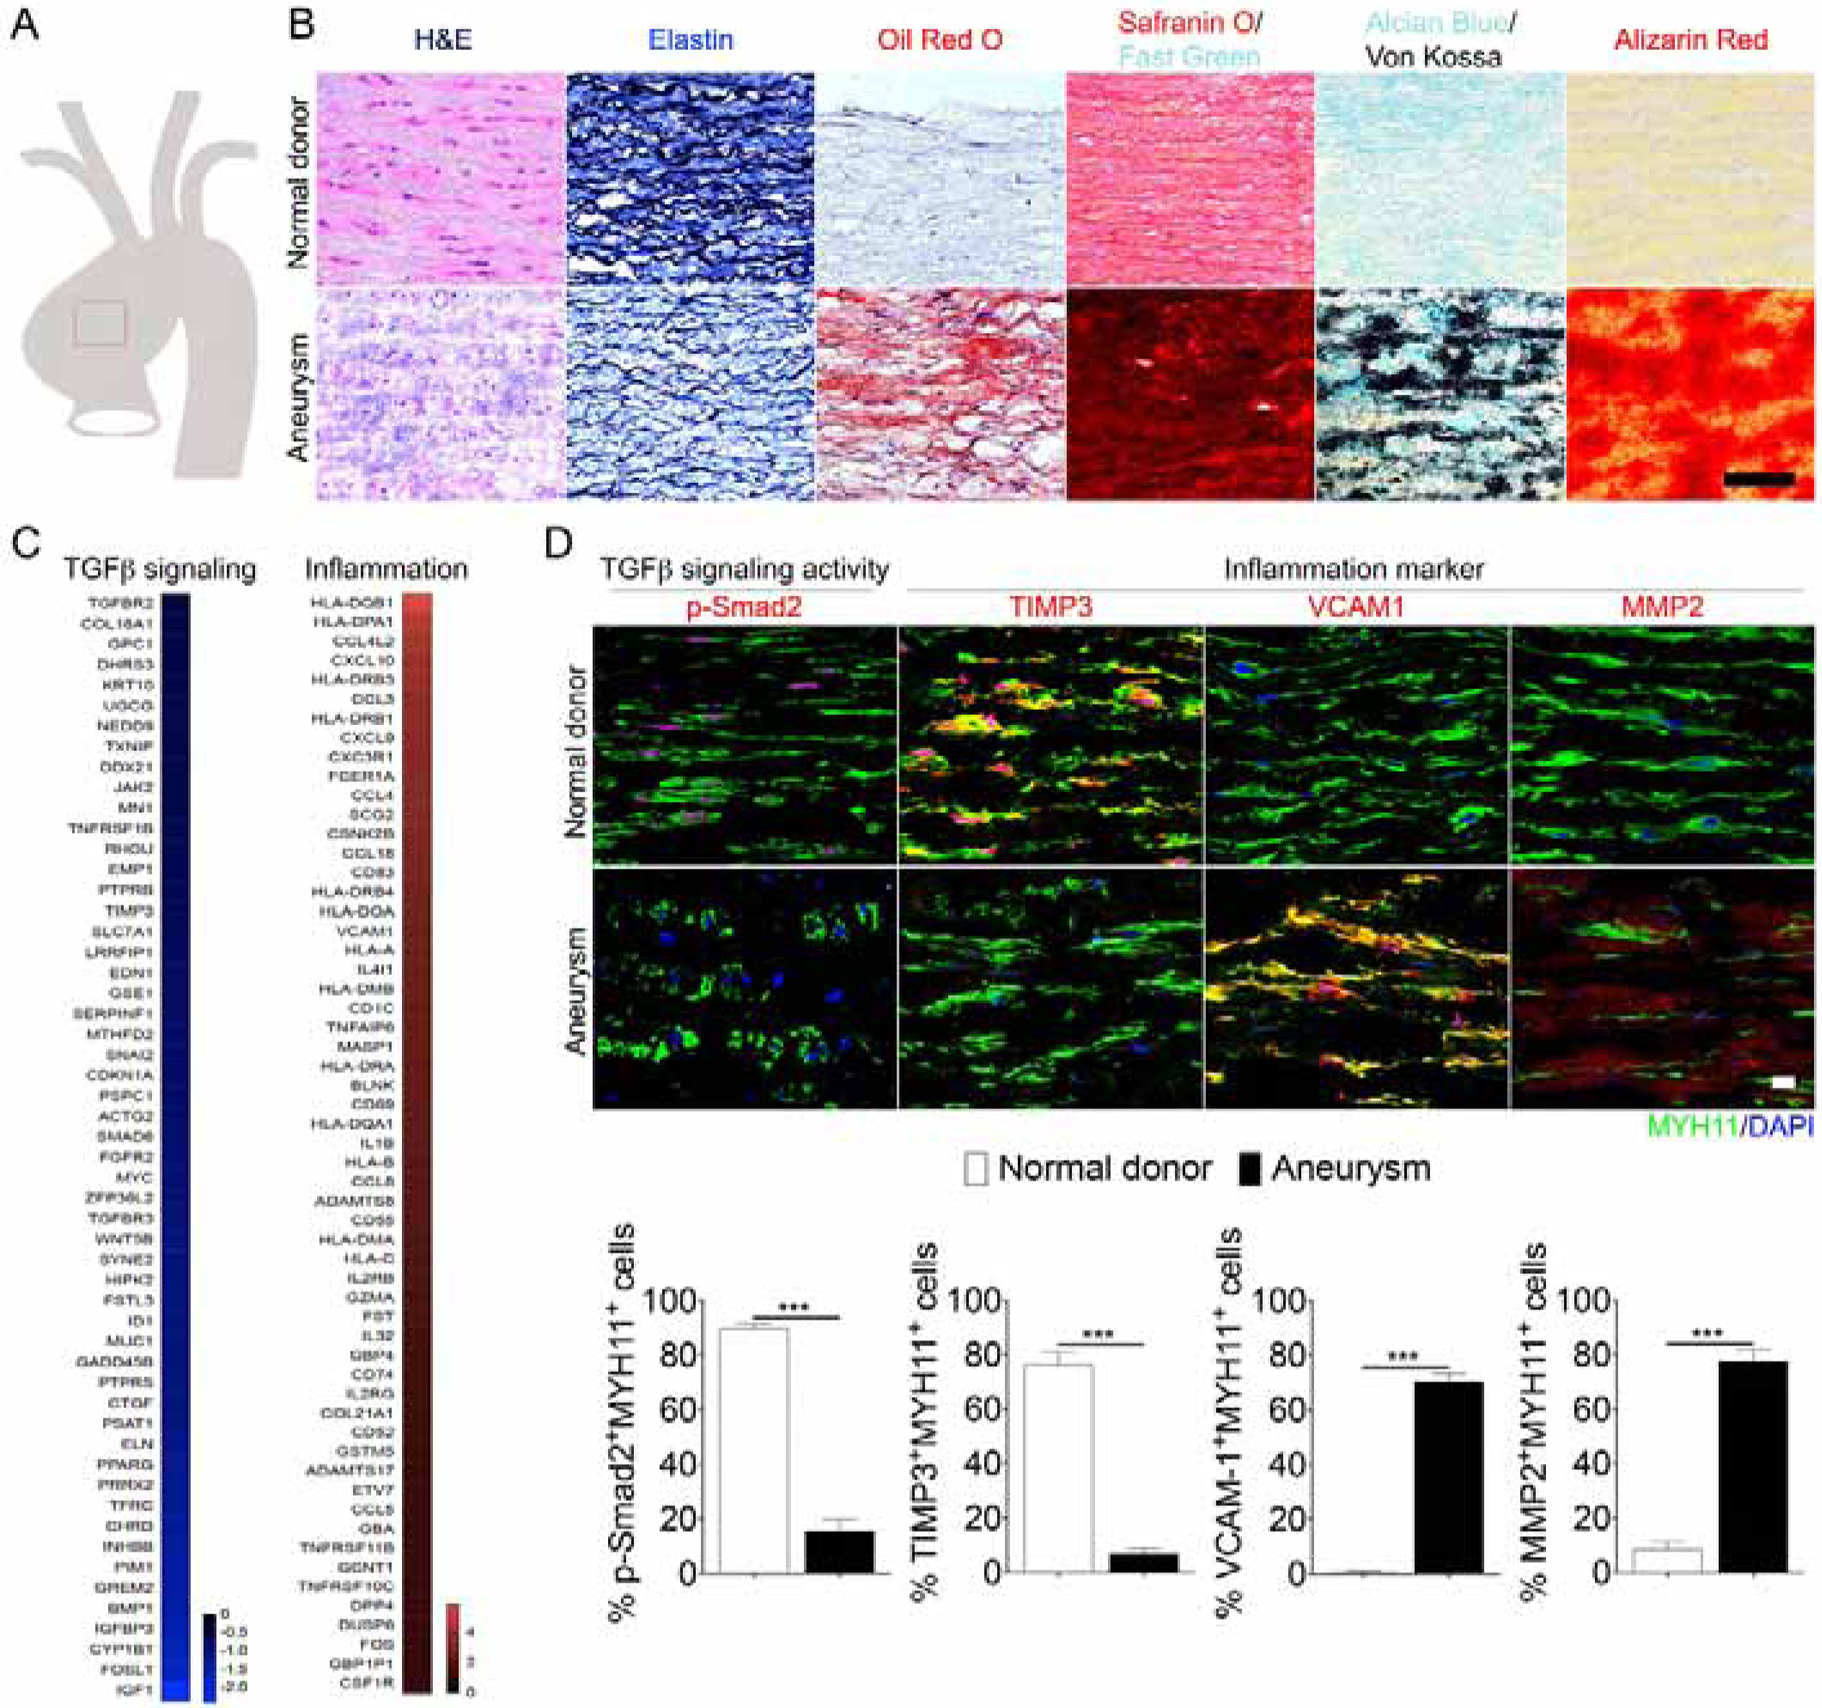
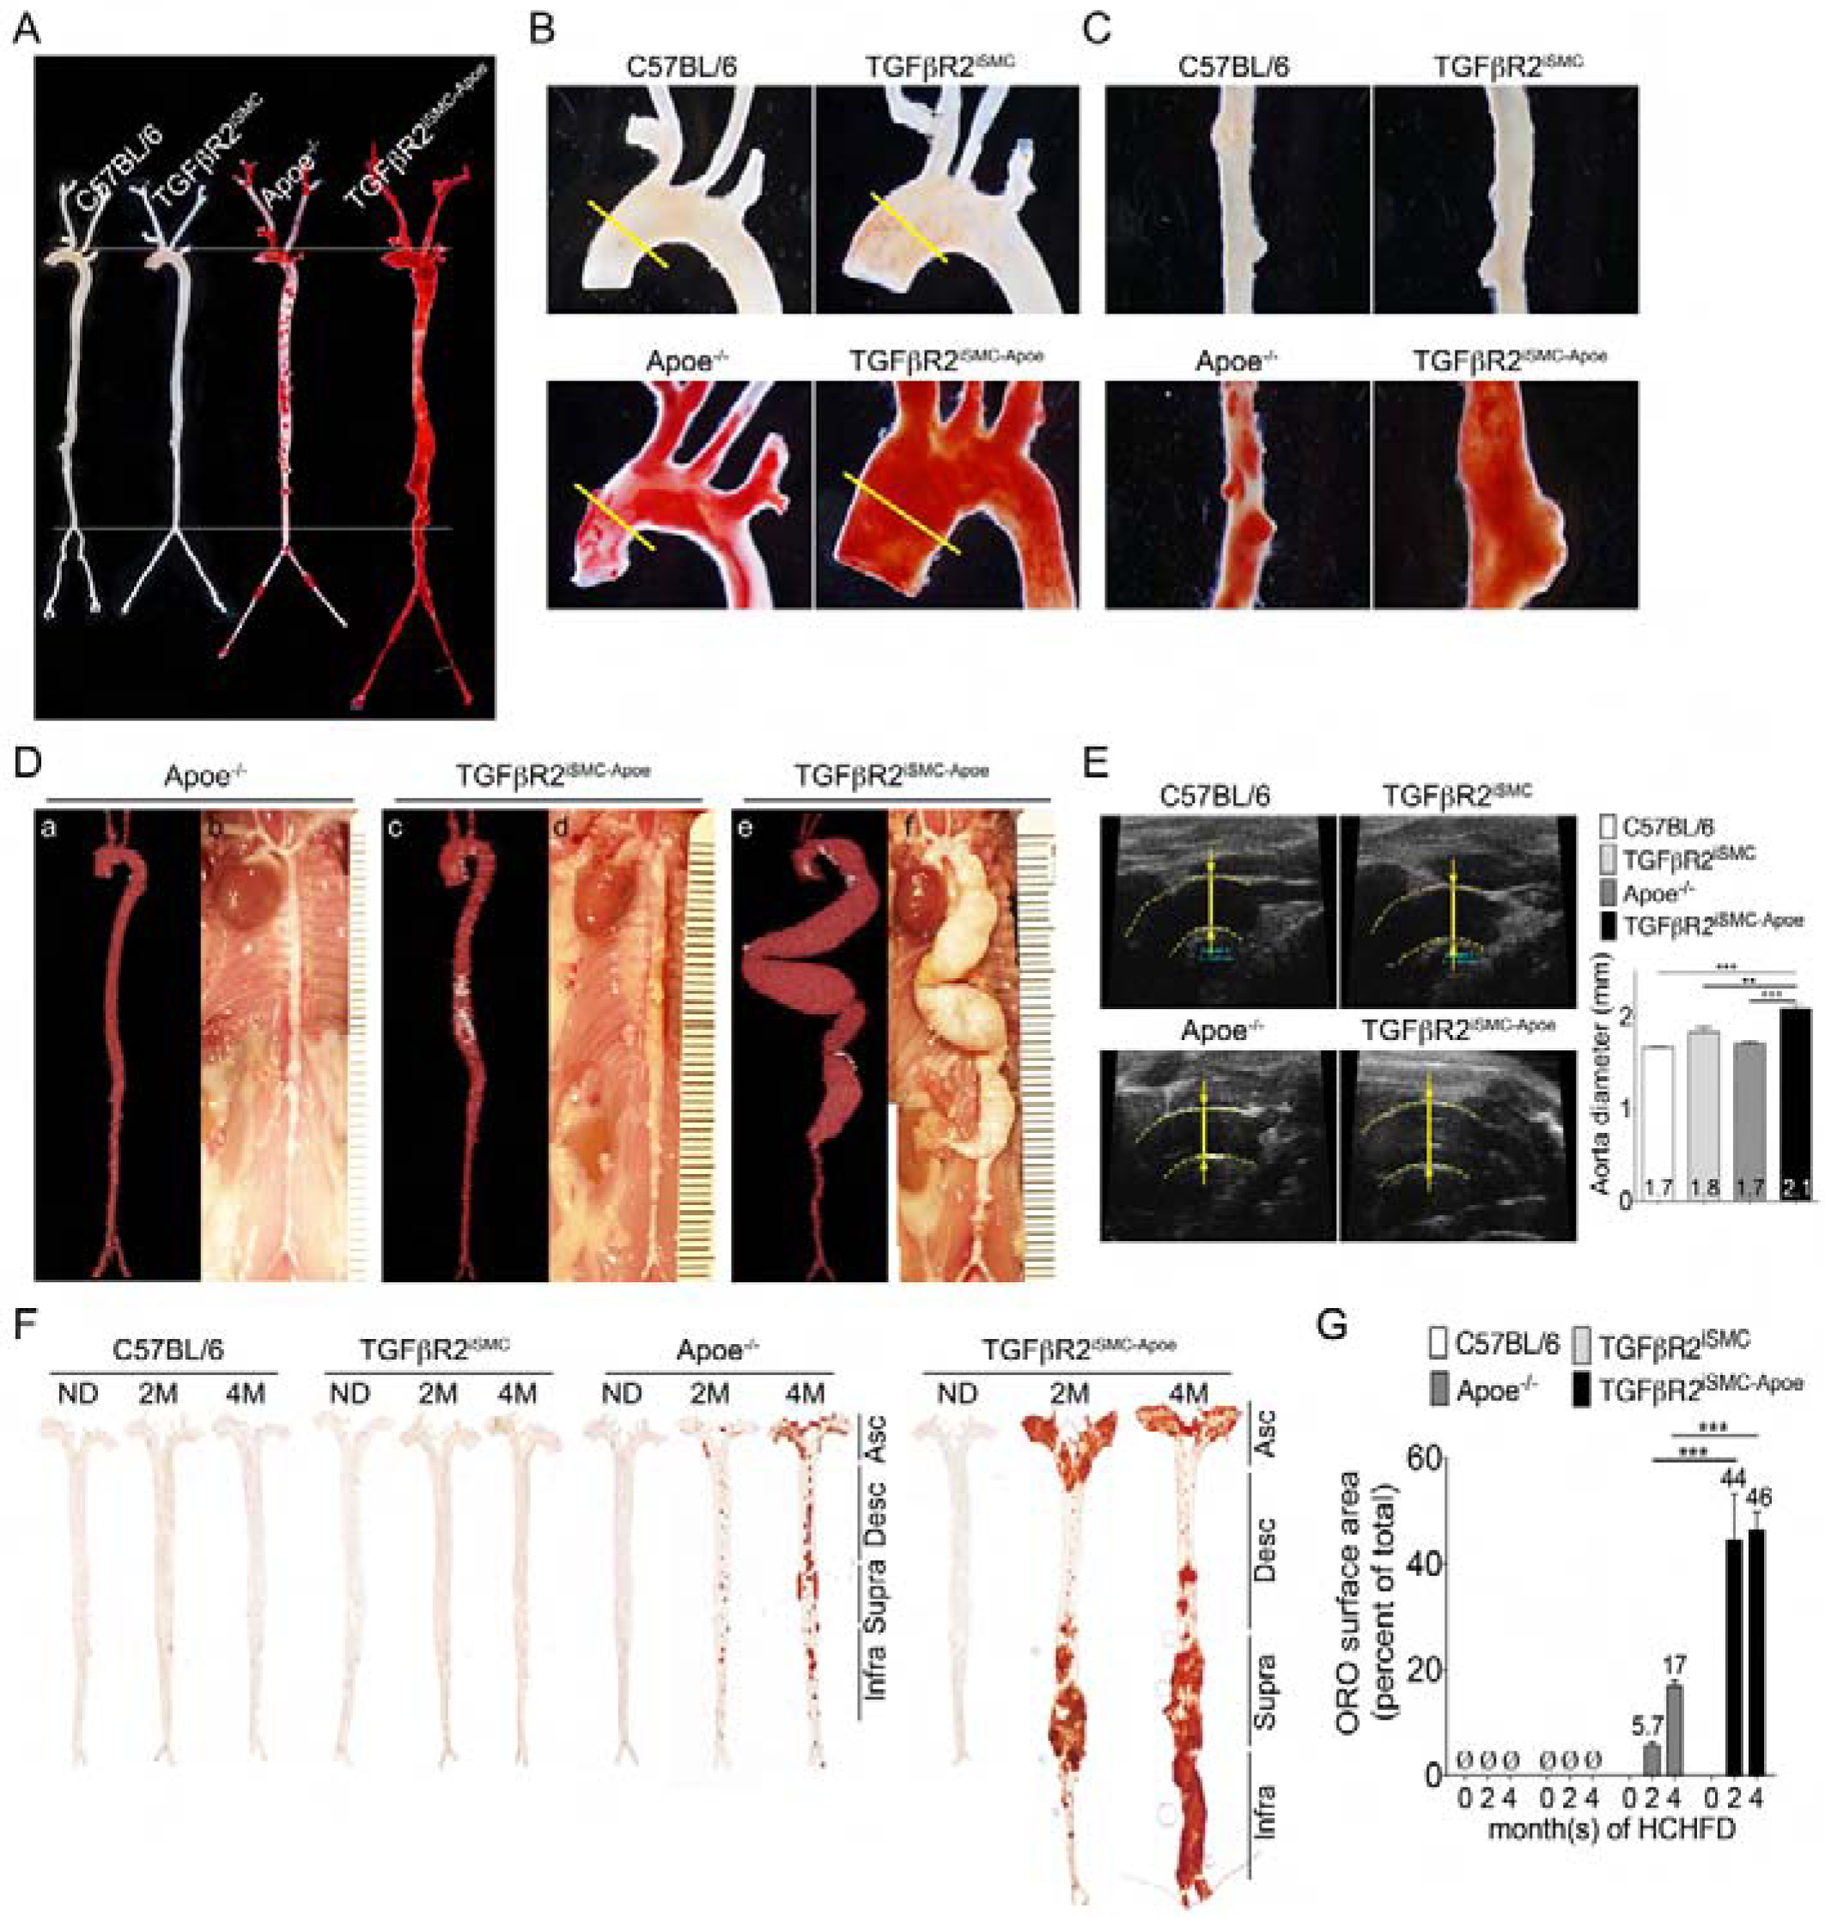
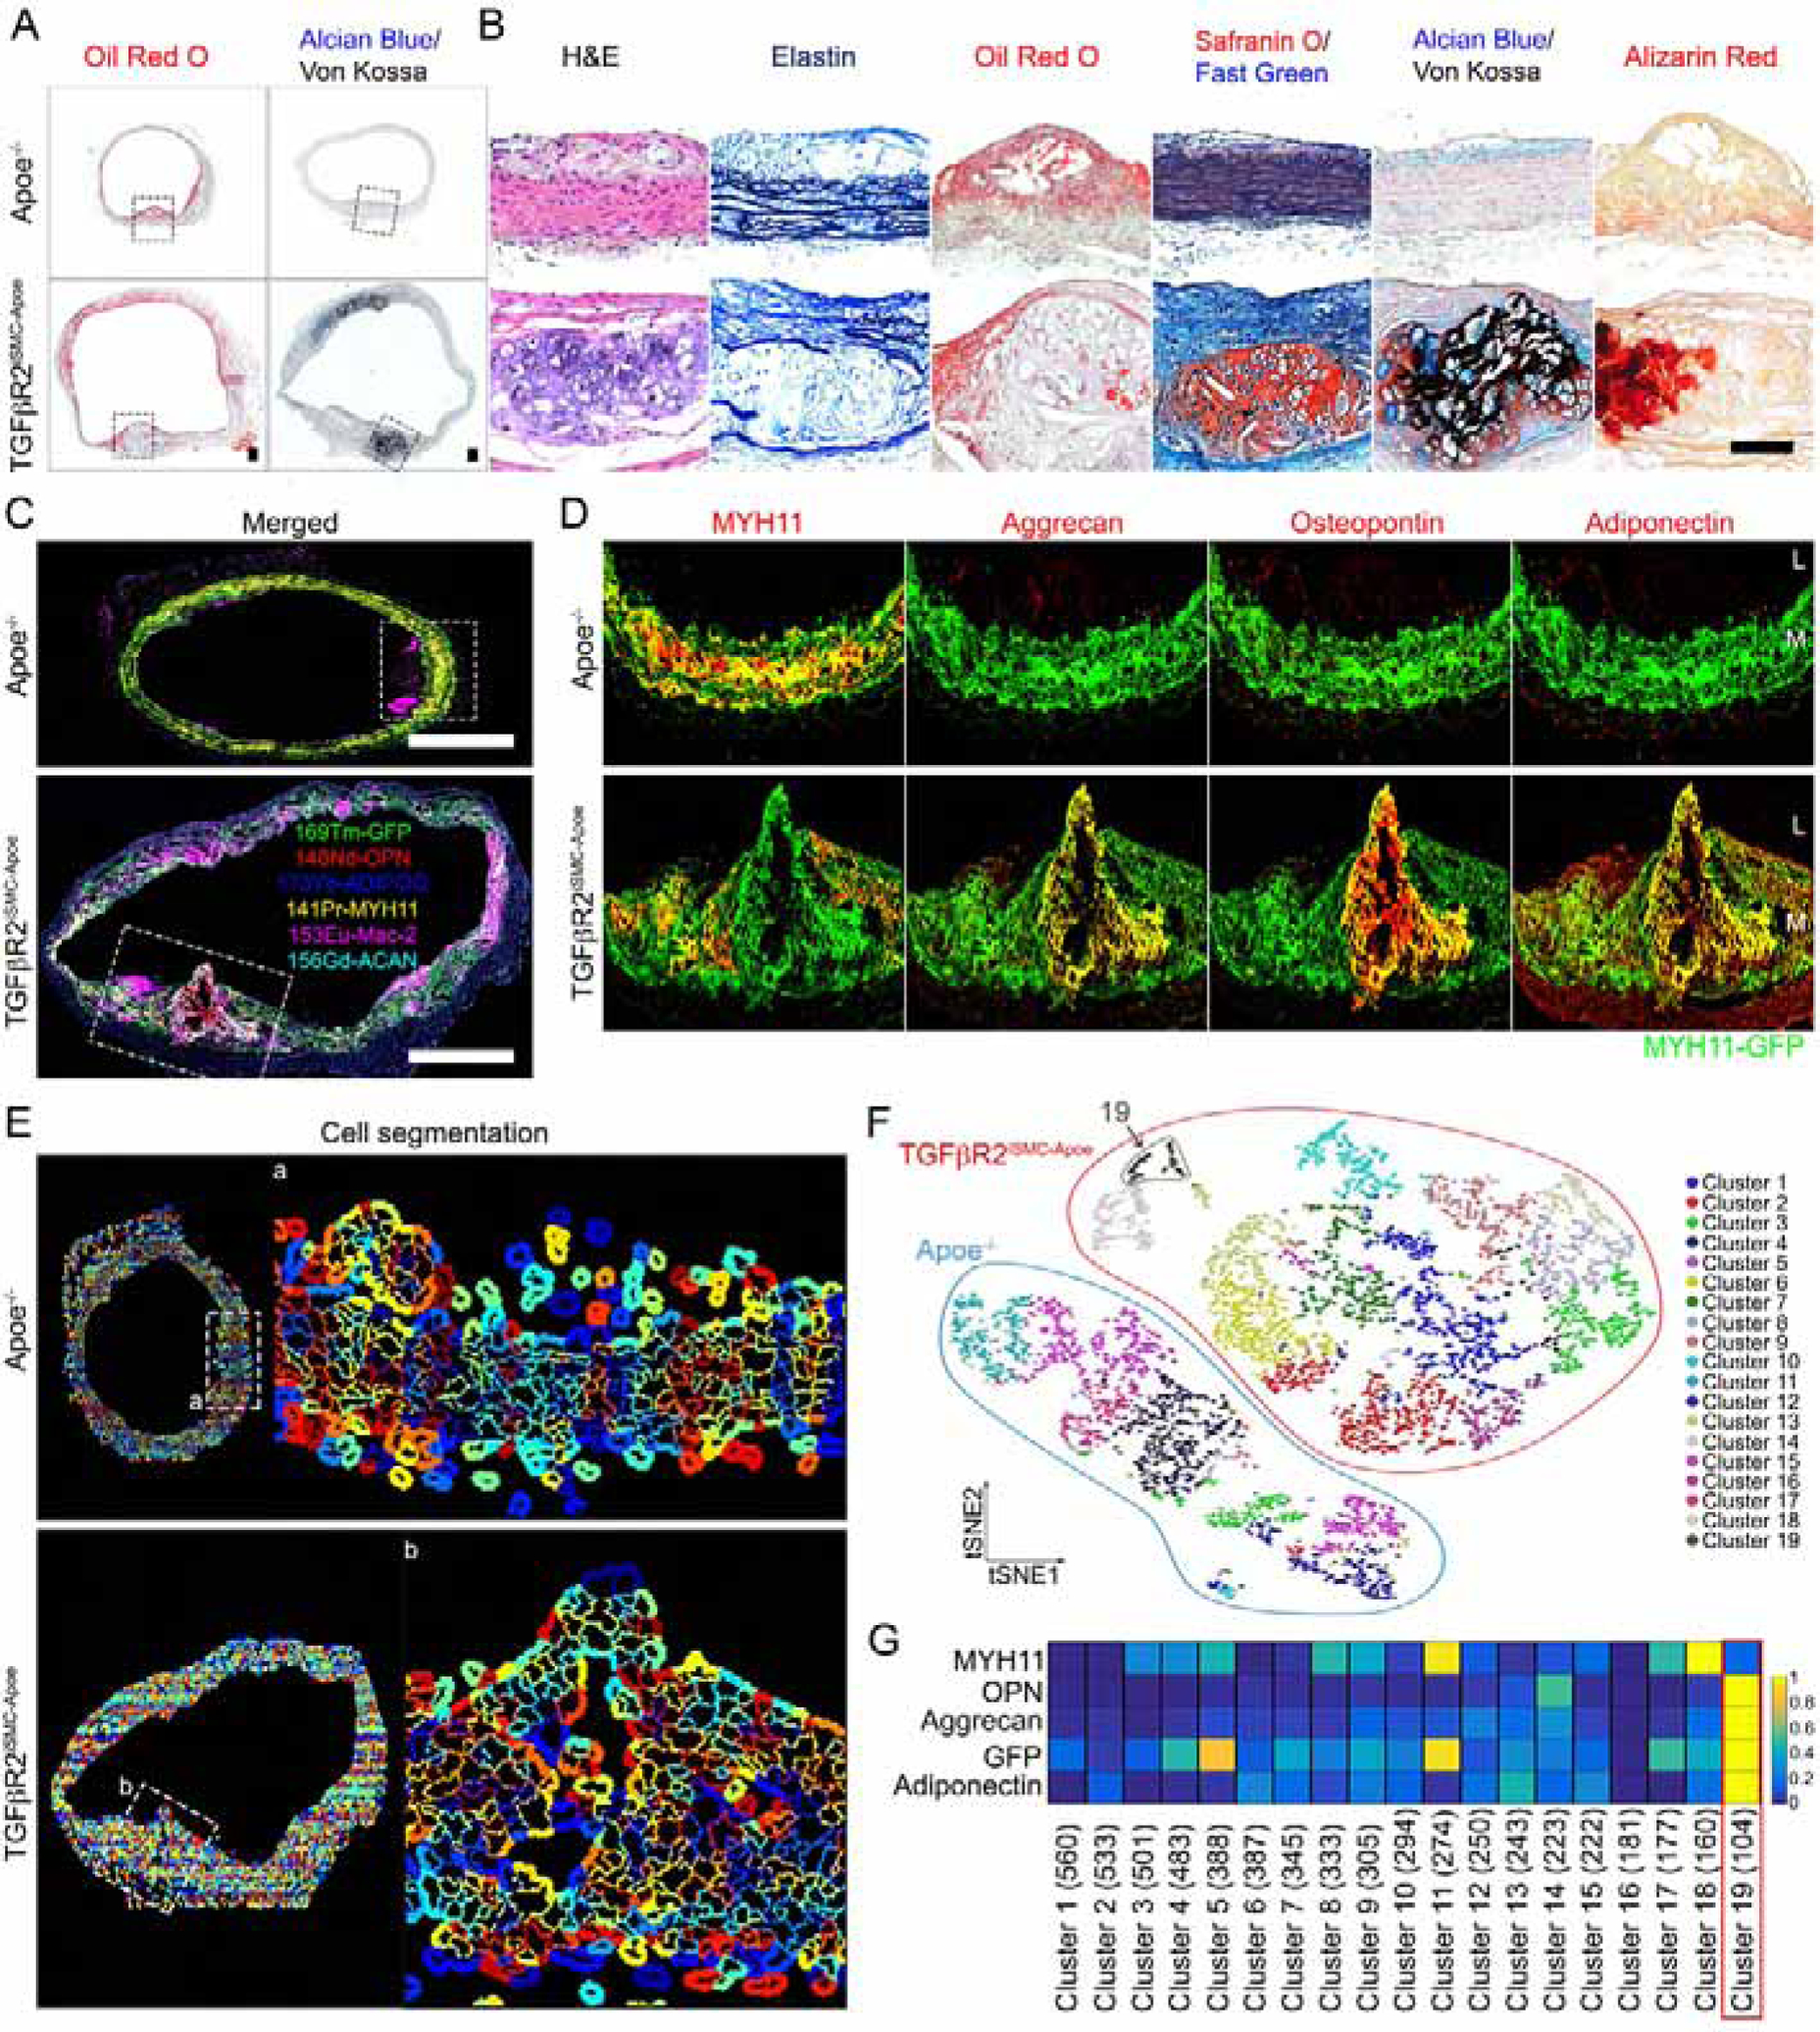
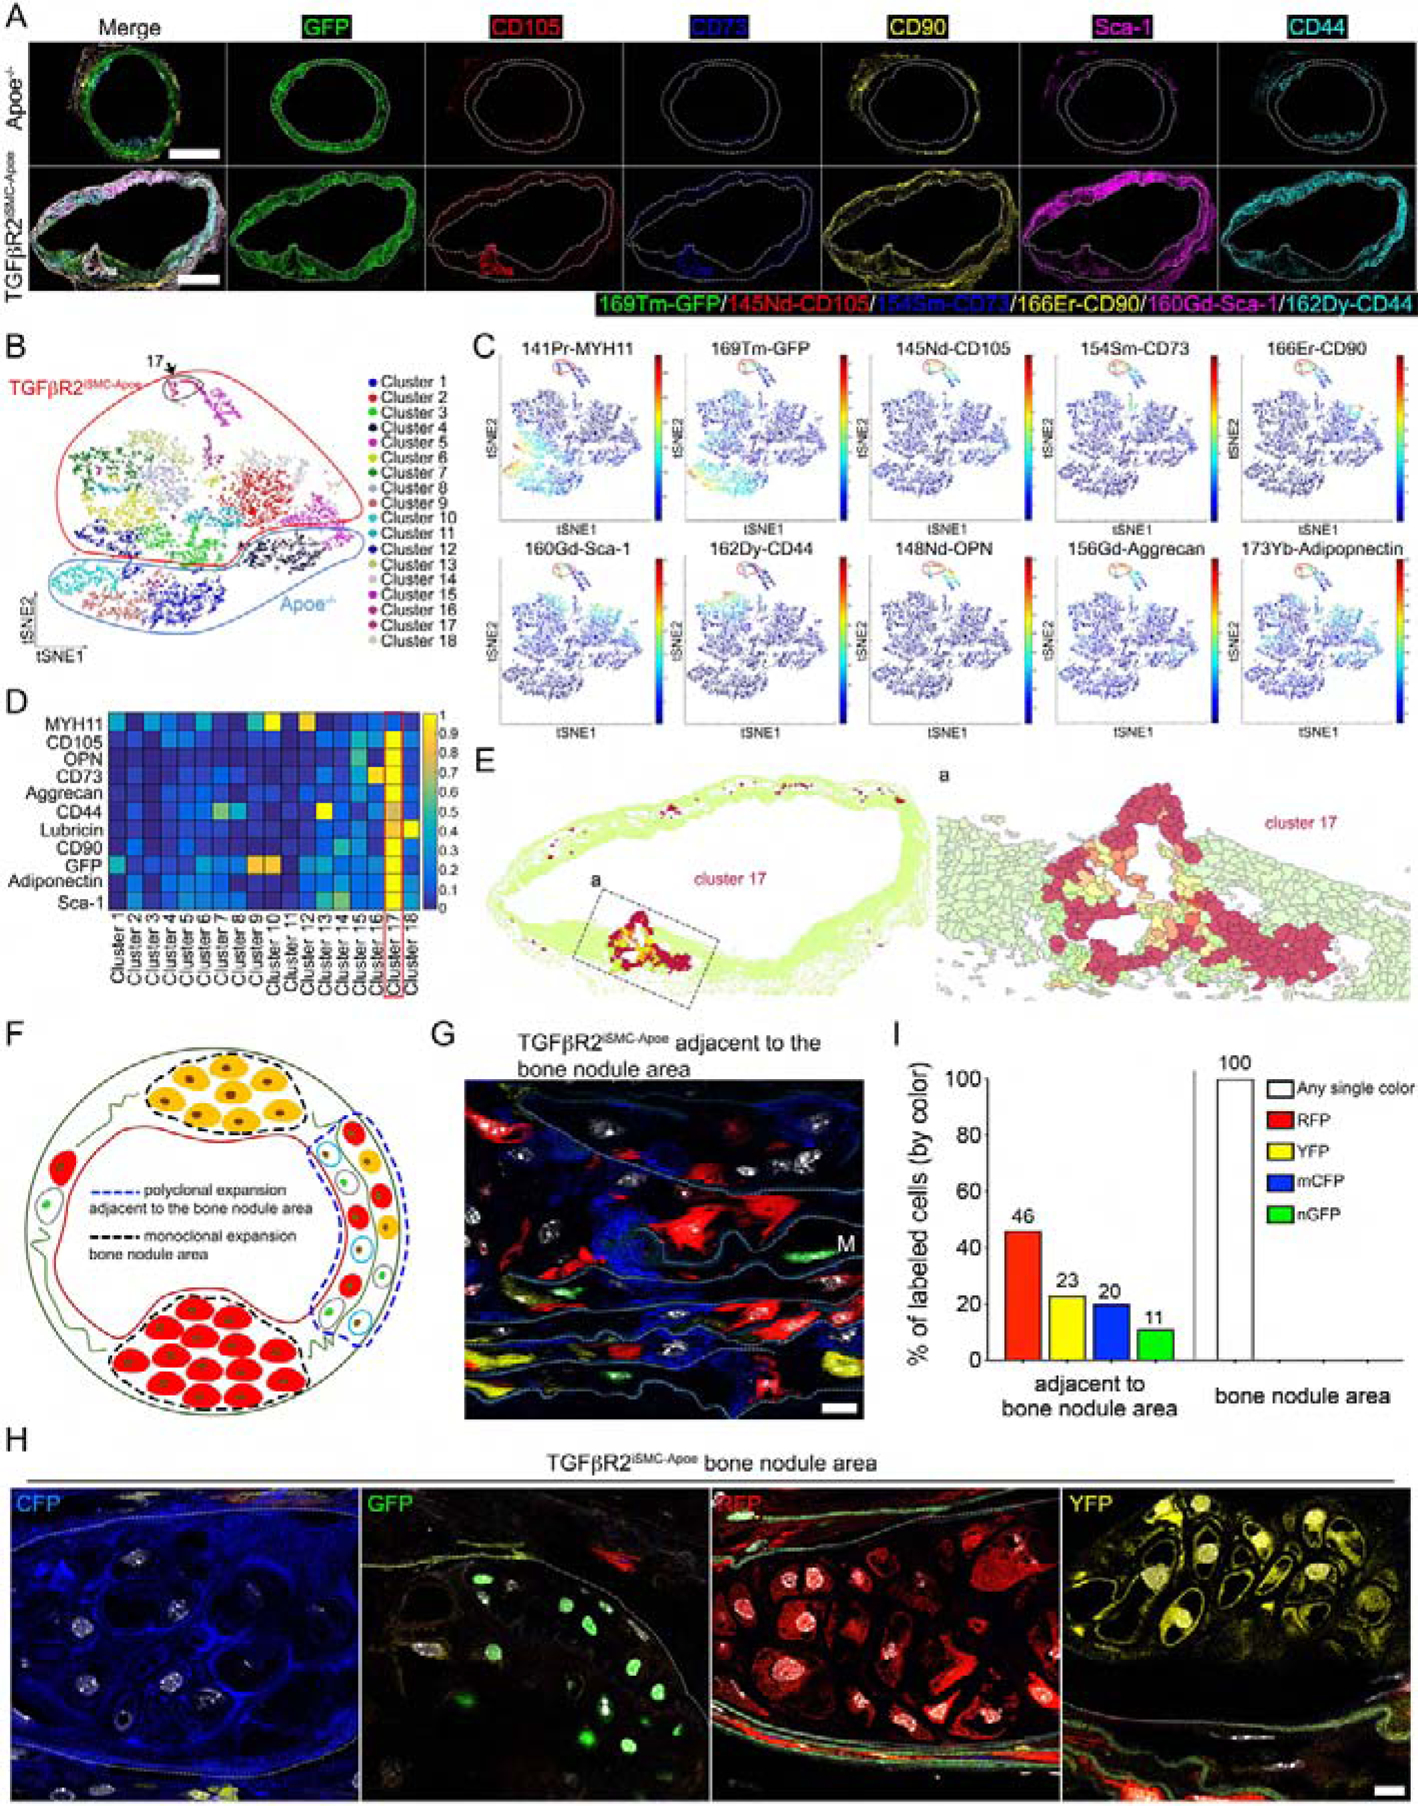
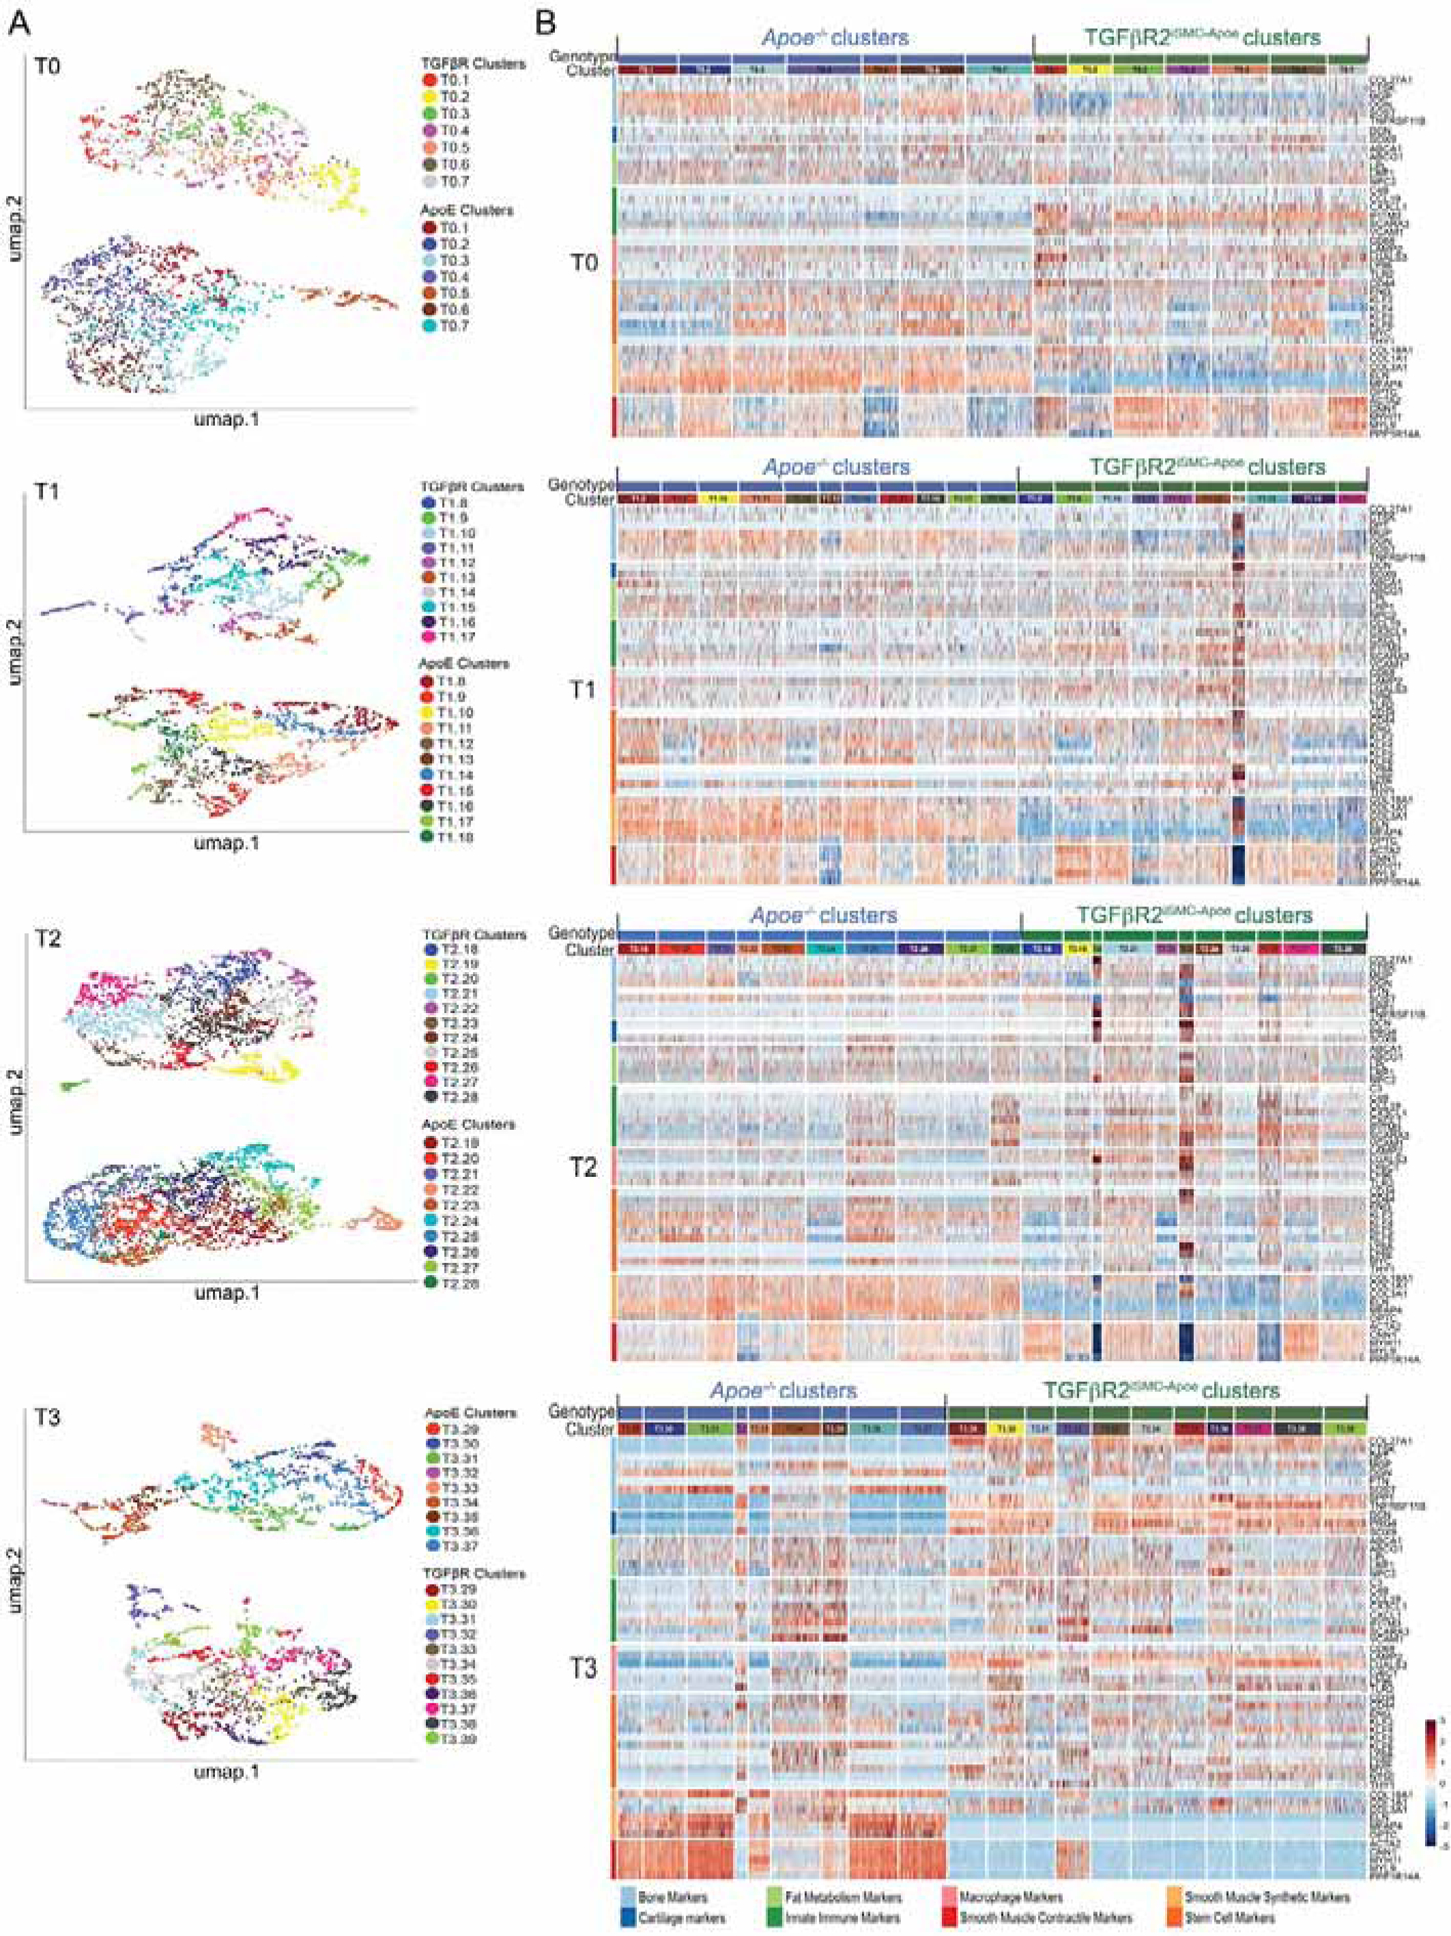
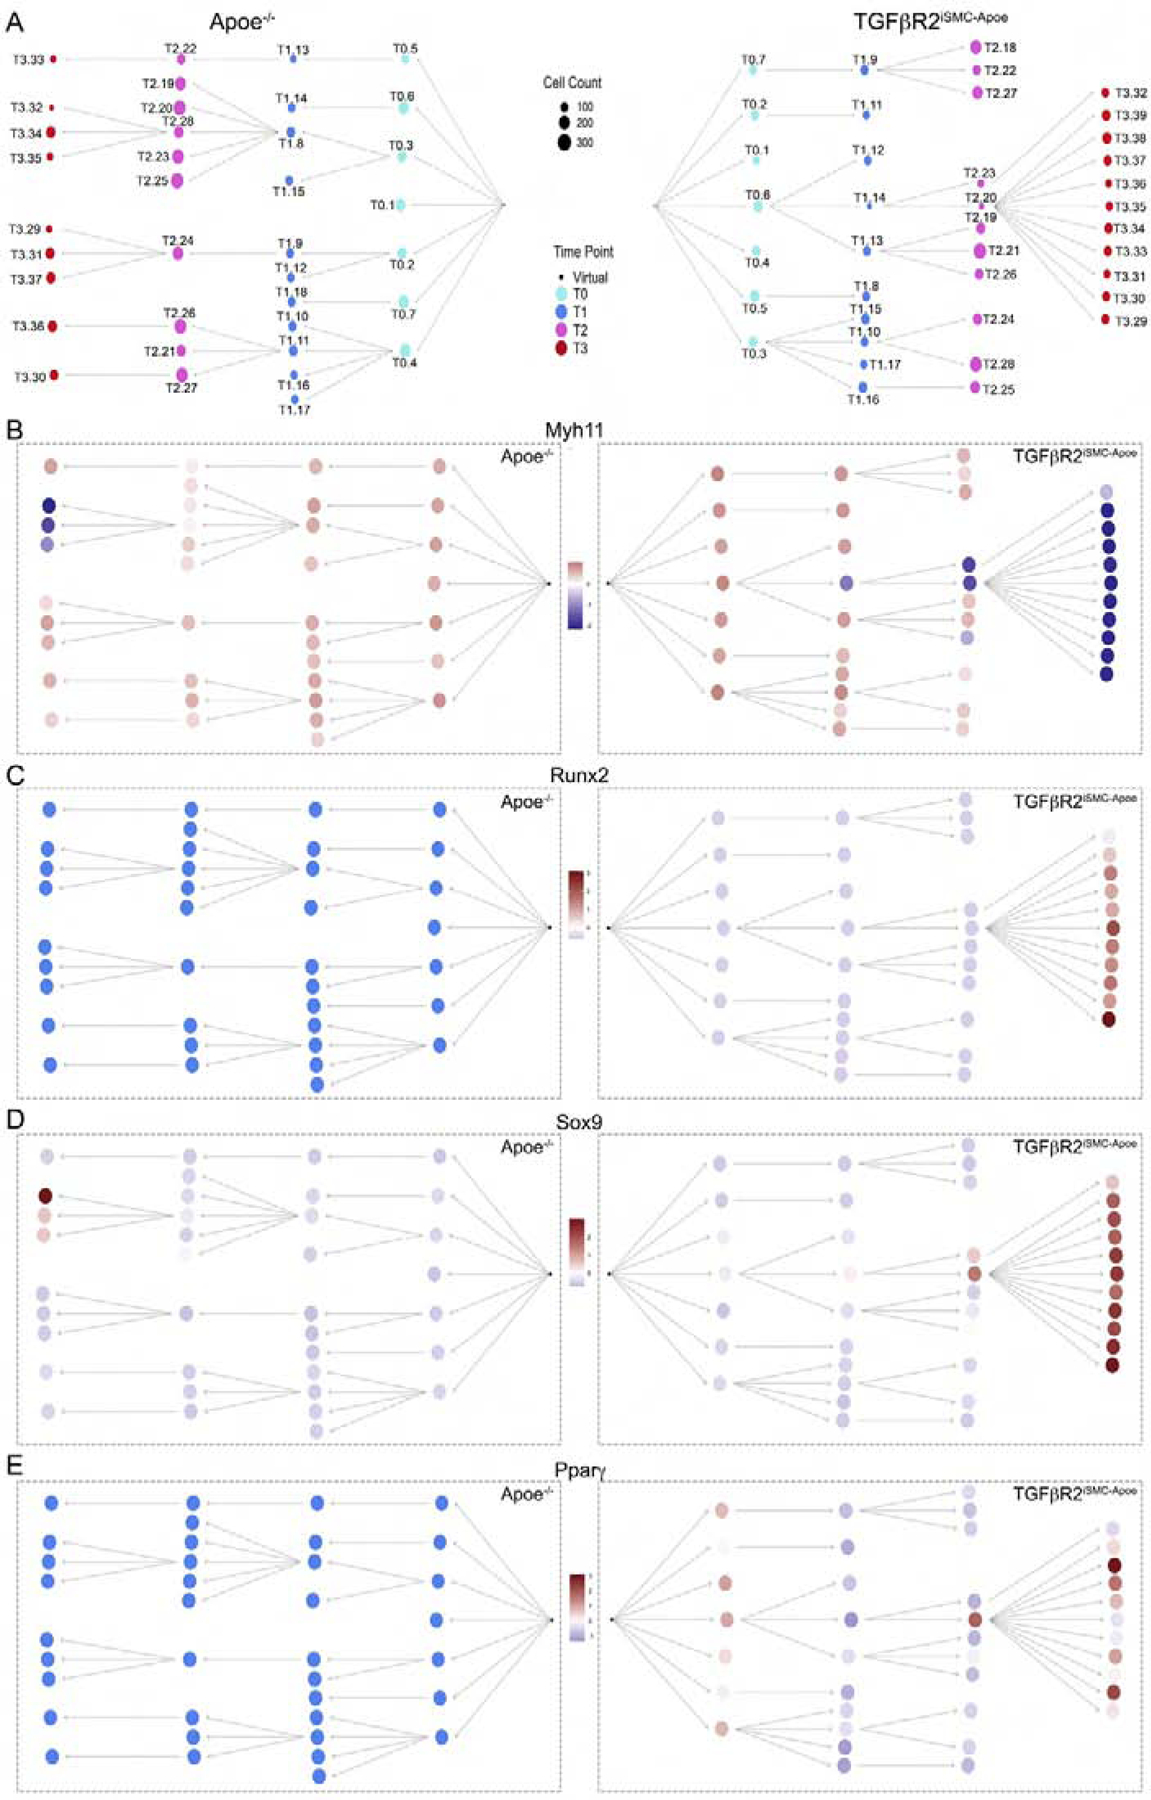
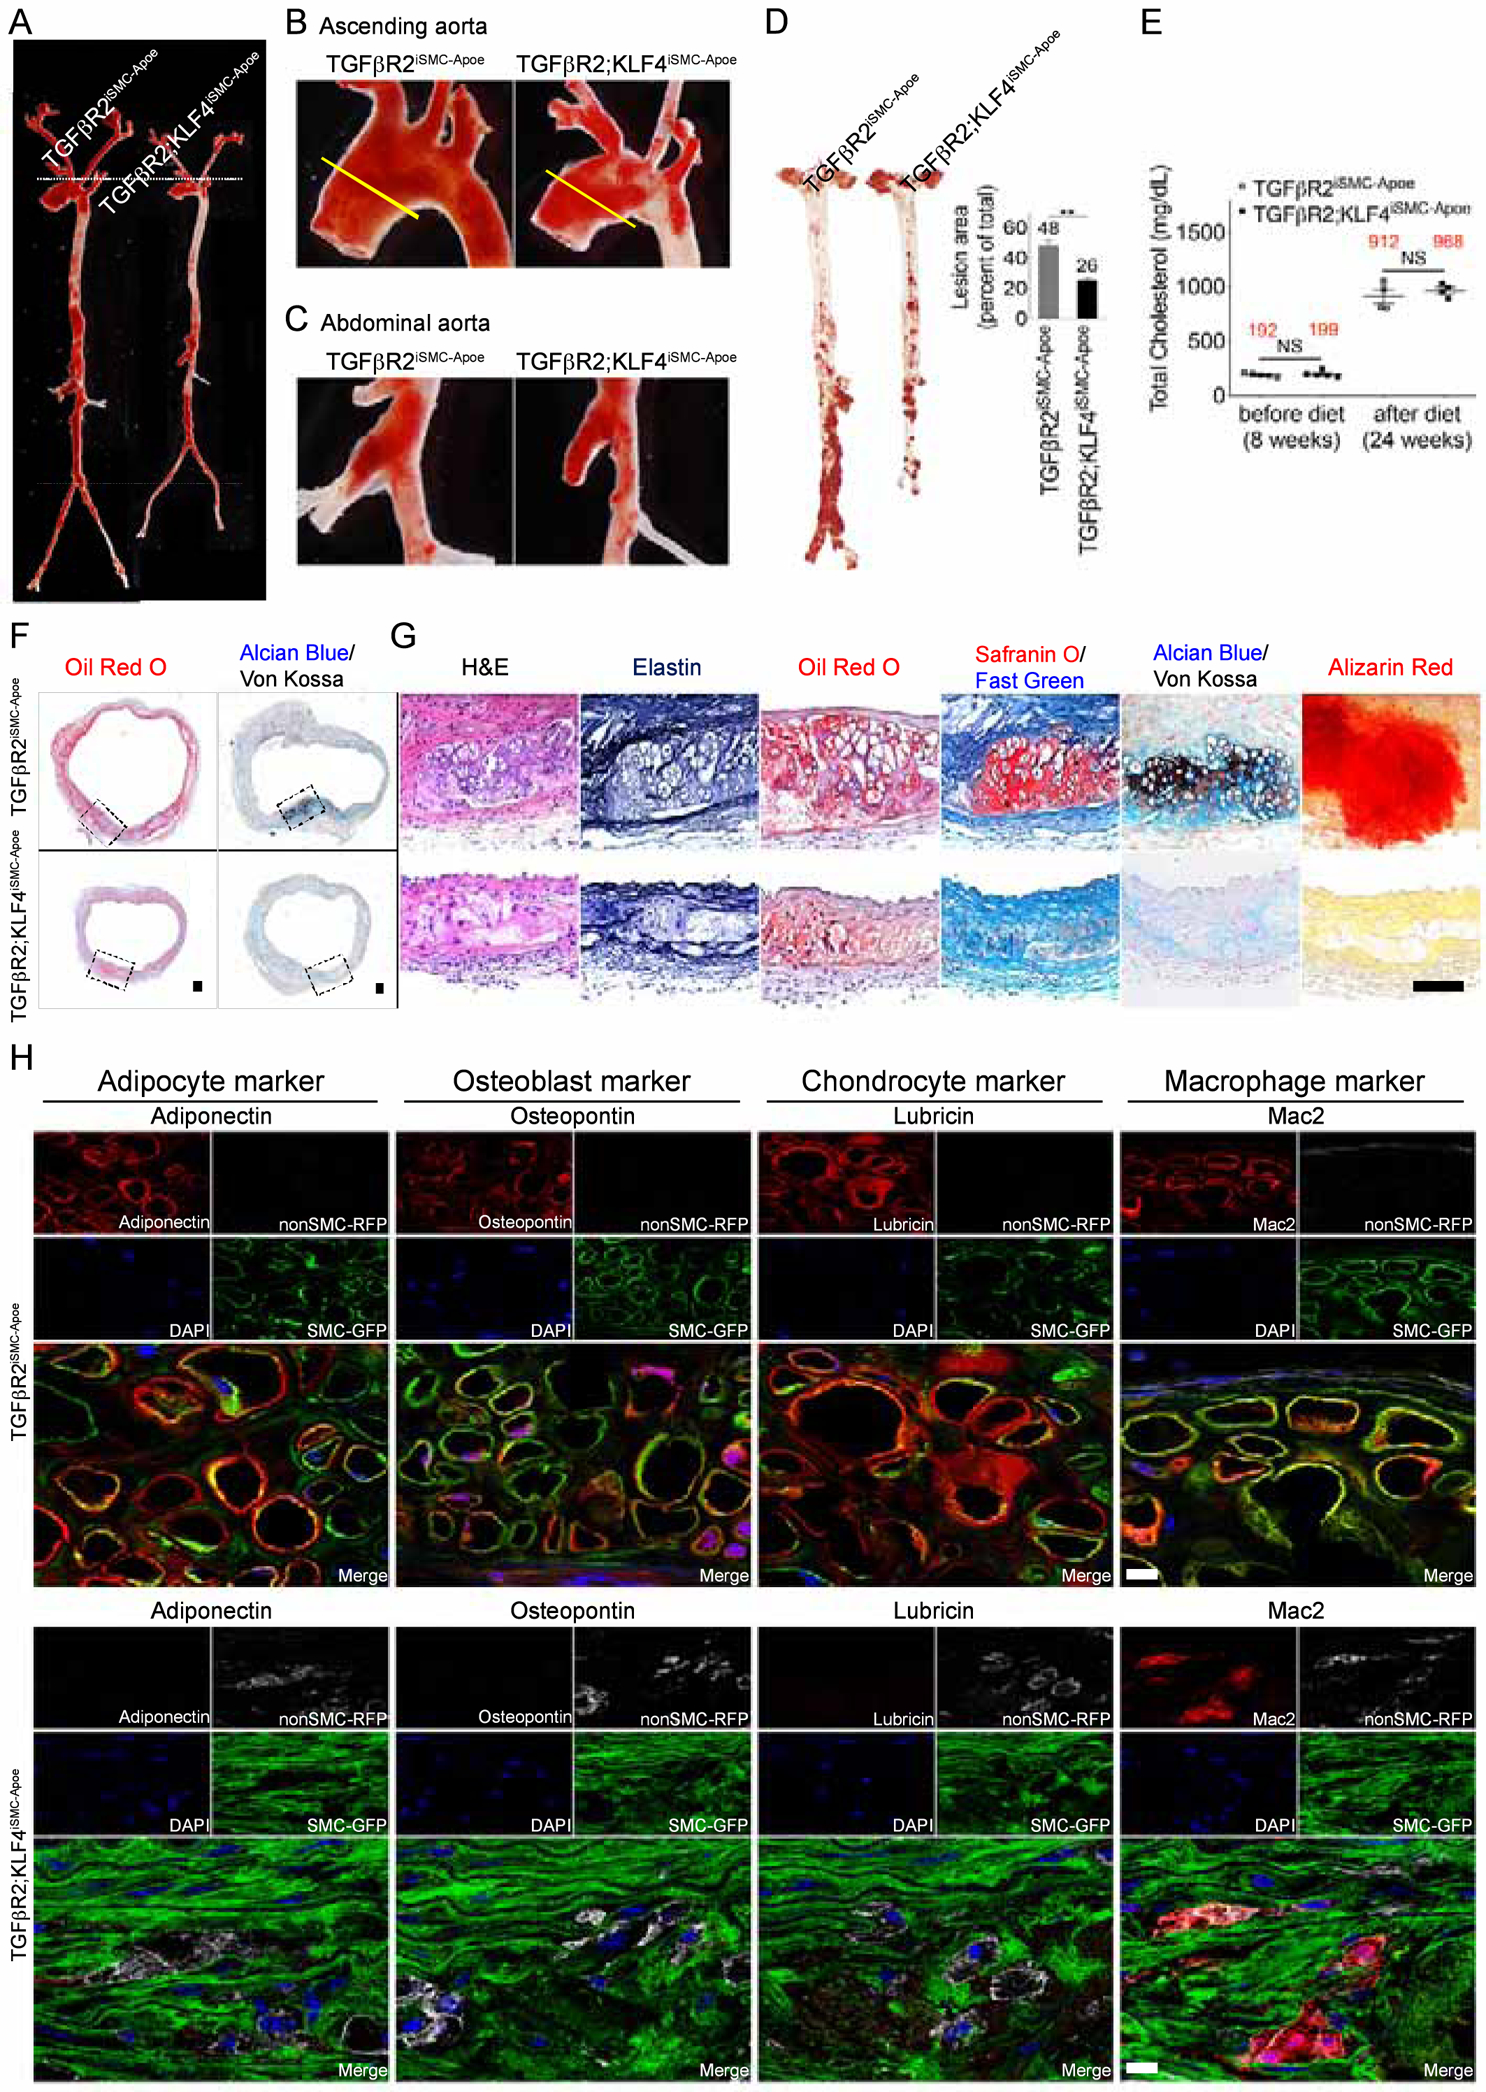
The etiology of aortic aneurysms is poorly understood, but it is associated with atherosclerosis, hypercholesterolemia, and abnormal transforming growth factor β (TGF-β) signaling in smooth muscle. Here, we investigated the interactions between these different factors in aortic aneurysm development and identified a key role for smooth muscle cell (SMC) reprogramming into a mesenchymal stem cell (MSC)-like state. SMC-specific ablation of TGF-β signaling in Apoe-/- mice on a hypercholesterolemic diet led to development of aortic aneurysms exhibiting all the features of human disease, which was associated with transdifferentiation of a subset of contractile SMCs into an MSC-like intermediate state that generated osteoblasts, chondrocytes, adipocytes, and macrophages. This combination of medial SMC loss with marked increases in non-SMC aortic cell mass induced exuberant growth and dilation of the aorta, calcification and ossification of the aortic wall, and inflammation, resulting in aneurysm development.

Keywords: TGF-beta; aneurysm; aorta; artificial intelligence; atherosclerosis; cell fate; cell reprogramming; mesenchymal stem cell; scRNA-seq; smooth muscle cells.


Conflict of interest statement

Declaration of Interests J.M.-L., S.G., and T.W.C. are employees of WuxiNextCode. All other authors declare no competing interests.

Figures

Figure 1:
Figure 1:. Inhibition of smooth muscle cell TGFβ signaling in hypercholesterolemic patients with aortic aneurysms.
(A) Schematic drawings of defined human ascending aorta anatomical regions used for analysis. (B) Representative images of H&E, Elastin, Oil-Red-O, Safranin O, Alcian blue/Von Kossa, Alizarin Red-stained ascending aortas from normal donor and aortic aneurysm patients (Normal donor, N= 6; aneurysm patients, N=6). Scale bar: 50 μm. (C) Bulk RNA-seq analysis of ascending aorta media samples from normal organ donors and patients with ascending aorta aneurysms. (Normal donor, N= 6; aneurysm patients, N=6). Note strong inhibition of TGFβ-related genes and strong induction of inflammation-related genes. (D) (Upper panels) Histological analysis of human ascending aortas with TGFβ signaling (p-Smad2) and inflammation markers (TIMP3, VCAM1, MMP2) from normal donors (N=6) and aneurysm patients (N=6). Nuclei were stained with DAPI (blue). Scale bar: 16 μm. (Lower panels) Quantification of the number of ascending aortic media smooth muscle cells expressing MYH11 (green) and p-Smad2 (red) and inflammation markers (red) (***p<0.001; unpaired two-tailed Student’s t test). See also Figure S7 and Table S1A.
Figure 2:
Figure 2:. Smooth muscle cell Tgfbr2 knockout in Apoe−/− background accelerates aneurysm formation and atherosclerosis plaque development.
(A-C) Representative photomicrographs of Oil-Red-O stained whole aorta (A), aortic arch (B) or abdominal aorta (C) of C57BL/6, TGFβR2iSMC, Apoe−/−, and TGFβR2iSMC-Apoe mice after 4 months of high cholesterol high fat diet (HCHFD). N=4 mice/group. (D) Representative micro-CT images and gross view of aortas of Apoe−/− and TGFβR2iSMC-Apoe mice after 4 months of HCHFD. TGFβR2iSMC-Apoe mice exhibit 100% penetrance of the aneurysm phenotype. (a-b) typical Apoe−/−, (c-d) 90% of TGFβR2iSMC-Apoe, (e-f) 10% of TGFβR2iSMC-Apoe mice aorta (N=3 for Apoe−/− mice; N=4 for TGFβR2iSMC-Apoe mice). Calcium deposits are traced with white color. (E) Representative ultrasound images and ascending aorta diameters (yellow lines) of C57BL/6, TGFβR2iSMC, Apoe−/−, and TGFβR2iSMC-Apoe mice after 4 months of HCHFD. Data are shown as mean ± SEM (***p<0.001; unpaired two-tailed Student’s t test). N=3 mice/group. (F) Microphotographs of en face aortas from C57BL/6, TGFβR2iSMC, Apoe−/−, and TGFβR2iSMC-Apoe mice after 0, 2, 4 months of HCHFD stained with Oil-Red-O. (G) Lesion area quantification: % lesion area refers to Oil-Red-O stained as a % of the total aortic surface. All data shown as mean ± SEM (Ø: not detected; ***p<0.001; unpaired two-tailed Student’s t test) (for each time point N=3 for C57BL/6 mice; N=3 for TGFβR2iSMC mice; N=11 for Apoe−/− mice; and N=11 for TGFβR2iSMC-Apoe mice). See also Figure S1, Figure S2, Figure S3, Table S1B, and Table S1C.
Figure 3:
Figure 3:. Aortic smooth muscle cell reprogramming into osteoblast-, chondrocyte-, adipocyte-, and macrophage-like lineage cells in TGFβR2iSMC-Apoe mice.
(A) Histologic analysis of mouse ascending aortas dissected from 24-week-old Apoe−/− and TGFβR2iSMC-Apoe mice after 4 months of high cholesterol high fat diet (HCHFD). Representative low-magnification images of Oil-Red-O (left) and Alcian Blue (stain mucopolysaccharides sialomucins for cartilage)/Von Kossa (stain calcium for bone) (right) stained mouse ascending aortas. N=6 mice/group. Scale bar: 200 μm. (B) Representative images of H&E, Elastin, Oil-Red-O, Safranin O (cartilage)/Fast Green, Alcian Blue (stain mucopolysaccharides sialomucins for cartilage)/Von Kossa (stain calcium for bone), and Alizarin Red (calcium)-stained mouse ascending aortas from Apoe−/− and TGFβR2iSMC-Apoe mice (N=6 mice/group). Scale bar: 50 μm. (C) Representative IMC images stained for GFP (green), MYH11 (yellow), Aggrecan (cyan), Osteopontin (red), Adiponectin (blue), and Mac-2 (magenta) from Apoe−/− and TGFβR2iSMC-Apoe ascending aorta are shown overlaid (N=6 mice/group). Scale bar: 500 μm. (D) A high-magnification of (C) showing separate channels of GFP (green), MYH11 (red), Aggrecan (red), Osteopontin (red), and Adiponectin (red). (E) Segmentation of individual cell membrane using CellProlifer. (F) The segmentation mask in (E) was used as the basis for analysis of raw data from this IMC experiment. Based on raw data from each of the four input channels, each individual cell was clustered by expression by histoCAT and manually assigned a phenotype. PhenoGraph clustering of all cell phenotype visualized as a distinct color on the tSNE plot. (G) Heatmap visualizing the marker intensity for each Phenograph. See also Figure S3 and Table S2A.
Figure 4:
Figure 4:. Aortic smooth muscle cells reprogramming into mesenchymal stem cells in TGFβR2iSMC-Apoe mice after 4 months of high cholesterol high fat diet.
(A) Representative IMC images stained for GFP (green), CD105 (red), CD73 (blue), CD90 (yellow), Sca-1 (magenta), and CD44 (cyan) in the overlaid format and individual channel images (N=6 mice/group). Scale bar: 500 μm. (B) PhenoGraph clustering of all cell phenotype visualized as a distinct color on the tSNE plot. (C) tSNE plot of high-dimension single cell data. (D) Heatmap visualizing the marker intensity for each Phenograph. (E) (left) Cluster 17 location in the tissue section using HistoCAT spatial clustering analysis. (right) A high-magnification of (Ea) left. (F) A cartoon showing confetti color distribution in bone nodule area and adjacent to the bone nodule area. (G) TGFβR2iSMC-Apoe mice VSMCs adjacent to the bone nodule area are mixed labeled with red fluorescent protein (RFP), yellow fluorescent protein (YFP), nuclear (n) green fluorescent protein (GFP), or membrane associated (m) cyan fluorescent protein (CFP). Scale bar: 10 μm. (H) TGFβR2iSMC-Apoe mice VSMCs in the bone nodule media areas are labeled with single color fluorescent protein after 4 months of high cholesterol high fat diet. Scale bar: 10 μm. (I) Bar chart showing the proportions of each of the Confetti colors in TGFβR2iSMC-Apoe mice VSMCs in media ascending aorta adjacent to the bone nodule area and in bone nodule area. N=10 for TGFβR2iSMC-Apoe mice. See also Figure S4, Figure S5, and Table S2B.
Figure 5:
Figure 5:. Time series analysis of single cell RNA-sequencing data of smooth muscle cells isolated from mouse ascending aorta.
(A) UMAP representation of the scRNA-seq data showing all cell clusters across genotypes: Apoe−/− and TGFβRiSMC-Apoe. Labeled by genotype and specified by the time point: T0 (after 0 month of high cholesterol high fat diet), T1 (after 1 month of high cholesterol high fat diet), T2 (after 2 months of high cholesterol high fat diet), T3 (after 4 months of high cholesterol high fat diet). (B) Heatmap representation of scRNA gene expression for specific cell type markers. Cells are arranged by cell clusters and genotype. Genes are grouped and colored by biomarker class. The colors identifying the biomarker classes are on the left side of the heatmap and the color legend is located at the bottom of the heatmap. See also Methods S1.
Figure 6.
Figure 6.. Putative cell differentiation trajectory networks in Apoe−/− and TGFβR2iSMC-Apoe mice.
(A) Putative cell differentiation trajectory networks based on scRNA gene expression and segregated by genotype. Nodes represent cell clusters. Nodes are colored by time point and their size correspond to cell count. (B) Putative cell differentiation trajectory networks based on scRNA gene expression for Myh11, Runx2, Sox9, and Pparγ. Cell differentiation trajectories graphs designated by genotype, nodes represent cell clusters. Color represents the mean intensity of a winsorized Z-score (at −3 and 3) for each gene across each cell cluster for both genotypes. For each genotype, a virtual node was assumed under the hypothesis that at T0 the cells are already differentiated. The virtual nodes are represented as a black dot, which serves as a root for each branching network. See also Methods S1.
Figure 7.
Figure 7.. KLF4 is the key regulator controlling aortic smooth muscle cells reprogramming into mesenchymal stem cells in TGFβR2iSMC-Apoe mice.
(A-C) Representative photomicrographs of Oil-Red-O stained whole aorta (A), aortic arch (B) or abdominal aorta (C) of TGFβR2iSMC-Apoe and TGFβR2;KLF4iSMC-Apoe mice after 4 months of high cholesterol high fat diet (HCHFD). N=4 mice/group. (D) (left) Microphotographs of en face aortas from TGFβR2iSMC-Apoe and TGFβR2;KLF4iSMC-Apoe mice after 4 months of HCHFD stained with Oil-Red-O. (right) Lesion area quantification: % lesion area refers to Oil-Red-O stained as a % of the total aortic surface. All data shown as mean ± SEM (**p<0.01; unpaired two-tailed Student’s t test). N=10 mice/group. (E) Total cholesterol levels from TGFβR2iSMC-Apoe and TGFβR2;KLF4iSMC-Apoe mice after 4 months on a HCHFD (NS: not significant; unpaired two-tailed Student’s t test). N=5 for TGFβR2iSMC-Apoe mice; N=4 for TGFβR2;KLF4iSMC-Apoe mice. (F) Histologic analysis of mouse ascending aortas dissected from 24-week-old TGFβR2iSMC-Apoe and TGFβR2;KLF4iSMC-Apoe mice after 4 months of high cholesterol high fat diet (HCHFD). Representative low-magnification images of Oil-Red-O (left) and Alcian Blue (stain mucopolysaccharides sialomucins for cartilage)/Von Kossa (stain calcium for bone) (right) stained mouse ascending aortas. N=6 mice/group. Scale bar: 200 μm. (G) Representative images of H&E, Elastin, Oil-Red-O, Safranin O (cartilage)/Fast Green, Alcian Blue (stain mucopolysaccharides sialomucins for cartilage)/Von Kossa (stain calcium for bone), and Alizarin Red (calcium)-stained mouse ascending aortas from TGFβR2iSMC-Apoe and TGFβR2;KLF4iSMC-Apoe mice (N=6 mice/group). Scale bar: 50 μm. (H) Immunohistochemical staining of lineage-specific markers (Adipocyte, Osteoblast, Chondrocyte, Macrophage) in the ascending aortas of TGFβR2iSMC-Apoe and TGFβR2;KLF4iSMC-Apoe mice after 4 months of high cholesterol high fat diet using SP8 confocal microscope (N=6 mice/group). Scale bar: 10 μm. See also Figure S6.

References

    1. Amir el AD, Davis KL, Tadmor MD, Simonds EF, Levine JH, Bendall SC, Shenfeld DK, Krishnaswamy S, Nolan GP, and Pe’er D (2013). viSNE enables visualization of high dimensional single-cell data and reveals phenotypic heterogeneity of leukemia. Nature biotechnology 31, 545–552. - PMC - PubMed
    1. Angelov SN, Hu JH, Wei H, Airhart N, Shi M, and Dichek DA (2017). TGF-beta (Transforming Growth Factor-beta) Signaling Protects the Thoracic and Abdominal Aorta From Angiotensin II-Induced Pathology by Distinct Mechanisms. Arterioscler Thromb Vasc Biol 37, 2102–2113. - PMC - PubMed
    1. Baek S, Gleason RL, Rjagopal KR, and Humphrey JD (2007). Theory of small on large: Potential utility in computations of fluid–solid interactions in arteries. Comput Methods Appl Mech Eng 196, 3070–3078.
    1. Bersi MR, Khosravi R, Wujciak AJ, Harrison DG, and Humphrey JD (2017). Differential cell-matrix mechanoadaptations and inflammation drive regional propensities to aortic fibrosis, aneurysm or dissection in hypertension. Journal of the Royal Society, Interface / the Royal Society 14. - PMC - PubMed
    1. Chen P-Y, Qin L, Li G, Wang Z, Dahlman JE, Malagon-Lopez J, Gujja S, Cilfone NA, Kauffman KJ, Sun L, et al. (2019). Endothelial TGF-beta signaling drives vascular inflammation and atherosclerosis Nature Metabolism (in press). - PMC - PubMed

Publication types

Substances