Review
. 2020 Jun 3;28(6):1392-1416.
doi: 10.1016/j.ymthe.2020.03.016. Epub 2020 Mar 20.

Non-invasive Reporter Gene Imaging of Cell Therapies, including T Cells and Stem Cells

Affiliations
Review

Non-invasive Reporter Gene Imaging of Cell Therapies, including T Cells and Stem Cells

Candice Ashmore-Harris et al. Mol Ther. .

Abstract

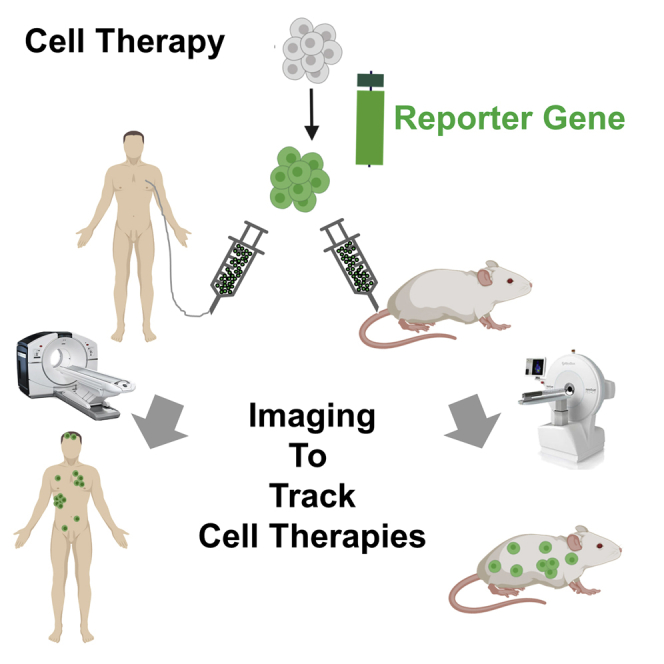
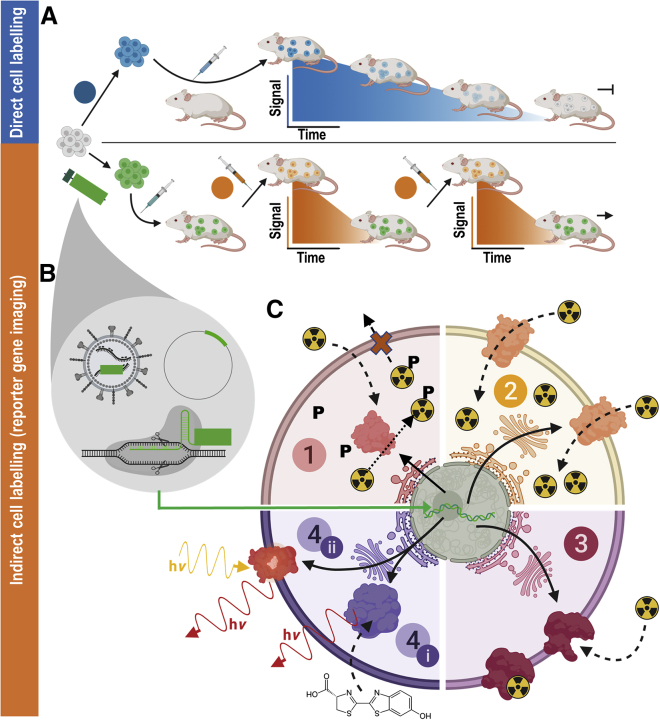
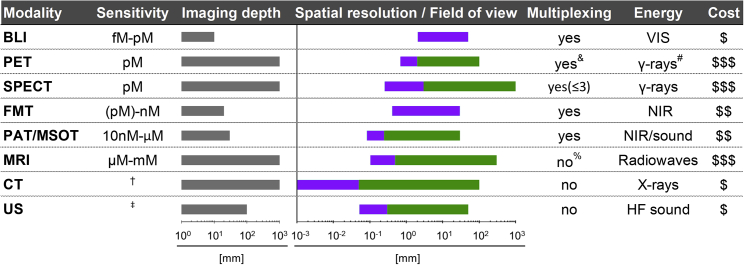
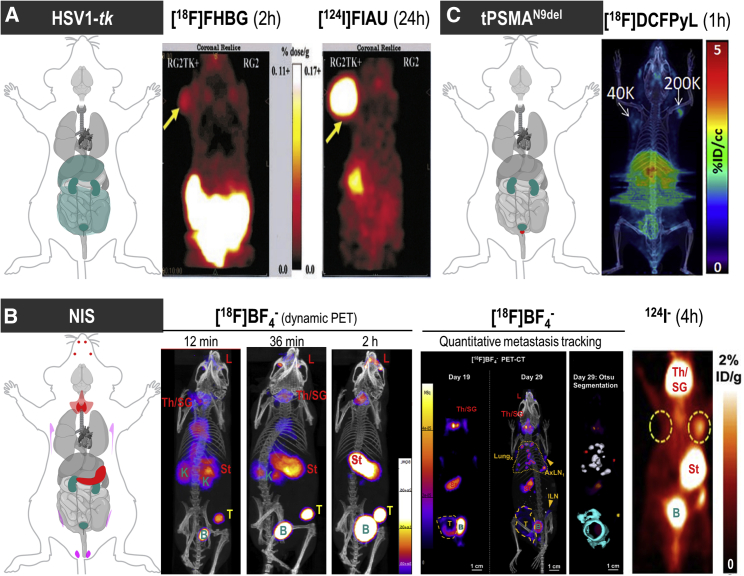
Cell therapies represent a rapidly emerging class of new therapeutics. They are intended and developed for the treatment of some of the most prevalent human diseases, including cancer, diabetes, and for regenerative medicine. Currently, they are largely developed without precise assessment of their in vivo distribution, efficacy, or survival either clinically or preclinically. However, it would be highly beneficial for both preclinical cell therapy development and subsequent clinical use to assess these parameters in situ to enable enhancements in efficacy, applicability, and safety. Molecular imaging can be exploited to track cells non-invasively on the whole-body level and can enable monitoring for prolonged periods in a manner compatible with rapidly expanding cell types. In this review, we explain how in vivo imaging can aid the development and clinical translation of cell-based therapeutics. We describe the underlying principles governing non-invasive in vivo long-term cell tracking in the preclinical and clinical settings, including available imaging technologies, reporter genes, and imaging agents as well as pitfalls related to experimental design. Our emphasis is on adoptively transferred T cell and stem cell therapies.

Keywords: adoptive cell therapy; cell tracking; immunotherapy; molecular imaging; prostate-specific membrane antigen; sodium iodide symporter.


Figures

None
Graphical abstract
Figure 1
Figure 1
In Vivo Cell Tracking Using Reporter Genes (A) (Blue) Direct cell labeling employs ex vivo-labeled cells that are administered to animals and can be tracked until cells lose their labels (depicted using blue signal versus time cartoon plots), e.g., through label efflux, via label dilution in fast-growing cells, or radioisotope decay if radiotracers are used. (B) (Orange) Indirect cell labeling requires cells that have been genetically manipulated to express a reporter gene (green). The genetic engineering options frequently employed in reporter gene applications include viruses (e.g., lentiviruses, γ-retroviruses), gene editing, or episomal plasmids (see cartoons within gray drop). The cells are imaged using the features of the reporter gene, which renders the cells traceable in vivo. Cells are detected in vivo through molecular probe administration (depicted using orange signal versus time cartoon plots); if radiotracers are used, their half-life is short to enable short repeat-imaging intervals and keep administered doses low. Reporter gene imaging does not suffer from label dilution in fast-growing cells and hence permits much longer, theoretically indefinite observation times. (C) Molecular imaging mechanisms of frequently used reporter genes. (1) Enzymes entrapping molecular probes (light red): these reporter enzymes entrap a substrate that is already detectable by imaging. A frequent mechanism for this entrapment relies on phosphorylation of a substrate that has either actively or passively entered the cell, and upon phosphorylation can no longer leave the cell. Examples are nucleoside kinases such as HSV1-tk. (2) Transporter proteins (yellow): these reporters are expressed at the plasma membrane of cells, and each expressed reporter can transport several labeling agent molecules into the cell, which constitutes a signal amplification mechanism. The radionuclide transporters NIS and NET belong to this class of reporters. (3) Cell surface molecules (pink): these reporters are expressed at the plasma membrane of cells, and molecular probes bind directly to them; minor levels of signal amplification are theoretically possible if several labels bind directly to each reporter protein, or if several labels could be fused to a reporter binding molecule; however, signal amplification is inferior compared to transporters, and often they are used with a 1:1 stoichiometry. Examples for this reporter class are tPSMAN9Del and SSTR2. (4) Signal generating proteins (purple). (i) Enzyme-based reporters bind to their substrate and catalyze the production of a detectable signal. Examples are luciferases, which convert an externally supplied chemical substrate into detectable light (hν). (ii) Fluorescent proteins contain an intrinsic fluorescence-generating moiety if appropriately excited by light. Fluorophore excitation results in emission of detectable longer wavelength/red-shifted light. For details and literature references to relevant reporter genes, see Tables 1 and 2. The figure was generated using Biorender.com.
Figure 2
Figure 2
Properties of Various Whole-Body Imaging Modalities Imaging modalities are ordered according to their molecular detection sensitivities with achievable imaging depth shown in gray alongside. Achievable spatial resolution (left end) and fields of view (right end) are shown in cyan/green. Where bars are green, they overlay purple bars and indicate the same parameters but achievable with instruments available for clinical imaging. Instrument cost estimations are classified as follows: $, <$130,000; $$, $130,000–$300,000; $$$, >$300,000. Contrast agents sometimes used to obtain different anatomical/functional information. Sensitivity is highly dependent on contrast-forming features/contrast agent. A new mammalian reporter gene for US imaging was recently reported to detect a minimum of 135 gas vesicles per voxel with dimensions of 100 μm.&Dual-isotope PET is feasible but not routinely in use; it requires two tracers, one with a positron emitter (e.g., 18F, 89Zr) and the other with a positron-gamma emitter (e.g., 124I, 76Br, 86Y), and is based on recent reconstruction algorithms to differentiate the two isotopes based on the prompt-gamma emission., , %Multichannel MRI imaging has been shown to be feasible but is not routinely available. #Generated by positron annihilation (511 keV). BLI, bioluminescence imaging; PET, positron emission tomography; SPECT, single-photon emission computed tomography; FMT, fluorescence molecular tomography; PAT/MSOT, photoacoustic tomography/multispectral optoacoustic tomography; MRI, magnetic resonance imaging; NIR, near-infrared; VIS, visible; HF, high-frequency; CT, computed tomography.
Figure 3
Figure 3
Background Considerations for Foreign and Host Radionuclide Reporters (A) HSV1-tk as an example of a foreign reporter is not expressed endogenously in healthy mammals. However, this does not mean that the radiotracer to detect HSV1-tk-expressing cells is excluded from background uptake in other mammalian cells/organs or from generating signals during excretion (dark cyan in cartoon). Moreover, it is fundamental for radionuclide imaging that a contrast between background signal and signal arising from reporter-expressing cells (by one of the molecular imaging mechanisms [Figure 1C]) is generated through tissue clearance of radiotracer molecules. Radiotracers can thus affect background differently across different organs as shown here for two different PET radiotracers for HSV1-tk. Images are reproduced from a study comparing HSV1-tk radiotracer performance, with yellow arrows pointing toward the regions of interest in this study (tumors). Here, the other anatomical sites showing signals are of note (hepatobiliary and renal excretion for [18F]FHBG and uptake into the stomach for [124I]FIAU). (B) NIS is an example of a host reporter and consequently is expressed endogenously in some organs; NIS is highly expressed in the thyroid and stomach (red), precluding cell tracking from these organs, and at low levels in testes (♂, pink), mammary (♀, pink), and salivary and lacrimal glands (light red). Images shown are from three different studies using varying PET radiotracers for NIS. (B) Left: image demonstrates how [18F]BF4in vivo distribution changes over time (female mouse with mammary tumor indicated by a yellow “T”; for details, Diocou et al.127). (B) Middle: images shown demonstrate metastasis tracking over time and exquisite resolution and sensitivity of NIS-PET imaging for metastasis tracking. They also demonstrate the necrotic tumor core, which is not imaged by NIS due to its favorable dependence on cellular energy for function, thereby reflecting cell viability. An example of Otsu image segmentation is shown to the right, which is the basis for quantitation (for details, see Volpe et al.33). Further annotations are endogenous signals from thyroid and salivary glands (Th/SG), stomach (St), and lacrimal glands (L). (B) Right: this image is reproduced from a study elucidating the detection sensitivity of reporter-expressing engineered primary T cells with annotations the same as in the middle images. In both cases radiotracer excretion also leads to signals, in the case of these NIS tracers only from the renal excretion system (K, kidneys, B, bladder). (C) CAR-Ts were engineered to express the tPSMAN9del reporter and administered to NSG mice at the indicated numbers (in 50 μL of 50% Matrigel; white arrows). Imaging with the radiotracer [18F]DCFPyL resulted in CAR-T detection. Notably, images are not free of background despite PSMA endogenous expression limited to the prostate (red area in cartoon). This is because radiotracer clearance was incomplete at the point of imaging. To improve the display contrast of the in vivo images, the authors masked relatively high renal radiotracer uptake using a thresholding method. For experimental details, see Minn et al. [All data images in this figure are reproduced with minor modifications from the publications mentioned in the legend, with permission from corresponding publishers.]
Figure 4
Figure 4
Recognition of Reporter Antigens by the Immune System The intact mammalian immune system operates several mechanisms to recognize cells expressing non-self (i.e., non-host) proteins. As one simplified example, we show here the recognition of antigen-presenting MHC class I molecules on antigen-presenting cells (APCs) by cytotoxic T cells (CD8+Ts). Host cells (far left column, black dots representing presented host antigens) are not recognized by CD8+Ts, as they are pre-coded to not target self. In contrast, non-self MHC class I molecules on foreign cells (far right column) are recognized by CD8+Ts, resulting in destruction of the foreign cells. If host cells express host reporters (center left column, green), corresponding host antigens (green dots) can be presented on MHC class I molecules, and as they are representing self CD8+Ts take no action when they encounter these cells. If foreign reporters are expressed (center right column), self MHC class I molecules present non-self/foreign antigens (red dots), resulting in CD8+T action and killing of the corresponding host cell due to the presence of the foreign reporter. The figure was generated using Biorender.com.
Figure 5
Figure 5
Examples of Foreign and Host Reporters for T Cell Tracking (A) Proof-of-principle study demonstrating non-invasive imaging of T cell activation by NFAT-driven expression of the reporters HSV1-tk and GFP (TKGFP) with [124I]FIAU as a PET radiotracer for HSV1-tk. Photographic image of a typical mouse bearing different subcutaneous infiltrates (middle panel); transaxial PET images of TKGFP expression in a mouse treated with control antibody (left panels) and T cell-activating anti-CD3/CD28 antibodies (right panels) were obtained at the levels indicated by the dashed lines of the middle panel. Samples are the Jurkat/dcmNFATtgn clones 3 and 4 (two similar clones), wild-type Jurkat infiltrates (no reporter control), and Jurkat/TKGFP (constitutive reporter expression as positive control). Gray inset plots show fluorescence-activated cell sorting (FACS) profiles for reporter expression (TKGFP) versus a T cell activation marker (CD69) from a tissue sample obtained from the same Jurkat/dcmNFATtgn clone 4 infiltrate that was imaged with PET above. (B) [18F]FHBG PET was performed in a 60-year-old male with multifocal left hemispheric glioma, who received cytotoxic T lymphocytes into the medial left frontal lobe tumor (yellow arrows). Tumor size was monitored by T1-weighted contrast-enhanced MRI (left panels). [18F]FHBG PET to detect HSV1-tk was recorded and images were fused with MR images (right panels), and 3D volumes of interest were drawn using a 50% [18F]FHBG maximum standardized uptake value (SUVmax) threshold, outlined in red. Top row: Images and voxel-wise analysis of [18F]FHBG total radioactivity prior to CTL infusion and (bottom row) 1 week after CTL infusion. (C) Longitudinal imaging CAR-T tracking study demonstrating that the number of CD19-tPSMAN9del CAR-T cells in the peripheral blood and the bone marrow does not correlate with the total number of the CD19-tPSMAN9del CAR-Ts localized to the tumors. Left: PET/CT and BLI images of five different mice. Days are marked from the day of CAR-T infusion. Mice were imaged on a SuperArgus small-animal PET/CT 1 h after administration of 14.8 MBq of [18F]DCFPyL. Images alternate between fLuc-tagged bioluminescence (BLI, radiance) for visualization of tumor cells and PET/CT for CAR-Ts, with each mouse undergoing both imaging studies. Arrows designate accumulation of CAR-Ts. To improve the display contrast of the in vivo images, the relatively high renal radiotracer uptake was masked using a thresholding method. Images are scaled to the same maximum value within each modality. Right: Quantified numbers of the CD19-tPSMAN9del CAR-Ts in the region of interest drawn to cover the entire tumor area were plotted with the percentage number of PSMA+/CAR+ cell populations in the peripheral blood (PPB) and the bone marrow (BM). Each data point (M) represents each mouse. For details, see Minn et al. [Figure modified from publications cited above with permissions obtained.]
Figure 6
Figure 6
Example of Reporter Gene Integration to Enable Non-invasive Monitoring of Stem Cell-Mediated Teratoma Formation by In Vivo Imaging Human ESCs were lentivirally modified to express the HSV1-tk radionuclide reporter gene fused to enhanced GFP, and 2–5 × 106 reporter expressing hESCs were injected intramuscularly and tracked in vivo by whole-body SPECT/CT imaging. Yellow arrows/rings indicate tumors. (A and B) Representative planar (A) γ and (B) SPECT/CT images of tumors derived in an animal scanned 87 days after tumor inoculation (when a palpable tumor was detected). The radiotracer [125I]FIAU was intravenously (i.v.) administered and the animal was scanned 24 h later. (C) Longitudinal SPECT/CT imaging of a different SCID (severe combined immunodeficiency)-beige mouse harboring a teratoma from reporter-expressing hESCs. This mouse was serially imaged at the indicated time points post inoculation. All data were quantitatively analyzed in the study. For details the reader is referred to the original work. [Figure reproduced with minor modification from the cited work.]

References

    1. Caplan A.I. Mesenchymal stem cells: time to change the name! Stem Cells Transl. Med. 2017;6:1445–1451. - PMC - PubMed
    1. Heathman T.R., Nienow A.W., McCall M.J., Coopman K., Kara B., Hewitt C.J. The translation of cell-based therapies: clinical landscape and manufacturing challenges. Regen. Med. 2015;10:49–64. - PubMed
    1. BioInformant . 2019. BioInformant cell therapy industry database.https://bioinformant.com/product/cell-therapy-industry-database/
    1. Society A.C. Unproven methods of cancer management. Fresh cell therapy. CA Cancer J. Clin. 1991;41:126–128. - PubMed
    1. Thomas E.D., Lochte H.L., Jr., Lu W.C., Ferrebee J.W. Intravenous infusion of bone marrow in patients receiving radiation and chemotherapy. N. Engl. J. Med. 1957;257:491–496. - PubMed

Publication types