. 2020 Apr 13;37(4):599-617.e7.
doi: 10.1016/j.ccell.2020.03.005. Epub 2020 Apr 2.

KMT2D Deficiency Impairs Super-Enhancers to Confer a Glycolytic Vulnerability in Lung Cancer

Affiliations

KMT2D Deficiency Impairs Super-Enhancers to Confer a Glycolytic Vulnerability in Lung Cancer

Hunain Alam et al. Cancer Cell. .

Abstract

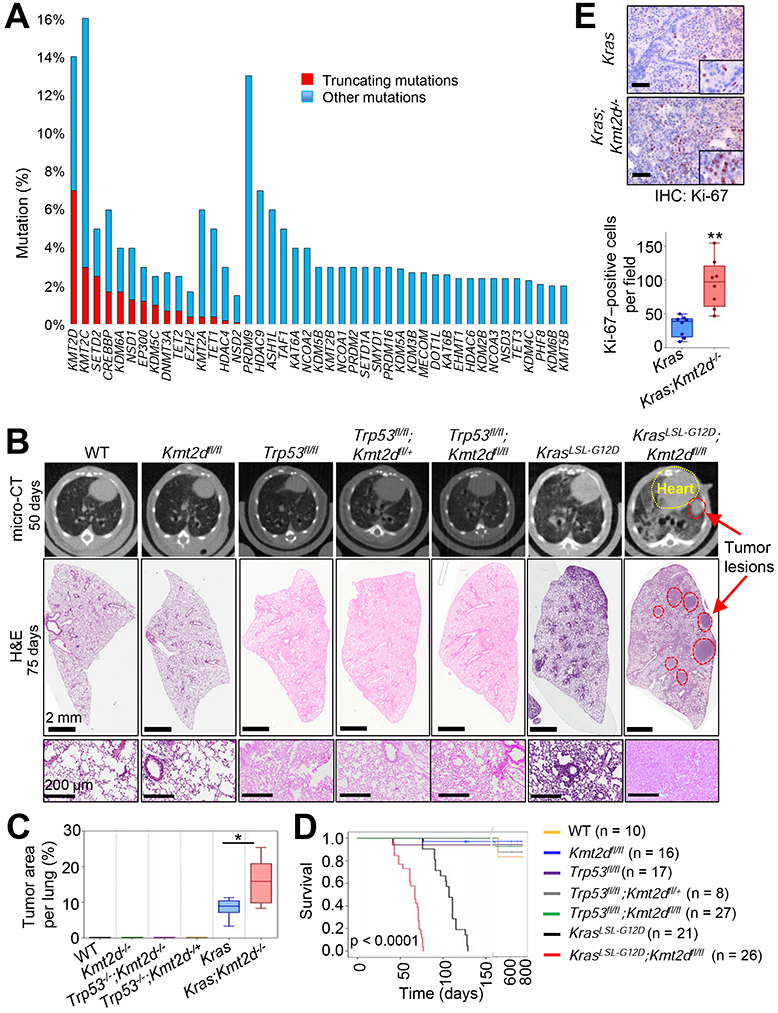
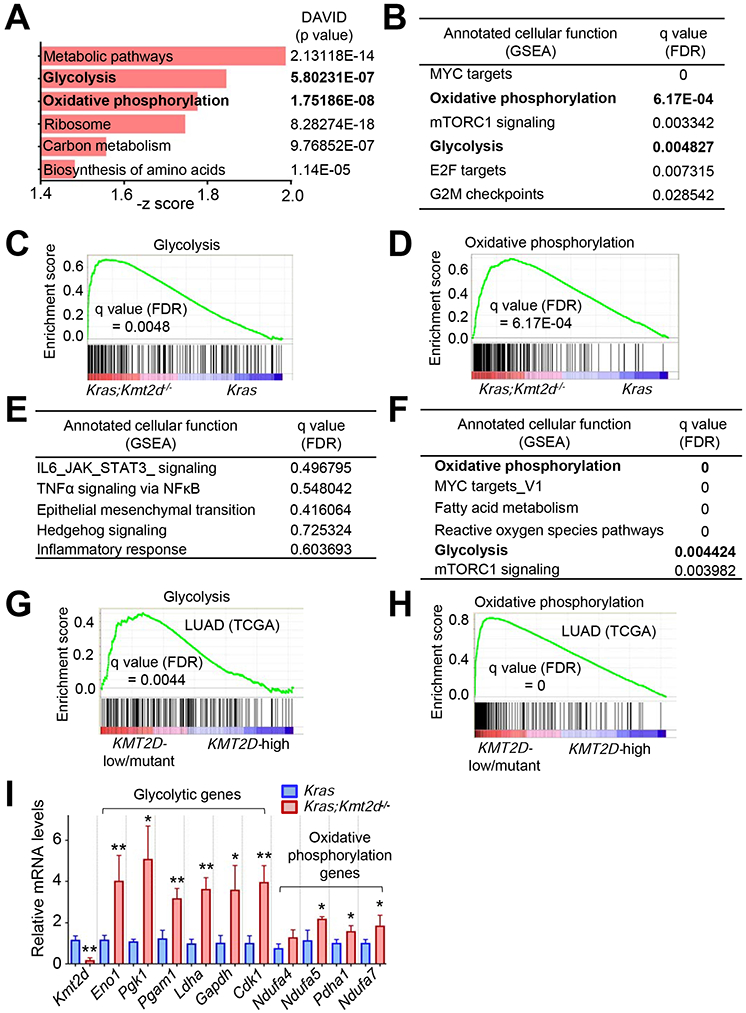
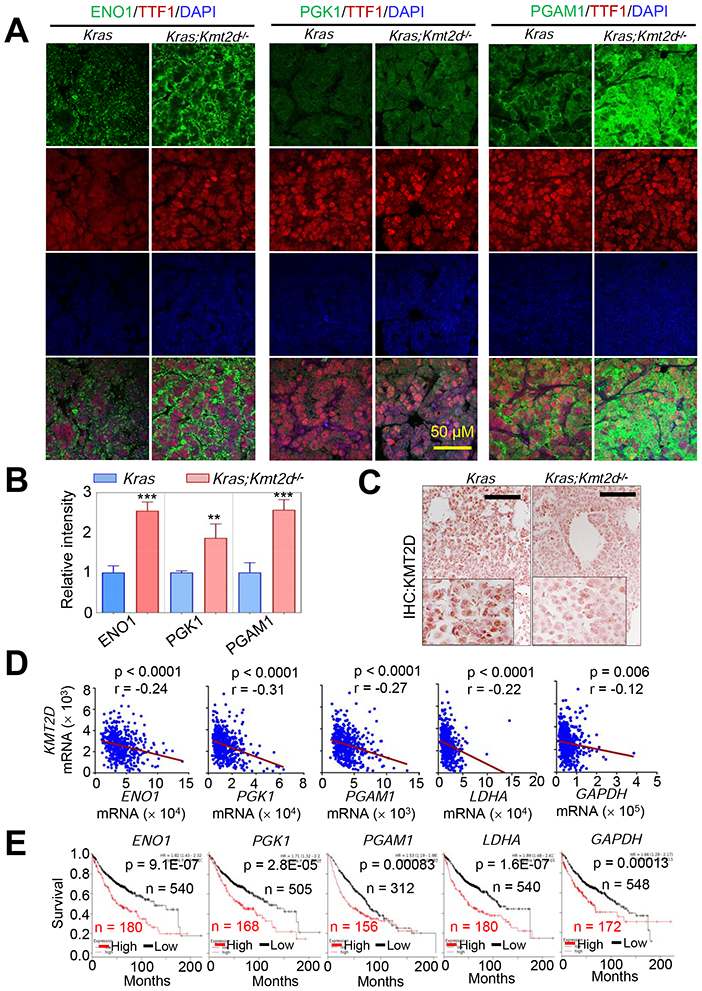
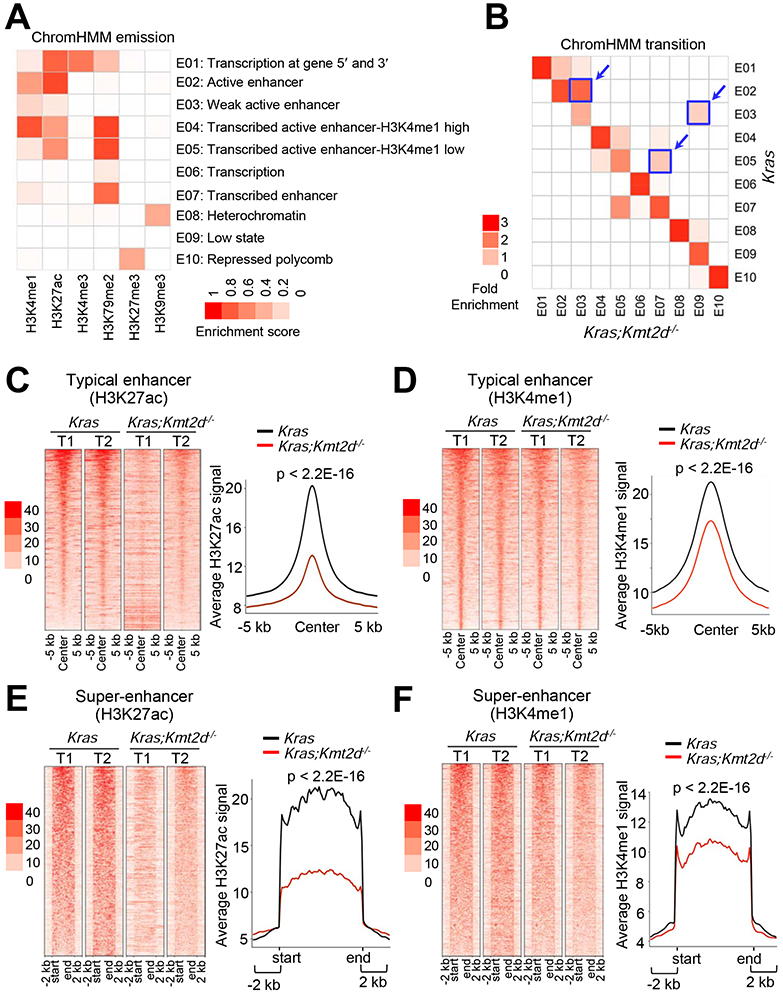
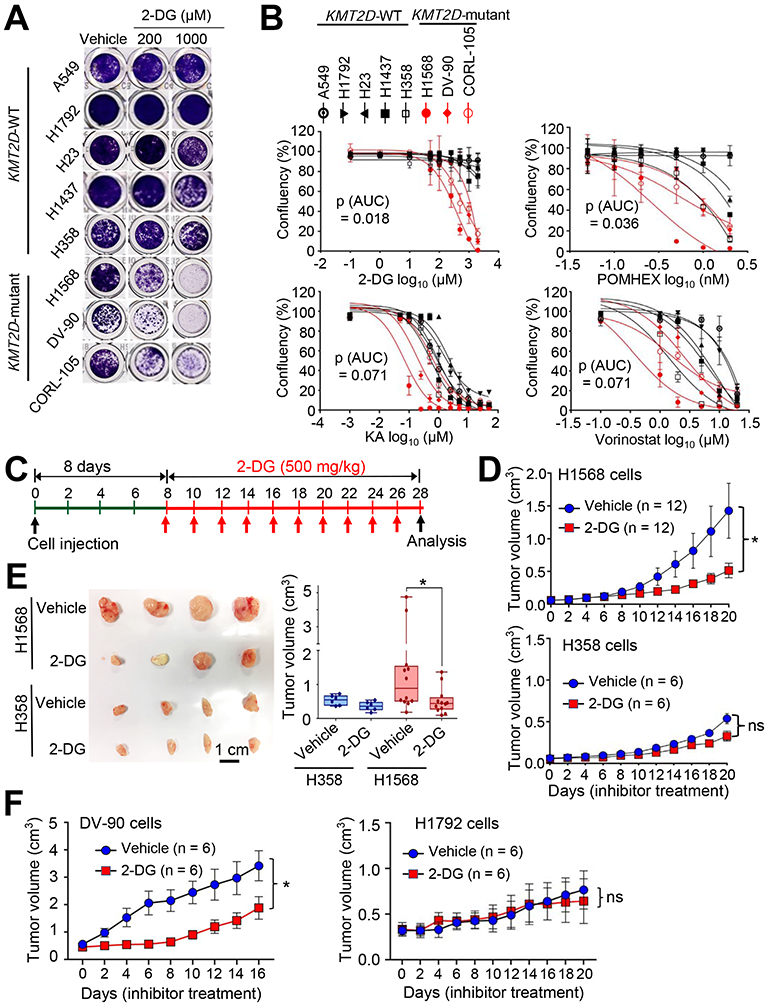
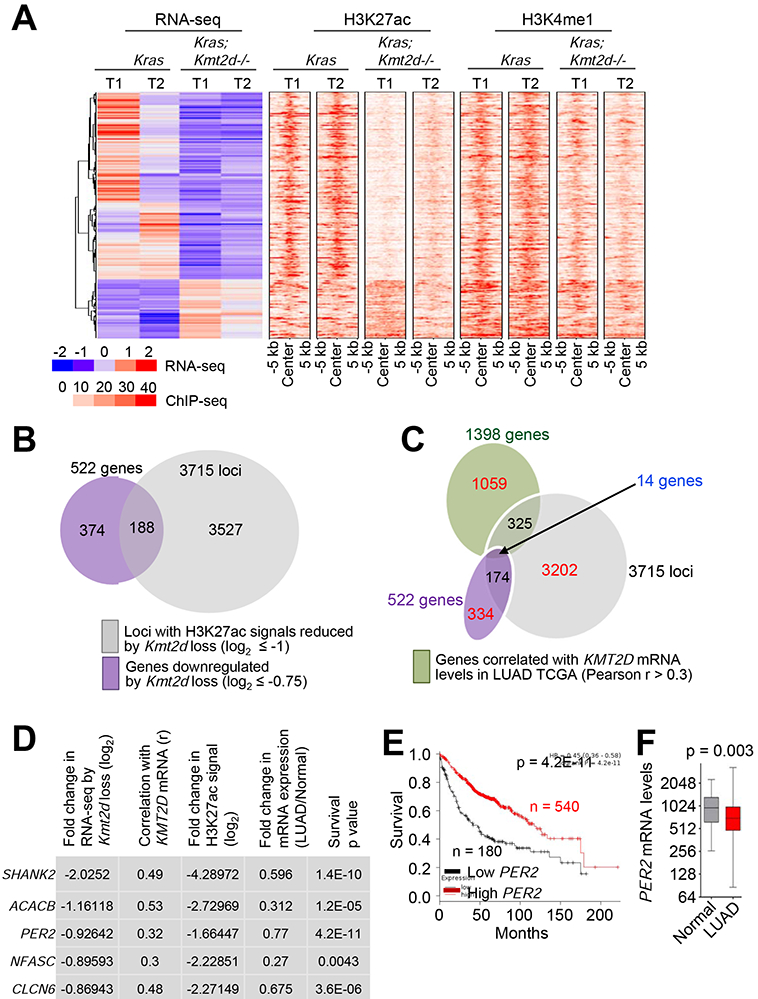
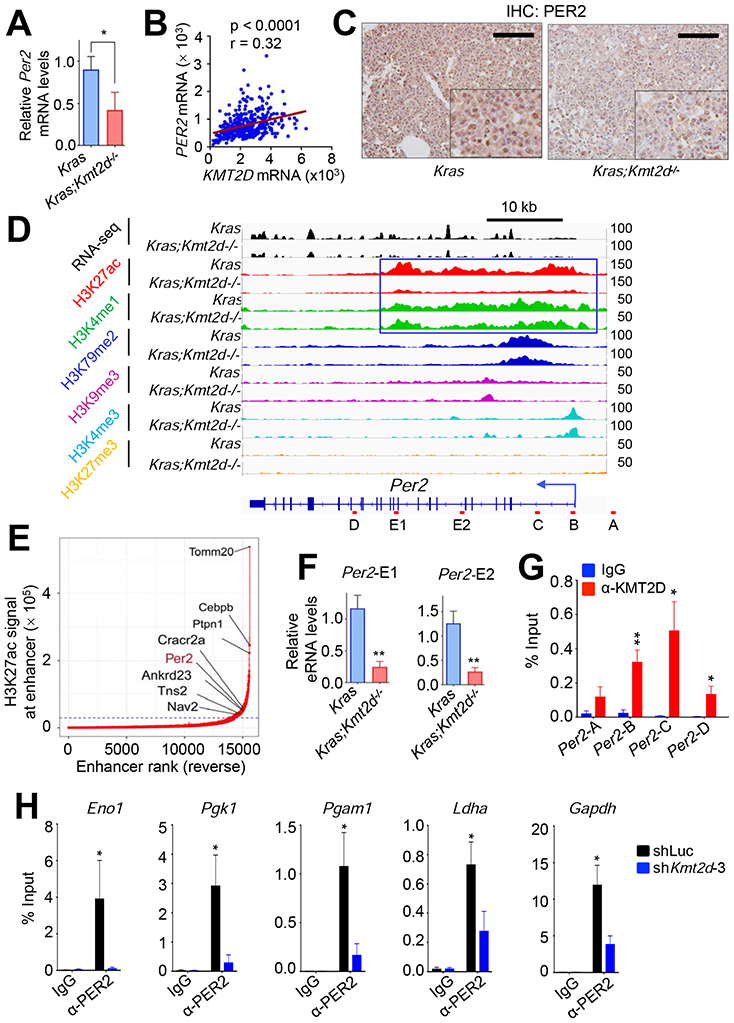
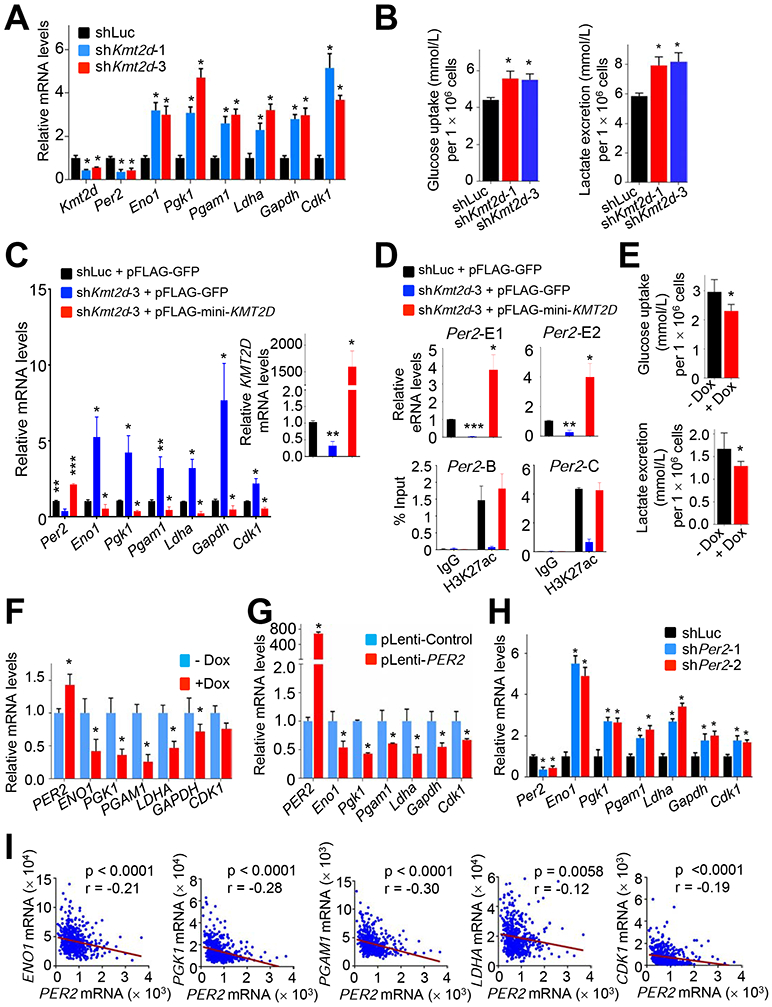
Epigenetic modifiers frequently harbor loss-of-function mutations in lung cancer, but their tumor-suppressive roles are poorly characterized. Histone methyltransferase KMT2D (a COMPASS-like enzyme, also called MLL4) is among the most highly inactivated epigenetic modifiers in lung cancer. Here, we show that lung-specific loss of Kmt2d promotes lung tumorigenesis in mice and upregulates pro-tumorigenic programs, including glycolysis. Pharmacological inhibition of glycolysis preferentially impedes tumorigenicity of human lung cancer cells bearing KMT2D-inactivating mutations. Mechanistically, Kmt2d loss widely impairs epigenomic signals for super-enhancers/enhancers, including the super-enhancer for the circadian rhythm repressor Per2. Loss of Kmt2d decreases expression of PER2, which regulates multiple glycolytic genes. These findings indicate that KMT2D is a lung tumor suppressor and that KMT2D deficiency confers a therapeutic vulnerability to glycolytic inhibitors.

Keywords: KMT2D; epigenetic modifier; glycolysis; histone methylation; histone methyltransferase; inhibitor; lung cancer; metabolism; super-enhancer; tumor suppressor.


Conflict of interest statement

Declaration of Interests The authors declare no competing interests.

Figures

Figure 1.
Figure 1.. The loss of Kmt2d, whose human homologue is among the most highly mutated epigenetic modifiers in lung cancer, strongly accelerates KRAS-driven LUAD in mice.
(A) Comparison of gene alterations of epigenetic modifiers (histone acetyltransferases and deacetylases, histone methyltransferases and demethylases, and DNA modifiers) in the TCGA Pan-lung cancer dataset. Other mutations represent missense and inframe mutations. (B) Representative images of micro-CT scans (top panels) and H&E-stained tissues (middle and bottom panels) of wild-type (WT), Kmt2dfl/fl, Trp53fl/fl, Trp53fl/fl;Kmt2dfl/+, Trp53fl/fl;Kmt2dfl/fl, KrasLSL-G12D, and KrasLSL-G12D;Kmt2dfl/fl mice. The lungs of the mice were infected with Adeno5 (Ad5)-CMV-Cre viruses. (C) Comparison of tumor area (%) per mouse in the indicated groups of mice (n = 6). (D) Kaplan-Meier survival analysis of the indicated groups of mice. The statistical analysis was performed using the two-sided log-rank test. (E) immunohistochemistry (IHC) analysis for the cell proliferation marker Ki-67 in Kras and Kras;Kmt2d−/− lung tumors. Ki-67-positive cells in ten random fields of three different tumors each from Kras and Kras;Kmt2d−/− groups were quantified. Black scale bars represent 50 μm. In the boxplots in (C) and (E), the bottom and the top rectangles indicate the first quartile (Q1) and third quartile (Q3), respectively. The horizontal lines in the middle signify the median (Q2), and the vertical lines that extend from the top and the bottom of the plot indicate the maximum and minimum values, respectively. *, p < 0.05; **, p < 0.01 (two-tailed Student’s t-test). See also Figures S1 and S2.
Figure 2.
Figure 2.. Kmt2d loss upregulates tumor-promoting programs, such as glycolysis.
(A) Ontology analysis of genes (n = 1113, p < 0.05) upregulated by Kmt2d loss in KRAS-driven mouse LUAD. Gene expression profiles were compared between Kras tumors and Kras;Kmt2d−/− tumors. The functional annotation tool DAVID was used for the analysis. Metabolic pathways include genes for glycolysis, oxidative phosphorylation (OXPHOS), and TCA cycle. (B) Pathways upregulated by Kmt2d loss in KRAS-driven mouse LUAD. FDR, false discovery rate. (C and D) Enrichment plot of glycolytic (C) and OXPHOS (D) genes in Kras;Kmt2d−/− tumors as compared with Kras tumors. Each of the black bars represents a gene in the pathway. (E) Pathways downregulated by Kmt2d loss in KRAS-driven mouse LUAD. (F) Pathways upregulated in human LUAD samples bearing low KMT2D mRNA expression (n = 20) or KMT2D-inactivating mutations (n = 4) as compared with human LUAD samples (n = 24) bearing high KMT2D mRNA expression. (G and H) Enrichment plot of glycolytic (G) and OXPHOS (H) genes in human LUAD samples bearing low KMT2D mRNA expression or KMT2D inactivation as compared with human LUAD samples bearing high KMT2D mRNA expression For (B–H), the GSEA was performed, and the Benjamini-Hochberg procedure was used for statistical analyses. (I) Analysis of mRNA levels of glycolytic genes and OXPHOS genes in Kras and Kras;Kmt2d−/−lung tumors using quantitative RT-PCR (n = 3). Data are presented as the mean ± SEM (error bars). *, p < 0.05; **, p < 0.01 (two-tailed Student’s t-test). See also Tables S1 and S2.
Figure 3.
Figure 3.. High expression levels of several glycolytic genes negatively correlate with KMT2D mRNA levels in LUADs and are linked to poor prognosis in LUAD patients.
(A and B) Immunofluorescence (IF) analysis for ENO1, PGK1, and PGAM1 in Kras and Kras;Kmt2d−/− lung tumor tissues. Representative IF images are shown (A), and the IF images were quantified (B). TTF1 is an LUAD marker. Data are presented as the mean ± SEM (error bars) of at least three independent experiments or biological replicates. **, p < 0.01; ***, p < 0.001 (two-tailed Student’s t-test). (C) IHC analysis for KMT2D in Kras and Kras;Kmt2d−/− lung tumor tissues. Black scale bars, 50 μm. (D) Inverse correlations of KMT2D mRNA levels with ENO1, PGK1, PGAM1, LDHA, and GAPDH mRNA levels in human LUADs in the TCGA dataset (n = 517). The statistical analysis was performed using two-tailed Student’s t-test. r, Pearson correlation coefficient. (E) Kaplan-Meier survival analysis of human LUAD patients using ENO1, PGK1, PGAM1, LDHA, and GAPDH mRNA levels. Higher quartile (except a best cutoff for PGAM1 data) was used as a cutoff to divide the samples into high (the highest 25%) and low (the remaining 75%) groups in the KM Plotter database (http://kmplot.com/analysis). The statistical analysis was performed using the two-sided log-rank test. KMT2D probe set, 227527_at; ENO1 probe set, 201231_at; PGK1 probe set, 227068_at; PGAM1 probe set, 200886_at; LDHA probe set, 200650_s_at; GAPDH probe set, 212581_at.
Figure 4.
Figure 4.. Kmt2d loss reduces epigenomic signals for super-enhancers and to a lesser extent enhancers at the genome-wide level.
(A) Emission probabilities of the 10-state ChromHMM model calculated from six histone modification profiles in Kras and Kras;Kmt2d−/− lung tumors. Each row represents one chromatin state. The 10 states predicted using ChromHMM represent various enhancer states (E2, E3, E4, E5, and E7), promoter state (E1), transcription states (E1, E6, and E7), polycomb-repressed state (E10), and heterochromatin state (E8). Each column corresponds to a histone modification. The intensity of the color in the scale from 0 (white) to 1 (red) in each cell reflects the frequency of occurrence of each histone mark in the indicated chromatin state. (B) Heat map showing the fold enrichment of transitions of chromatin states from Kras lung tumors to Kras;Kmt2d−/− lung tumors. The color intensities represent the relative fold enrichment. (C and D) Heat maps (left panels) and average intensity curves (right panels) of ChIP-seq reads (RPKM) for H3K27ac (C) and H3K4me1 (D) at typical enhancer regions. Enhancers are shown in a 10-kb window (centered on the middle of the enhancer) in Kras and Kras;Kmt2d−/− lung tumors. (E and F) Heat maps (left panel) and average intensity curves (right panels) of ChIP-seq reads for H3K27ac (E) and H3K4me1 (F) at the super-enhancer regions plus their flanking 2-kb regions in Kras and Kras;Kmt2d−/− lung tumors. Wilcoxon rank sum test was used for statistical analysis of (C–F). T1, tumor 1; T2, tumor 2. See also Figures S3 and S4.
Figure 5.
Figure 5.. Inhibition of glycolysis suppresses tumorigenic growth of KMT2D-mutant LUAD cell lines.
(A and B) The effect of 2-DG on the confluency of human LUAD cell lines bearing WT KMT2D (A549, H1792, H23, H1437, and H358) and LUAD cell lines bearing KMT2D-truncating mutations (H1568, DV-90, and CORL-105) (A) and dose-response curves of several inhibitors on these LUAD cell lines (B). Cells were treated with various concentrations of the hexokinase inhibitor 2-deoxy-D-glucose (2-DG), the enolase inhibitor POMHEX, the GAPDH inhibitor koningic acid (KA), and the HDAC inhibitor SAHA/vorinostat. Wilcoxon rank sum test (n = 3) was used for statistical analysis. AUC, Area under the curve. (CE) The effect of 2-DG on tumorigenic growth of H1568 cells bearing a KMT2D-truncating mutation and of H358 cells bearing WT KMT2D in a mouse subcutaneous xenograft model. The schedule of treatment of mice with 2-DG is shown (C). The sizes of xenograft tumors after treatment with 2-DG or vehicle control were measured (D). Tumors were dissected from the mice (E). In the boxplots, the bottom and the top rectangles indicate the first quartile (Q1) and third quartile (Q3), respectively. The horizontal lines in the middle signify the median (Q2), and the vertical lines that extend from the top and the bottom of the plot indicate the maximum and minimum values, respectively. (F) The effect of 2-DG on tumorigenic growth of DV-90 cells bearing a KMT2D-truncating mutation and of H1792 cells bearing WT KMT2D in a mouse subcutaneous xenograft model. Mice were treated with 2-DG (500 mg per kg body weight every other day) or vehicle. ns indicates non-significant. *, p < 0.05 (two-tailed Student’s t-test). See also Figures S5 and S6 and Table S3.
Figure 6.
Figure 6.. Integrative analysis of expression, enhancers, and clinical relevance for KMT2D-regulated genes.
(A) Heat maps for genes differentially expressed between Kras and Kras;Kmt2d−/− lung tumors and for the signals of their closest H3K27ac and H3K4me1 peaks. (B) A Venn diagram showing the overlap between genes downregulated by Kmt2d loss (n = 522) and genes with H3K27ac ChIP-seq signals reduced by Kmt2d loss (n = 3715). (C) A Venn diagram showing the overlap between genes downregulated by Kmt2d loss (n = 522), genes with H3K27ac ChIP-seq signals reduced by Kmt2d loss (n = 3715), and genes correlated with KMT2D expression (n = 1398 with r ≥ 0.3) in LUAD samples (n = 357) in the TCGA database. (D) The top five hits on the basis of the five different parameters indicated. r, Pearson correlation coefficient. (E) The Kaplan-Meier survival analysis showing the association of low PER2 mRNA levels with poor survival in lung cancer patients. The lower quartile was used as a cutoff to divide the samples into low (the lowest 25%) and high (the remaining 75%) KMT2D mRNA groups. PER2 probe set, 205251_at. In (D) and (E), the p values were calculated using using the two-sided log-rank test. (F) Boxplots showing downregulation of PER2 mRNA levels in LUAD samples (n = 517) as compared with their adjacent normal samples (n = 54) in the TCGA dataset. In the boxplots, the bottom and the top rectangles indicate the first quartile (Q1) and third quartile (Q3), respectively. The horizontal lines in the middle signify the median (Q2), and the vertical lines that extend from the top and the bottom of the plot indicate the maximum and minimum values, respectively. The p value was determined using two-tailed Student’s t-test. See also Figure S7.
Figure 7.
Figure 7.. KMT2D positively regulates Per2 expression, and PER2 occupies glycolytic genes
(A) Analysis of relative Per2 mRNA levels in Kras and Kras;Kmt2d−/− lung tumors using quantitative RT-PCR. (B) A scatter plot showing a positive correlation between KMT2D and PER2 mRNA levels in the TCGA LUAD dataset (n = 517). The statistical analysis was performed using Two-tailed Student’s t-test. r, Pearson correlation coefficient. (C) Analysis of PER2 protein levels in Kras and Kras;Kmt2d−/− lung tumors using IHC. Black scale bars, 50 μm. (D) Genome browser view of normalized ChIP-seq signals of six chromatin marks (H3K27ac, H3K4me1, H3K79me2, H3K9me3, H3K4me3, and H3K27me3) at the Per2 locus in Kras and Kras;Kmt2d−/− lung tumors. All the tracks were average of two biological replicates. The Per2-associated super-enhancer is indicated by the blue-outlined box. (E) A plot indicating super-enhancers identified on the basis of H3K27ac signals. The numbers in X-axis are in reverse order. (F) Analysis of eRNA levels for two different regions (E1 and E2) of the Per2 super-enhancer in Kras and Kras;Kmt2d−/− lung tumors using quantitative RT-PCR. (G) Quantitative ChIP analysis of KMT2D in Per2 in LKR10 cells. (H) Quantitative ChIP analysis of PER2 in glycolytic genes in LKR10 cells. ChIP amplicons are indicated in Figure S7H. In (A), (F), (G), and (H), data are presented as the mean ± SEM (error bars) of at least three independent experiments or biological replicates. *, p < 0.05; **, p < 0.01 (two-tailed Student’s t-test).
Figure 8.
Figure 8.. KMT2D-activated Per2 expression represses glycolytic genes.
(A) Analysis of the effect of KMT2D knockdown on Per2, Eno1, Pgk1, Pgam1, Ldha, Gapdh, and Cdk1 mRNA levels in mouse LKR-10 LUAD cells bearing KRASG12D using quantitative RT-PCR. (B) The effect of KMT2D knockdown on glucose uptake (Left panel) and lactate excretion (Right panel) in LKR10 cells. (C and D) Rescue experiments by ectopic expression of a functional but smaller KMT2D protein in LKR10 cells. KMT2D-depleted LKR10 cells were transfected with pFLAG-CMV2 expression plasmids encoding mini-KMT2D. Expression of glycolytic genes (C) as well as eRNA levels for two different regions (E1 and E2) of Per2 (D, Top panels) were analyzed using quantitative RT-PCR. H3K27ac levels were analyzed by quantitative ChIP (D, Bottom panels). (E and F) The effect of Dox-induced KMT2D on glucose uptake (E, Top panel) and lactate excretion (E, Bottom panel) in H1568 cells and on expression of glycolytic genes (F). H1568 cells bearing Dox-inducible KMT2D were treated with 10 μg/ml Dox. (G) Analysis of the effect of exogenous PER2 expression on Eno1, Pgk1, Pgam1, Ldha, Gapdh, and Cdk1 mRNA levels in LKR-10 cells using quantitative RT-PCR. (H) Analysis of the effect of PER2 knockdown on Eno1, Pgk1, Pgam1, Ldha, Gapdh, and Cdk1 mRNA levels in LKR-10 cells using quantitative RT-PCR. (I) Scatter plots showing inverse correlations of PER2 mRNA levels with ENO1, PGK1, PGAM1, LDHA or CDK1 mRNA levels in human LUADs in the TCGA dataset (n = 517). r, Pearson correlation coefficient. In (A–H), data are presented as the mean ± SEM (error bars) of at least three independent experiments or biological replicates. *, p < 0.05; **, p < 0.01; ***, p < 0.001 (two-tailed Student’s t-test). See also Figure S8.

References

    1. Alam H, Li N, Dhar SS, Wu SJ, Lv J, Chen K, Flores ER, Baseler L, and Lee MG (2018). HP1gamma Promotes Lung Adenocarcinoma by Downregulating the Transcription-Repressive Regulators NCOR2 and ZBTB7. A. Cancer Res 78, 3834–3848. - PMC - PubMed
    1. Barski A, Cuddapah S, Cui K, Roh TY, Schones DE, Wang Z, Wei G, Chepelev I, and Zhao K (2007). High-resolution profiling of histone methylations in the human genome. Cell 129, 823–837. - PubMed
    1. Bass J, and Takahashi JS (2010). Circadian integration of metabolism and energetics. Science 330, 1349–1354. - PMC - PubMed
    1. Bjornsson HT, Benjamin JS, Zhang L, Weissman J, Gerber EE, Chen YC, Vaurio RG, Potter MC, Hansen KD, and Dietz HC (2014). Histone deacetylase inhibition rescues structural and functional brain deficits in a mouse model of Kabuki syndrome. Sci Transl Med 6, 256ra135. - PMC - PubMed
    1. Brawer MK (2005). Lonidamine: basic science and rationale for treatment of prostatic proliferative disorders. Rev Urol 7 Suppl 7, S21–26. - PMC - PubMed

Publication types

MeSH terms