. 2020 Apr 14;14(4):717-729.
doi: 10.1016/j.stemcr.2020.03.004. Epub 2020 Apr 2.

Developing Organoids from Ovarian Cancer as Experimental and Preclinical Models

Affiliations

Developing Organoids from Ovarian Cancer as Experimental and Preclinical Models

Nina Maenhoudt et al. Stem Cell Reports. .

Abstract

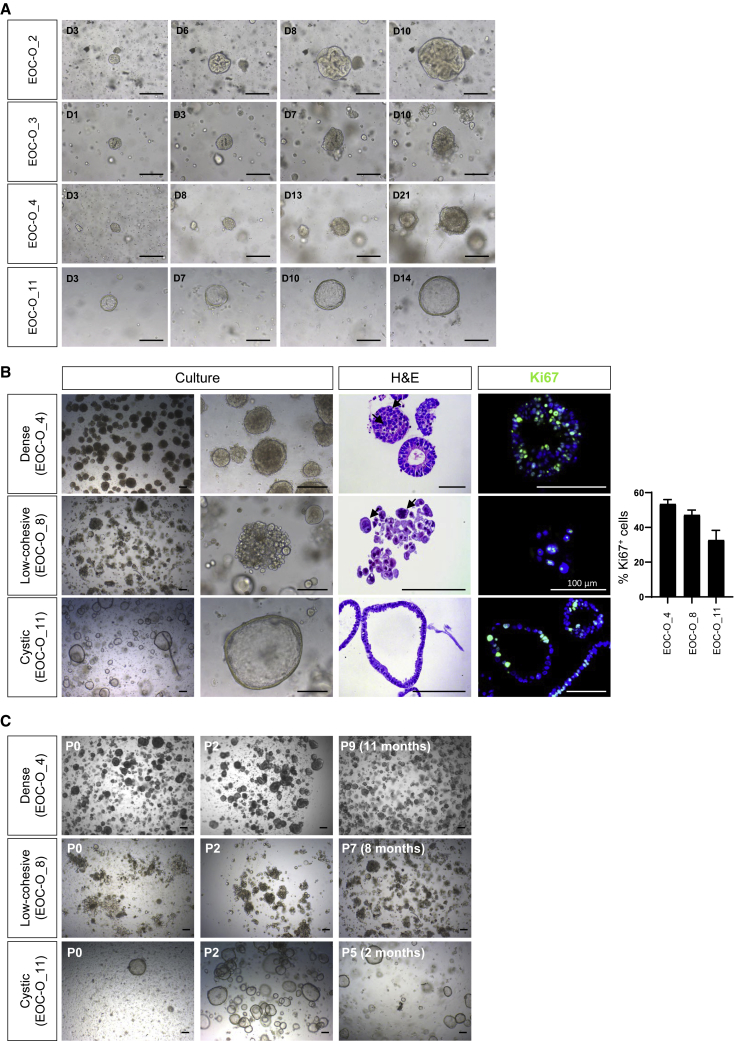
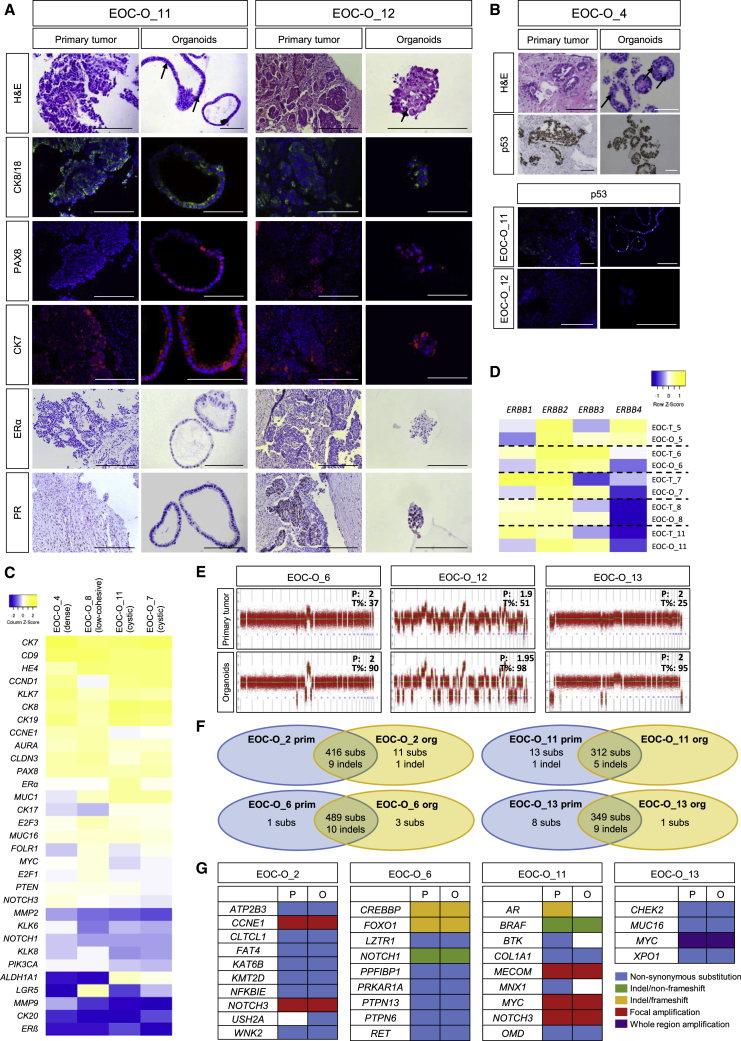
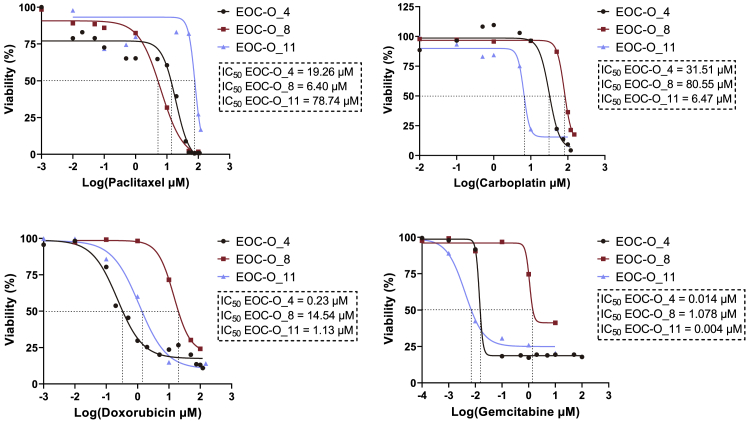
Ovarian cancer (OC) represents the most dismal gynecological cancer. Pathobiology is poorly understood, mainly due to lack of appropriate study models. Organoids, defined as self-developing three-dimensional in vitro reconstructions of tissues, provide powerful tools to model human diseases. Here, we established organoid cultures from patient-derived OC, in particular from the most prevalent high-grade serous OC (HGSOC). Testing multiple culture medium components identified neuregulin-1 (NRG1) as key factor in maximizing OC organoid development and growth, although overall derivation efficiency remained moderate (36% for HGSOC patients, 44% for all patients together). Established organoid lines showed patient tumor-dependent morphology and disease characteristics, and recapitulated the parent tumor's marker expression and mutational landscape. Moreover, the organoids displayed tumor-specific sensitivity to clinical HGSOC chemotherapeutic drugs. Patient-derived OC organoids provide powerful tools for the study of the cancer's pathobiology (such as importance of the NRG1/ERBB pathway) as well as advanced preclinical tools for (personalized) drug screening and discovery.

Keywords: ERBB; disease modeling; high-grade serous ovarian cancer; neuregulin-1; organoids; ovarian cancer.


Figures

Figure 1
Figure 1
Establishing Organoid Cultures from Ovarian Cancer (A) Organoid development from EOC (passage 0, P0), showing patients’ tumor-associated differences in growth rate. Representative bright-field images are shown at different days (D) after seeding. Scale bars, 200 μm. (B) Distinct morphology of patients’ EOC organoid lines. Representative images of organoid culture and individual organoids (bright-field), of H&E staining, and of Ki67 immunofluorescence analysis (DAPI as nuclear stain) are shown. Some high-grade nuclear atypia are indicated by arrows. Bar graph (right) depicts the proportion of Ki67+ cells in the organoid lines as indicated (mean ± SEM, n = 3–5 independent experiments per line). Scale bars, 200 μm unless indicated otherwise. (C) Long-term expansion of EOC organoid lines. Representative bright-field images of different passages (P) are shown. Scale bars, 200 μm.
Figure 2
Figure 2
EOC-Derived Organoids Capture Disease and Primary Tumor Phenotype (A) Organoids reproduce the primary tumor's molecular and cellular phenotype. Representative pictures of H&E staining and immunostaining of disease-associated protein markers in primary tumor and organoids are shown (DAPI and hematoxylin as nuclear stain). The primary tissue shows abundant high-grade nuclear atypia (H&E), which are also found in the organoids (some indicated with arrows). Scale bars, 200 μm. (B) Organoids reproduce the primary tumor's p53 phenotype. Representative pictures of H&E staining and p53 immunostaining in primary tumor and organoids are shown (DAPI and hematoxylin as nuclear stain). The primary tissue shows abundant high-grade nuclear atypia (H&E), which are also found in the organoids (some indicated with arrows). Scale bars, 200 μm. (C) Organoids show EOC (HGSOC)-associated gene expression profile. Heatmap of expression of genes, as quantified by qRT-PCR and presented as relative expression to GAPDH (ΔCt) (visualized as color-coded row Z score), in organoids from different patients (with different morphology) is shown. Colors range from blue (low expression) to yellow (high expression). (D) ERBB expression profile in primary tumors (EOC-T) and corresponding organoids (EOC-O) as quantified by qRT-PCR and presented as relative expression to GAPDH (ΔCt), visualized as color-coded row Z score. Colors range from blue (low expression) to yellow (high expression). (E) Organoids capture the mutational profile of the primary tissue. Representative copy-number profiles from three different organoid lines (analyzed at P2–P4) and corresponding primary EOC tumor are shown. Numbers indicate ploidy (P) and tumor cell fraction (T%). (F) Venn diagrams presenting the number of genetic aberrations (subs, substitutions; indel, insertion/deletion) that are common (intersection) or different between primary tumor and corresponding organoids. Numbers were retrieved from Table S3. (G) Mutation matrix representing hits in cancer consensus, OC-relevant, homology recombination, and amplification-driver genes as detected by WES in primary tumor and derived organoids. P, primary tumor; O, organoids.
Figure 3
Figure 3
EOC-Derived Organoids Show Patient-Specific Drug Responses Dose-response curves of EOC organoid cultures from different patients treated for 72 h with drugs are shown. Cell viability was measured using XTT assay. Mean data points (n = 3 biologically independent experiments, i.e., independent donors, with each dot representing the mean of three technical replicates per donor) are displayed for each drug concentration analyzed. IC50 values are determined (dashed lines) and indicated.

References

    1. Antoniou A., Pharoah P.D.P., Narod S., Risch H.A., Eyfjord J.E., Hopper J.L., Loman N., Olsson H., Johannsson O., Borg Å. Average risks of breast and ovarian cancer associated with BRCA1 or BRCA2 mutations detected in case series unselected for family history: a combined analysis of 22 studies. Am. J. Hum. Genet. 2003;72:1117–1130. - PMC - PubMed
    1. Aune G., Lian A.M., Tingulstad S., Torp S.H., Forsmo S., Reseland J.E., Stunes A.K., Syversen U. Increased circulating hepatocyte growth factor (HGF): a marker of epithelial ovarian cancer and an indicator of poor prognosis. Gynecol. Oncol. 2011;121:402–406. - PubMed
    1. Azmi A.S., Li Y., Muqbil I., Aboukameel A., Senapedis W., Baloglu E., Landesman Y., Shacham S., Kauffman M.G., Philip P.A. Exportin 1 (XPO1) inhibition leads to restoration of tumor suppressor miR-145 and consequent suppression of pancreatic cancer cell proliferation and migration. Oncotarget. 2017;8:82144–82155. - PMC - PubMed
    1. Boretto M., Cox B., Noben M., Hendriks N., Fassbender A., Roose H., Amant F., Timmerman D., Tomassetti C., Vanhie A. Development of organoids from mouse and human endometrium showing endometrial epithelium physiology and long-term expandability. Development. 2017;144:1775–1786. - PubMed
    1. Boretto M., Maenhoudt N., Luo X., Hennes A., Boeckx B.B., Bui B., Heremans R., Perneel L., Kobayashi H., Van Zundert I. Patient-derived organoids from endometrial disease capture clinical heterogeneity and are amenable to drug screening. Nat. Cell Biol. 2019;21:1041–1051. - PubMed

Publication types