. 2020 Apr 14;14(4):541-550.
doi: 10.1016/j.stemcr.2020.03.007. Epub 2020 Apr 2.

Human iPSC-Derived Neurons and Cerebral Organoids Establish Differential Effects of Germline NF1 Gene Mutations

Affiliations

Human iPSC-Derived Neurons and Cerebral Organoids Establish Differential Effects of Germline NF1 Gene Mutations

Corina Anastasaki et al. Stem Cell Reports. .

Abstract

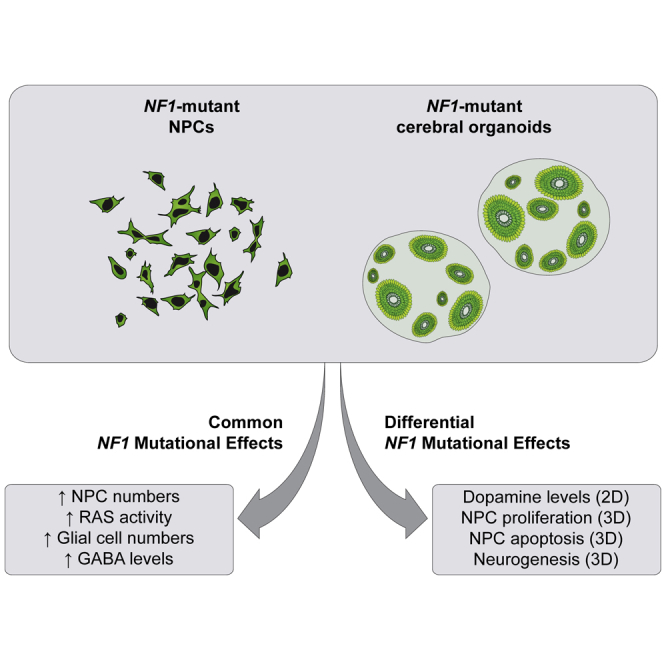
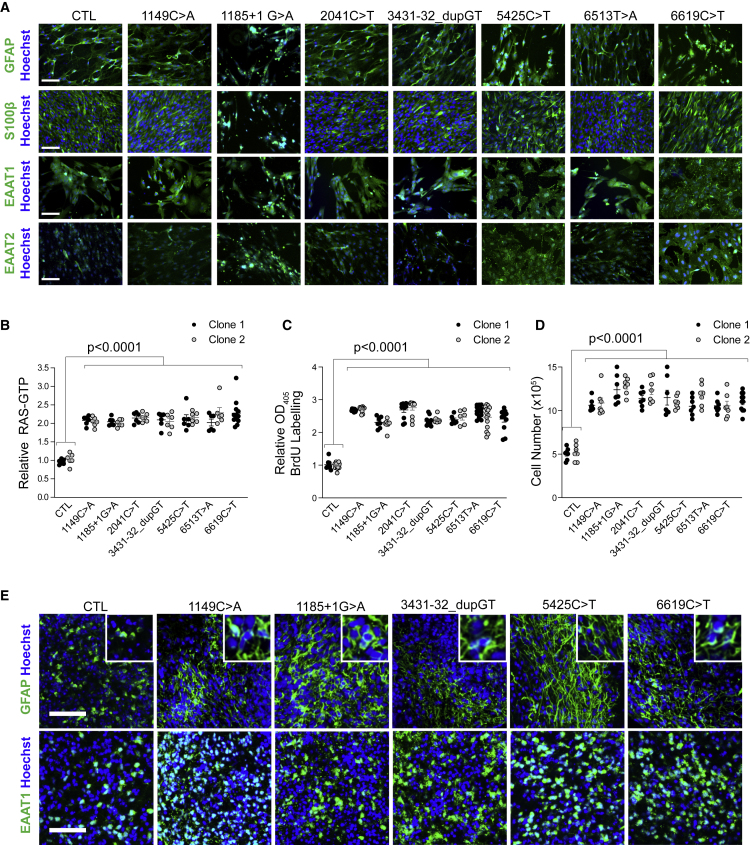
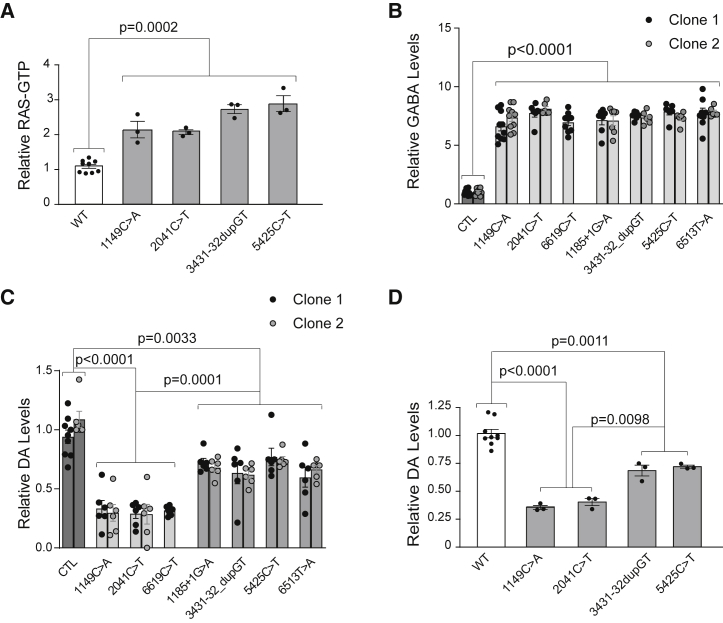
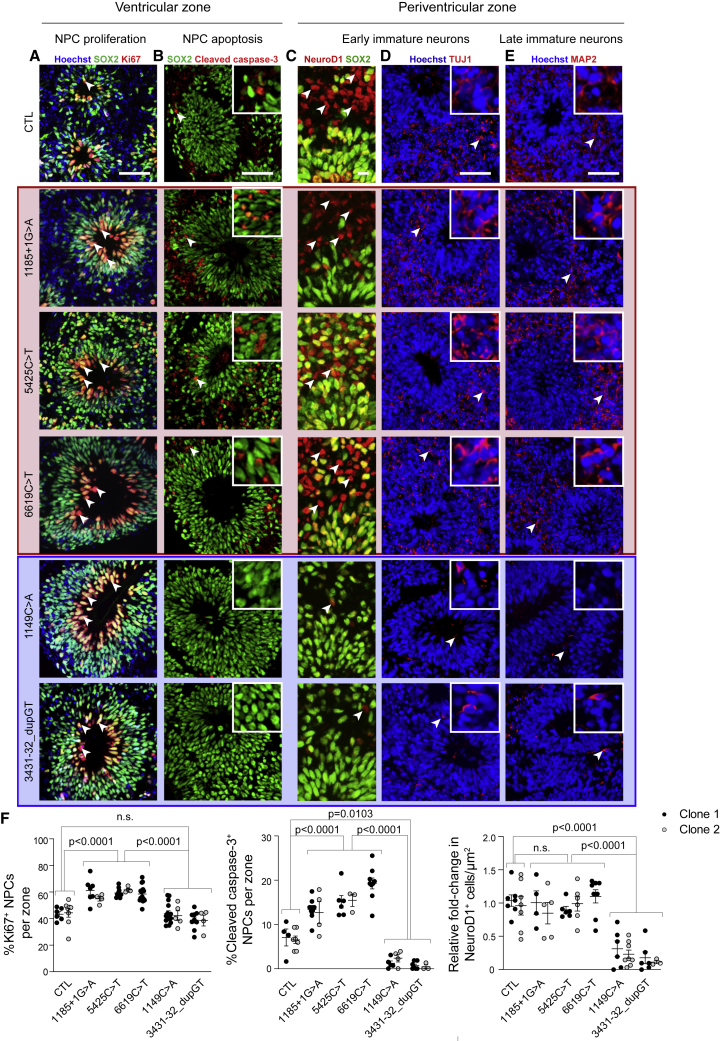
Neurofibromatosis type 1 (NF1) is a common neurodevelopmental disorder caused by a spectrum of distinct germline NF1 gene mutations, traditionally viewed as equivalent loss-of-function alleles. To specifically address the issue of mutational equivalency in a disease with considerable clinical heterogeneity, we engineered seven isogenic human induced pluripotent stem cell lines, each with a different NF1 patient NF1 mutation, to identify potential differential effects of NF1 mutations on human central nervous system cells and tissues. Although all mutations increased proliferation and RAS activity in 2D neural progenitor cells (NPCs) and astrocytes, we observed striking differences between NF1 mutations on 2D NPC dopamine levels, and 3D NPC proliferation, apoptosis, and neuronal differentiation in developing cerebral organoids. Together, these findings demonstrate differential effects of NF1 gene mutations at the cellular and tissue levels, suggesting that the germline NF1 gene mutation is one factor that underlies clinical variability.

Keywords: disease modeling; human iPSCs; neurodevelopment; neurofibromatosis type 1.


Figures

None
Graphical abstract
Figure 1
Figure 1
Isogenic NF1-Mutant hiPSC-Derived NPCs Exhibit Increased RAS Activity and Cell Proliferation (A) Schematic diagram illustrating the position of the engineered NF1 patient mutations within the NF1 gene. The location of the RAS-GAP domain is highlighted in black. (B) Relative NF1 mRNA expression in isogenic NF1-mutant NPCs is similar to the controls. (C–E) (C) Quantitation demonstrating increased RAS activity (RAS-GTP) in isogenic NF1-mutant NPCs relative to controls (CTL) before and after the addition of (D) 10 μg/mL FGF or (E) BDNF. A minimum of three independent replicates was performed for each treatment condition. (F) BrdU incorporation is increased by 2.6- to 3.2-fold in NF1-mutant NPCs relative to control NPCs. (G) 1.9- to 2-fold increases in total cell numbers were observed in NF1-mutant NPCs compared with controls. (H) Representative bright-field images of embryoid bodies and cerebral organoids at 16 and 56 DIV. (I and J) (I) Quantitation demonstrating increased RAS activity (2.8- to 3.2-fold) and (J) increased numbers of SOX2+ NPCs per ventricular zone (1.6- to 2.2-fold) in 16 DIV NF1-mutant cerebral organoids relative to control organoids. Each dot represents an independently generated data point derived from separate experiments and the two different clones for each line are denoted as black versus gray dots. All data are represented as means ± SEM. (B, C, F, G, I, and J) One-way ANOVA with Tukey post-test. (D and E) Two-way ANOVA with Bonferroni post-test. n.s., not significant. Scale bar, 1 mm.
Figure 2
Figure 2
hiPSC-Derived NF1-Mutant Astroglia Exhibit Increased RAS Activity and Cell Proliferation (A) NF1-mutant and control NPCs were differentiated into GFAP+, S100+, EAAT1+, and EAAT2+ astrocytes in 2D cultures. Scale bar, 100 μm. (B) RAS-GTP was increased by 2- to 2.3-fold in NF1-mutant astrocytes relative to controls (CTL). (C) Proliferation of NF1-mutant astrocytes was 2.3- to 2.7-fold higher relative to controls. (D) Direct cell counting demonstrated a 2.1- to 2.5-fold increase in NF1-mutant astrocytes compared with controls. (E) NF1-mutant cerebral organoids grown for 56 DIV had increased cells with GFAP+ fibers and increased numbers of EAAT1+ glial cells compared with isogenic controls. Scale bars, 50 μm. Each dot represents an independently generated data point derived from separate experiments and the two different clones for each line are denoted as black versus gray dots. All data are represented as means ± SEM. One-way ANOVA with Tukey post-test.
Figure 3
Figure 3
hiPSC-Derived NF1-Mutant Neurons, NPCs, and Nf1-Mutant Mice Display Molecular Similarities and Differences (A) Nf1-mutant (1149C > A, 2041C > T, 3431-32_dupGT, 5425C > T) genetically engineered mouse brain lysates exhibit increased RAS activity compared with wild-type littermate controls. (B) GABA levels are increased in all NF1-mutant NPC-derived neurons relative to controls. (C and D) Dopamine levels are differentially reduced in (C) NF1-mutant NPCs relative to controls and (D) Nf1-mutant genetically engineered mouse brain lysates compared with WT littermate controls. Each dot represents an independently generated data point derived from separate experiments and the two different clones for each line are denoted as black versus gray dots. All data are represented as means ± SEM. One-way ANOVA with Tukey post-test.
Figure 4
Figure 4
Differential Effects of NF1 Mutations on Cerebral Organoid Progenitor Cell Dynamics and Neurogenesis (A and B) SOX2+ NPCs in the ventricular zones of group 1 NF1-mutant cerebral organoids exhibit (A) 1.3- to 1.4-fold increased proliferation (Ki67+ cells; white arrowheads) and (B) 2- to 3-fold increased cell apoptosis (cleaved caspase-3; white arrowheads) compared with control and group 2 cerebral organoids at 16 DIV. (C–E) Decreased numbers of (C and D) early immature neurons (NeuroD1; TUJ1 white arrowheads) and (E) late immature neurons (MAP2; white arrowheads) migrating into the periventricular zone of group 2 compared with group 1 and control cerebral organoids at 16 DIV. (F) Quantifications of %Ki67+ NPCs, %cleaved caspase-3+ NPCs and NeuroD1+ immature neurons in NF1-mutant cerebral organoids compared with controls at 16 DIV. Each dot represents an independently generated data point derived from separate experiments and the two different clones for each line are denoted as black versus gray dots. All data are represented as means ± SEM. One-way ANOVA with Dunnett post-test. n.s., not significant. Scale bars, 10 μm (C) and 50 μm (A, B, D, and E).

References

    1. Anastasaki C., Morris S.M., Gao F., Gutmann D.H. Children with 5'-end NF1 gene mutations are more likely to have glioma. Neurol. Genet. 2017;3:e192. - PMC - PubMed
    1. Anastasaki C., Woo A.S., Messiaen L.M., Gutmann D.H. Elucidating the impact of neurofibromatosis-1 germline mutations on neurofibromin function and dopamine-based learning. Hum. Mol. Genet. 2015;24:3518–3528. - PMC - PubMed
    1. Bell C.C., Magor G.W., Gillinder K.R., Perkins A.C. A high-throughput screening strategy for detecting CRISPR-Cas9 induced mutations using next-generation sequencing. BMC Genomics. 2014;15:1002. - PMC - PubMed
    1. Bolcekova A., Nemethova M., Zatkova A., Hlinkova K., Pozgayova S., Hlavata A., Kadasi L., Durovcikova D., Gerinec A., Husakova K. Clustering of mutations in the 5' tertile of the NF1 gene in Slovakia patients with optic pathway glioma. Neoplasma. 2013;60:655–665. - PubMed
    1. Costa R.M., Federov N.B., Kogan J.H., Murphy G.G., Stern J., Ohno M., Kucherlapati R., Jacks T., Silva A.J. Mechanism for the learning deficits in a mouse model of neurofibromatosis type 1. Nature. 2002;415:526–530. - PubMed

Publication types