

Lower respiratory tract infection in the community: associations between viral aetiology and illness course
- PMID: 32244051
- PMCID: PMC7118666
- DOI: 10.1016/j.cmi.2020.03.023
Lower respiratory tract infection in the community: associations between viral aetiology and illness course
Abstract
Objectives: This study determined associations between respiratory viruses and subsequent illness course in primary care adult patients presenting with acute cough and/or suspected lower respiratory tract infection.
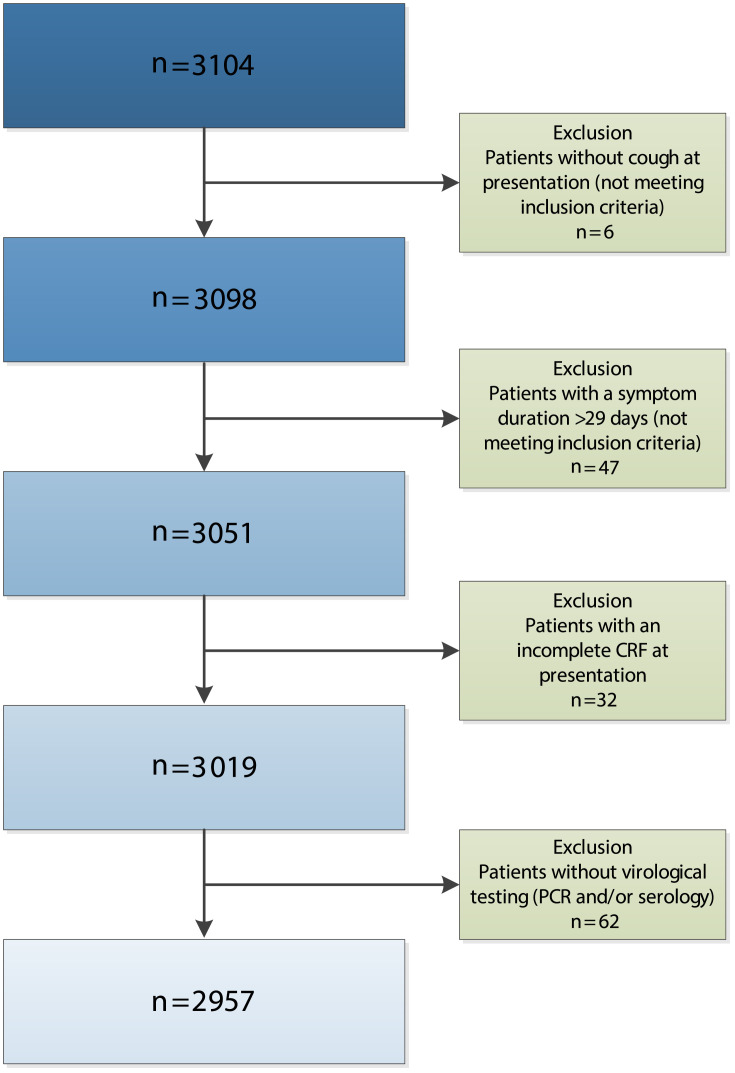
Methods: A prospective European primary care study recruited adults with symptoms of lower respiratory tract infection between November 2007 and April 2010. Real-time in-house polymerase chain reaction (PCR) was performed to test for six common respiratory viruses. In this secondary analysis, symptom severity (scored 1 = no problem, 2 = mild, 3 = moderate, 4 = severe) and symptom duration were compared between groups with different viral aetiologies using regression and Cox proportional hazard models, respectively. Additionally, associations between baseline viral load (cycle threshold (Ct) value) and illness course were assessed.
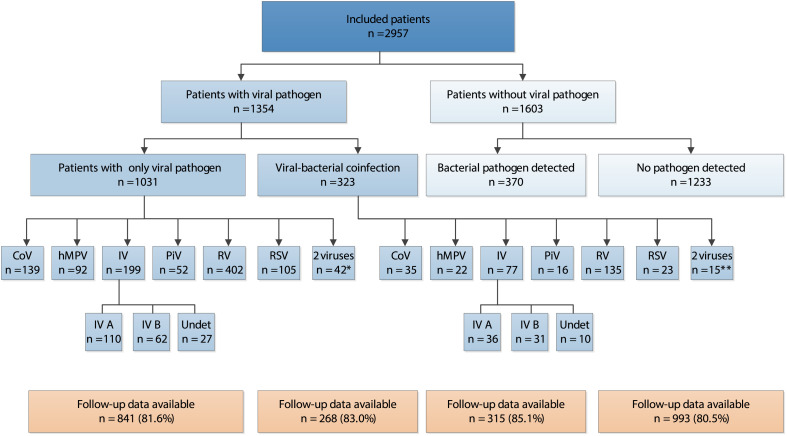
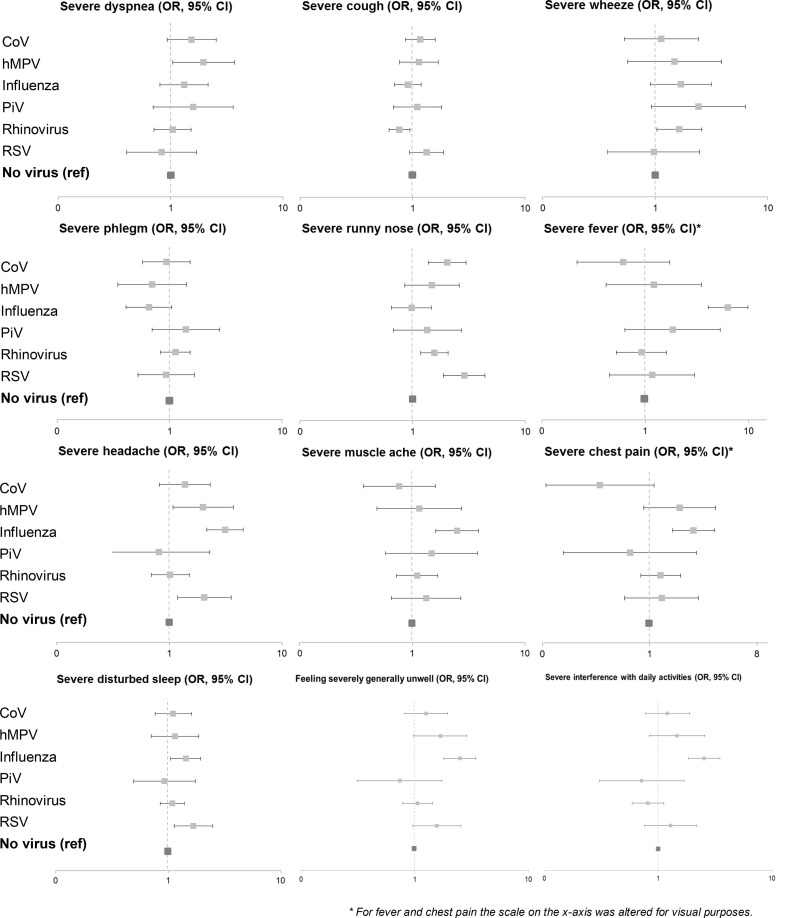
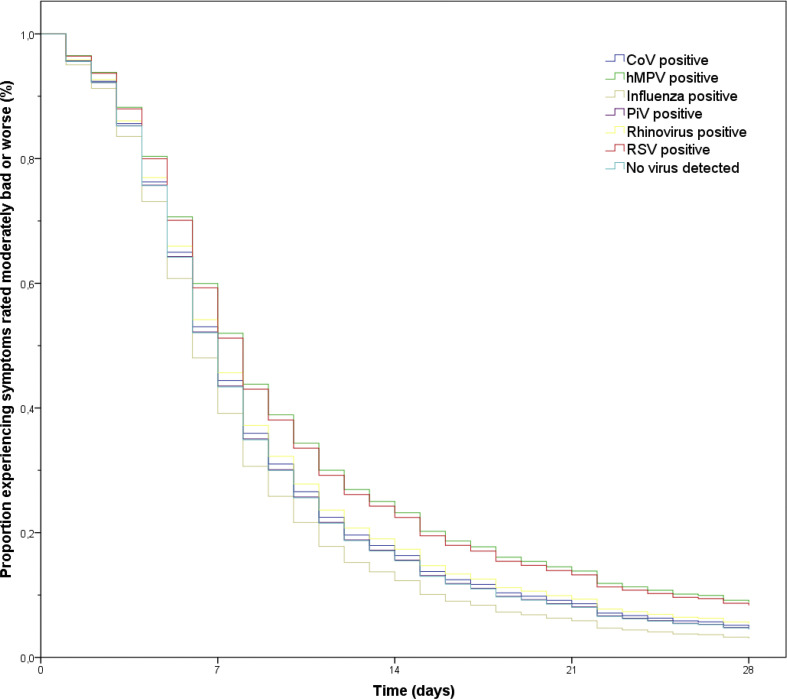
Results: The PCR tested positive for a common respiratory virus in 1354 of the 2957 (45.8%) included patients. The overall mean symptom score at presentation was 2.09 (95% confidence interval (CI) 2.07-2.11) and the median duration until resolution of moderately bad or severe symptoms was 8.70 days (interquartile range 4.50-11.00). Patients with influenza virus, human metapneumovirus (hMPV), respiratory syncytial virus (RSV), coronavirus (CoV) or rhinovirus had a significantly higher symptom score than patients with no virus isolated (0.07-0.25 points or 2.3-8.3% higher symptom score). Time to symptom resolution was longer in RSV infections (adjusted hazard ratio (AHR) 0.80, 95% CI 0.65-0.96) and hMPV infections (AHR 0.77, 95% CI 0.62-0.94) than in infections with no virus isolated. Overall, baseline viral load was associated with symptom severity (difference 0.11, 95% CI 0.06-0.16 per 10 cycles decrease in Ct value), but not with symptom duration.
Conclusions: In healthy, working adults from the general community presenting at the general practitioner with acute cough and/or suspected lower respiratory tract infection other than influenza impose an illness burden comparable to influenza. Hence, the public health focus for viral respiratory tract infections should be broadened.
Keywords: Disease burden; lower respiratory tract infection; primary healthcare; public health; respiratory tract infection; respiratory virus; symptom duration; symptom severity.
Copyright © 2020. Published by Elsevier Ltd.
Figures
References
-
- Woodhead M., Blasi F., Ewig S., Garau J., Huchon G., Ieven M. Guidelines for the management of adult lower respiratory tract infections – Summary. Clin Microbiol Infect. 2011;17:1–24. - PubMed
-
- Verheij T., Hermans J., Kaptein A., Mulder J. Acute bronchitis: course of symptoms and restrictions in patients’ daily activities. Scand J Prim Health Care. 1995;13:8–12. - PubMed
-
- Fragaszy E.B., Warren-Gash C., White P.J., Zambon M., Edmunds W.J., Nguyen-Van-Tam J.S. Effects of seasonal and pandemic influenza on health-related quality of life, work and school absence in England: results from the Flu Watch cohort study. Influenza Other Respir Virus. 2018;12:171–182. - PMC - PubMed
MeSH terms
LinkOut - more resources
Full Text Sources
Other Literature Sources
Medical
Research Materials
Miscellaneous
