

Hypothalamic POMC deficiency increases circulating adiponectin despite obesity
- PMID: 32244188
- PMCID: PMC7082555
- DOI: 10.1016/j.molmet.2020.01.021
Hypothalamic POMC deficiency increases circulating adiponectin despite obesity
Abstract
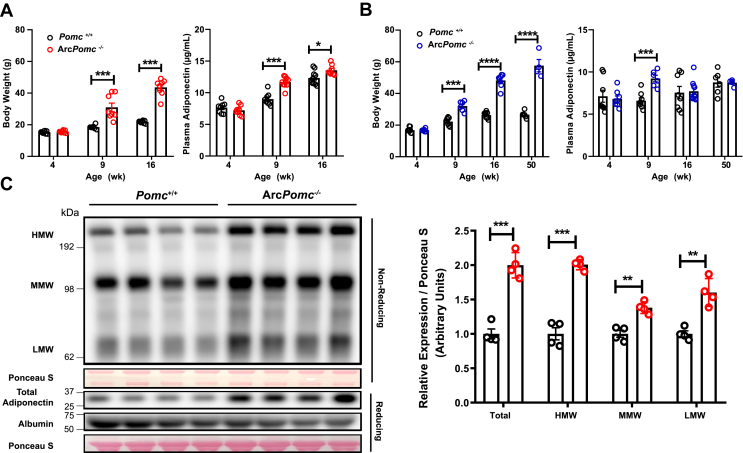
Objective: The steep rise in the prevalence of obesity and its related metabolic syndrome have become a major worldwide health concerns. Melanocortin peptides from hypothalamic arcuate nucleus (Arc) POMC neurons induce satiety to limit food intake. Consequently, Arc Pomc-deficient mice (ArcPomc-/-) exhibit hyperphagia and obesity. Previous studies demonstrated that the circulating levels of adiponectin, a protein abundantly produced and secreted by fat cells, negatively correlate with obesity in both rodents and humans. However, we found that ArcPomc-/- mice have increased circulating adiponectin levels despite obesity. Therefore, we investigated the physiological function and underlying mechanisms of hypothalamic POMC in regulating systemic adiponectin levels.
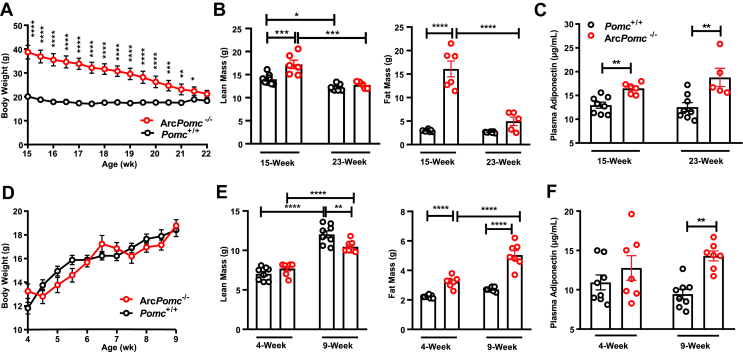
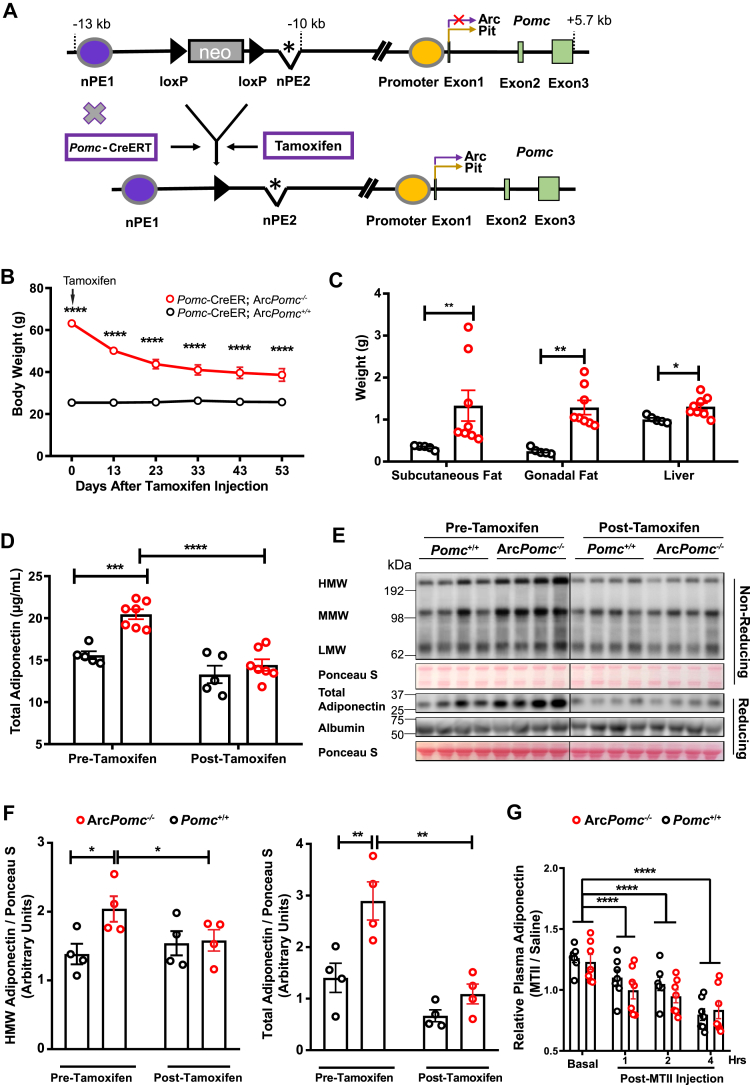
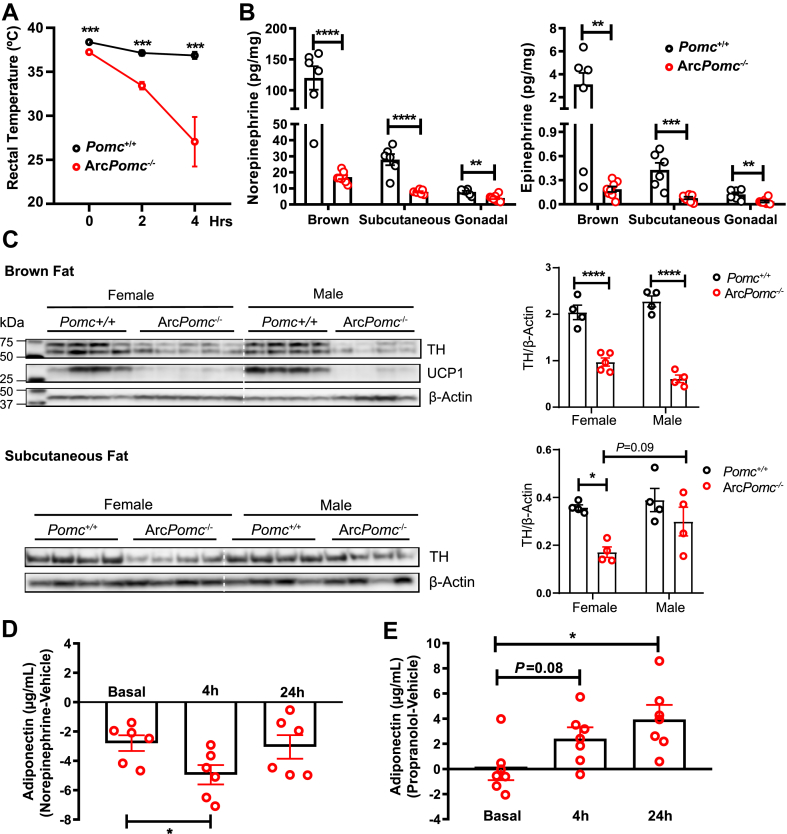
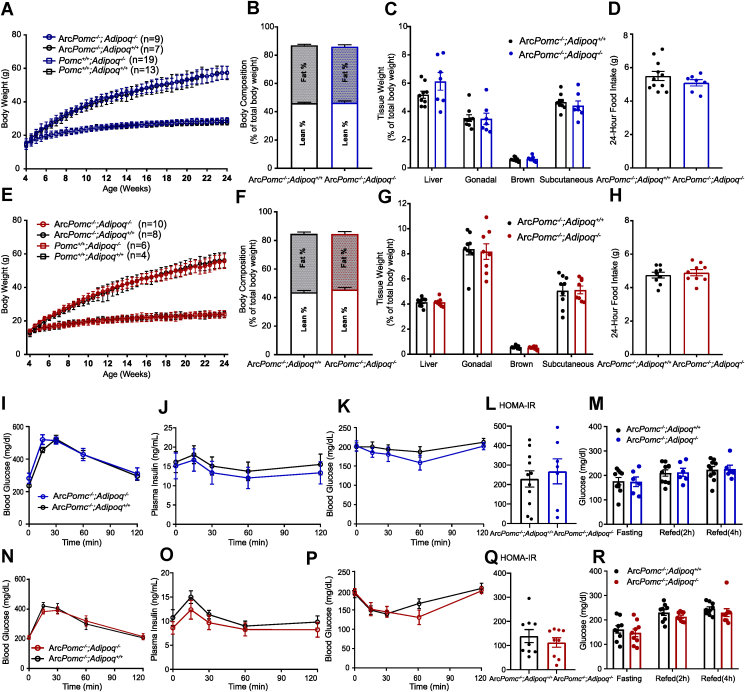
Methods: Circulating adiponectin was measured in obese ArcPomc-/- mice at ages 4-52 weeks. To determine whether increased adiponectin was a direct result of ArcPomc deficiency or a secondary effect of obesity, we examined plasma adiponectin levels in calorie-restricted mice with or without a history of obesity and in ArcPomc-/- mice before and after genetic restoration of Pomc expression in the hypothalamus. To delineate the mechanisms causing increased adiponectin in ArcPomc-/- mice, we determined sympathetic outflow to adipose tissue by assessing epinephrine, norepinephrine, and tyrosine hydroxylase protein levels and measured the circulating adiponectin in the mice after acute norepinephrine or propranolol treatments. In addition, adiponectin mRNA and protein levels were measured in discrete adipose tissue depots to ascertain which fat depots contributed the most to the high level of adiponectin in the ArcPomc-/- mice. Finally, we generated compound Adiopoq-/-:ArcPomc-/- mice and compared their growth, body composition, and glucose homeostasis to the individual knockout mouse strains and their wild-type controls.
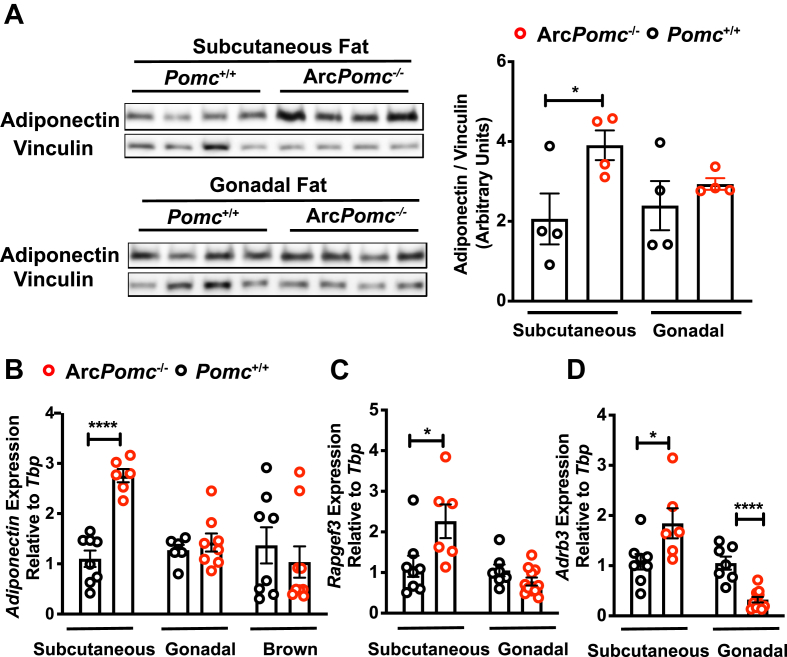
Results: Obese ArcPomc-/- female mice had unexpectedly increased plasma adiponectin compared to wild-type siblings at all ages greater than 8 weeks. Despite chronic calorie restriction to achieve normal body weights, higher adiponectin levels persisted in the ArcPomc-/- female mice. Genetic restoration of Pomc expression in the Arc or acute treatment of the ArcPomc-/- female mice with melanotan II reduced adiponectin levels to control littermate values. The ArcPomc-/- mice had defective thermogenesis and decreased epinephrine, norepinephrine, and tyrosine hydroxylase protein levels in their fat pads, indicating reduced sympathetic outflow to adipose tissue. Injections of norepinephrine into the ArcPomc-/- female mice reduced circulating adiponectin levels, whereas injections of propranolol significantly increased adiponectin levels. Despite the beneficial effects of adiponectin on metabolism, the deletion of adiponectin alleles in the ArcPomc-/- mice did not exacerbate their metabolic abnormalities.
Conclusion: In summary, to the best of our knowledge, this study provides the first evidence that despite obesity, the ArcPomc-/- mouse model has high circulating adiponectin levels, which demonstrated that increased fat mass is not necessarily correlated with hypoadiponectinemia. Our investigation also found a previously unknown physiological pathway connecting POMC neurons via the sympathetic nervous system to circulating adiponectin, thereby shedding light on the biological regulation of adiponectin.
Keywords: Adiponectin; Melanocortin system; POMC; Sympathetic nervous system.
Copyright © 2020 The Author(s). Published by Elsevier GmbH.. All rights reserved.
Figures
Similar articles
-
Hypothalamic POMC Deficiency Improves Glucose Tolerance Despite Insulin Resistance by Increasing Glycosuria.Diabetes. 2016 Mar;65(3):660-72. doi: 10.2337/db15-0804. Epub 2015 Oct 14. Diabetes. 2016. PMID: 26467632 Free PMC article.
-
Systemic pharmacological treatments for chronic plaque psoriasis: a network meta-analysis.Cochrane Database Syst Rev. 2021 Apr 19;4(4):CD011535. doi: 10.1002/14651858.CD011535.pub4. Cochrane Database Syst Rev. 2021. Update in: Cochrane Database Syst Rev. 2022 May 23;5:CD011535. doi: 10.1002/14651858.CD011535.pub5. PMID: 33871055 Free PMC article. Updated.
-
NPAS4 Depletion in POMC Neurons Protects From Obesity and Alters the Feeding-regulated Transcriptome in Male Mice.Endocrinology. 2025 May 19;166(7):bqaf083. doi: 10.1210/endocr/bqaf083. Endocrinology. 2025. PMID: 40296822 Free PMC article.
-
Systemic pharmacological treatments for chronic plaque psoriasis: a network meta-analysis.Cochrane Database Syst Rev. 2017 Dec 22;12(12):CD011535. doi: 10.1002/14651858.CD011535.pub2. Cochrane Database Syst Rev. 2017. Update in: Cochrane Database Syst Rev. 2020 Jan 9;1:CD011535. doi: 10.1002/14651858.CD011535.pub3. PMID: 29271481 Free PMC article. Updated.
-
Signs and symptoms to determine if a patient presenting in primary care or hospital outpatient settings has COVID-19.Cochrane Database Syst Rev. 2022 May 20;5(5):CD013665. doi: 10.1002/14651858.CD013665.pub3. Cochrane Database Syst Rev. 2022. PMID: 35593186 Free PMC article.
Cited by
-
Transcription Coactivator BCL3 Acts as a Potential Regulator of Lipid Metabolism Through the Effects on Inflammation.J Inflamm Res. 2021 Sep 23;14:4915-4926. doi: 10.2147/JIR.S327858. eCollection 2021. J Inflamm Res. 2021. PMID: 34588797 Free PMC article.
-
Alx3 deficiency disrupts energy homeostasis, alters body composition, and impairs hypothalamic regulation of food intake.Cell Mol Life Sci. 2024 Aug 12;81(1):343. doi: 10.1007/s00018-024-05384-z. Cell Mol Life Sci. 2024. PMID: 39129011 Free PMC article.
-
Adiponectin: Role in Physiology and Pathophysiology.Int J Prev Med. 2020 Sep 3;11:136. doi: 10.4103/ijpvm.IJPVM_193_20. eCollection 2020. Int J Prev Med. 2020. PMID: 33088464 Free PMC article. Review.
-
Obesity: Epidemiology, Pathophysiology, and Therapeutics.Front Endocrinol (Lausanne). 2021 Sep 6;12:706978. doi: 10.3389/fendo.2021.706978. eCollection 2021. Front Endocrinol (Lausanne). 2021. PMID: 34552557 Free PMC article. Review.
-
The Roles and Associated Mechanisms of Adipokines in Development of Metabolic Syndrome.Molecules. 2022 Jan 6;27(2):334. doi: 10.3390/molecules27020334. Molecules. 2022. PMID: 35056647 Free PMC article. Review.
References
-
- Cone R.D. Anatomy and regulation of the central melanocortin system. Nature Neuroscience. 2005;8(5):571–578. - PubMed
-
- Costa J.L., Hochgeschwender U., Brennan M. The role of melanocyte-stimulating hormone in insulin resistance and type 2 diabetes mellitus. Treatments in Endocrinology. 2006;5(1):7–13. - PubMed
Publication types
MeSH terms
Substances
Supplementary concepts
Grants and funding
LinkOut - more resources
Full Text Sources
Medical
Molecular Biology Databases
Miscellaneous
