. 2020 Mar 31;21(7):2395.
doi: 10.3390/ijms21072395.

Abnormal Upregulation of GPR17 Receptor Contributes to Oligodendrocyte Dysfunction in SOD1 G93A Mice

Affiliations

Abnormal Upregulation of GPR17 Receptor Contributes to Oligodendrocyte Dysfunction in SOD1 G93A Mice

Elisabetta Bonfanti et al. Int J Mol Sci. .

Abstract

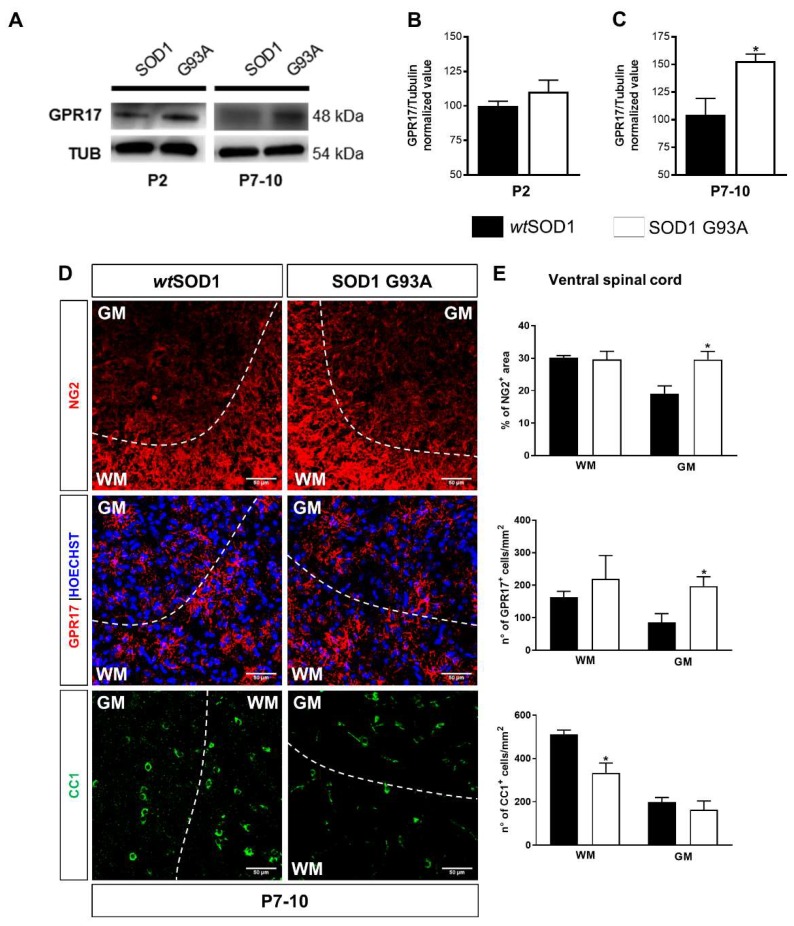
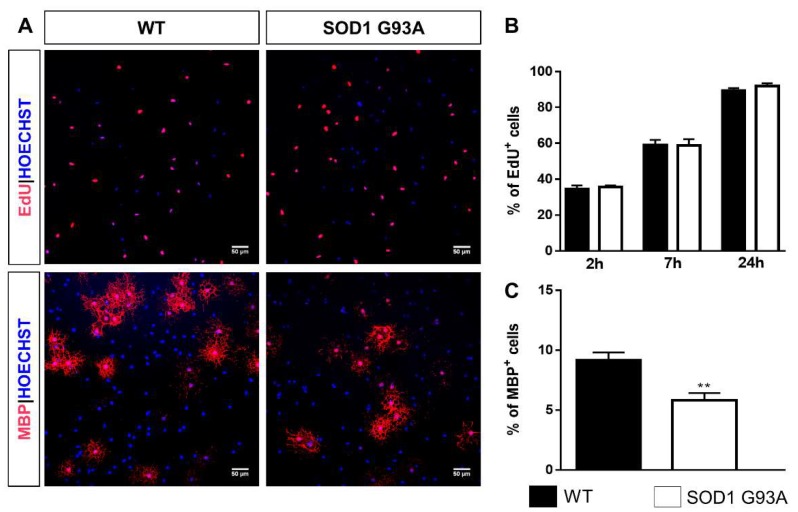
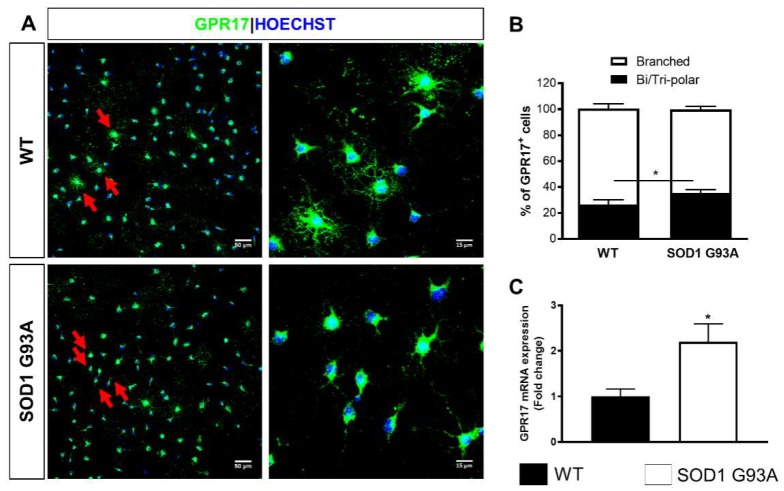
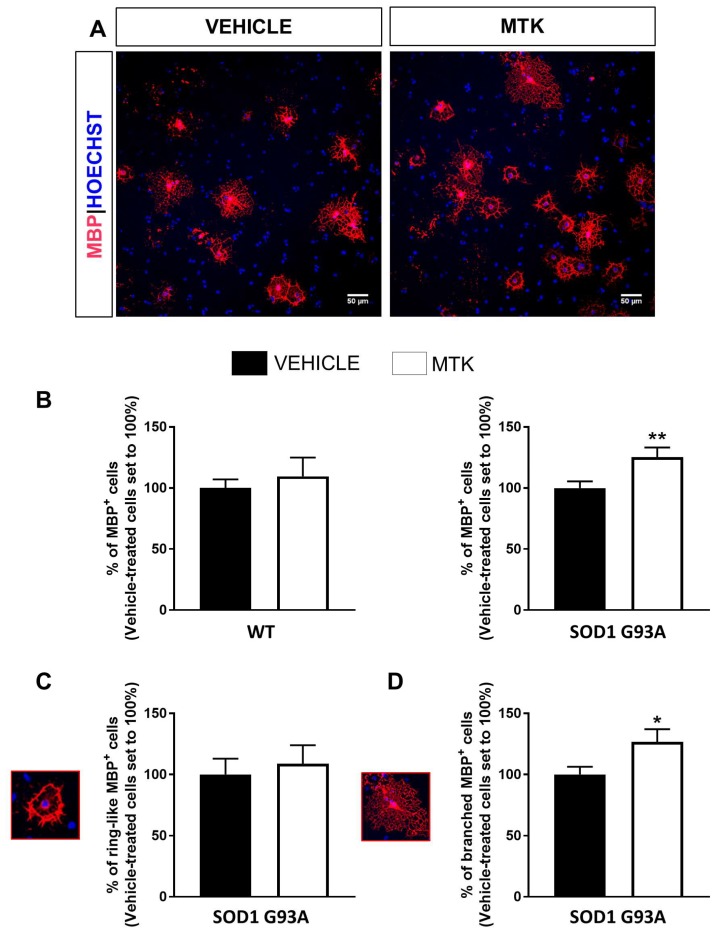
Amyotrophic lateral sclerosis (ALS) is a neurodegenerative disease characterized by progressive loss of motor neurons (MN). Importantly, MN degeneration is intimately linked to oligodendrocyte dysfunction and impaired capacity of oligodendrocyte precursor cells (OPCs) to regenerate the myelin sheath enwrapping and protecting neuronal axons. Thus, improving OPC reparative abilities represents an innovative approach to counteract MN loss. A pivotal regulator of OPC maturation is the P2Y-like G protein-coupled receptor 17 (GPR17), whose role in ALS has never been investigated. In other models of neurodegeneration, an abnormal increase of GPR17 has been invariably associated to myelin defects and its pharmacological manipulation succeeded in restoring endogenous remyelination. Here, we analyzed GPR17 alterations in the SOD1G93A ALS mouse model and assessed in vitro whether this receptor could be targeted to correct oligodendrocyte alterations. Western-blot and immunohistochemical analyses showed that GPR17 protein levels are significantly increased in spinal cord of ALS mice at pre-symptomatic stage; this alteration is exacerbated at late symptomatic phases. Concomitantly, mature oligodendrocytes degenerate and are not successfully replaced. Moreover, OPCs isolated from spinal cord of SOD1G93A mice display defective differentiation compared to control cells, which is rescued by treatment with the GPR17 antagonist montelukast. These data open novel therapeutic perspectives for ALS management.

Keywords: G protein-coupled receptor 17 (GPR17); SOD1G93A ALS mouse model; amyotrophic lateral sclerosis (ALS); montelukast; oligodendrocytes.


Conflict of interest statement

The authors declare no conflict of interest.

Figures

Figure A1
Figure A1
Set up and characterization of primary purified OPCs from spinal cord of P7 wild-type mice. (A) Representative experimental protocol scheme for OPC cultures. (B) Graph shows the quantification of the percentage of NG2, GPR17 and MBP positive cells at different time points during OPC differentiation. Data are the mean of cell counts from a total of 3 coverslips/condition from seven independent experiments. (C) Representative images of cells fixed at DIV2, DIV3, DIV4 and DIV5 showing double immunostaining for GPR17 together with either NG2 or MBP. Hoechst33258 was used to label cell nuclei. Scale bar: 50 μm. Insets show higher magnification of representative GPR17+ cells at different stages of differentiation process, appearing with different morphologies. Scale bar: 25 μm. (D) Representative images of OLIG2 staining in primary OPC cultures from spinal cord of WT and SOD1G93A mice. Hoechst33258 was used to label cell nuclei. Scale bar: 50 μm. (E) Histograms showing the quantification of the percentage of OLIG2+ cells in OPC cultures from WT and SOD1G93A mice. Data are the mean ± SE of cell counts from at least 3 coverslips/condition from 2 independent experiments.
Figure 1
Figure 1
GPR17 expression is increased in spinal cord of SOD1G93A mice. (AC) Representative images and quantifications of GPR17 protein levels analyzed by western blot in lumbar (A), thoracic (B), and cervical (C) spinal cord of wtSOD1 and SOD1G93A mice at P30, P90, and P120. Histograms show the results of densitometric analysis. Data are expressed as mean ± SE (n = 6); * p < 0.05; ** p < 0.01 SOD1G93A vs. wtSOD1, non-parametric Mann–Whitney test. (D) Representative images of GPR17 staining in the ventral lumbar spinal cord of wtSOD1 and SOD1G93A mice at pre-symptomatic stage P30, early symptomatic stage P90 and late symptomatic stage P120. Dashed line separates white matter (WM) and grey matter (GM). Hoechst 33258 was used to label cell nuclei. Scale bar: 50 µm. (E) Histograms show the quantitative analysis of the density of GPR17+ cells in WM and in GM of the ventral spinal cord (n = 3; 2/3 sections for animal). * p < 0.05 SOD1G93A vs wtSOD1; Student’s t-test.
Figure 2
Figure 2
Alterations of mature oligodendroglial cells in lumbar spinal cord of SOD1G93A mice. (A) Representative images of CC1 staining in the ventral lumbar spinal cord of wtSOD1 and SOD1G93A mice at pre-symptomatic stage P30, early symptomatic stage P90 and late symptomatic stage P120. Hoechst 33258 was used to label cell nuclei. Dashed line separates white matter (WM) and grey matter (GM). Scale bar: 50 µm. (B) Histograms show the quantitative analysis of the density of CC1+ cells in WM and in GM of the ventral lumbar spinal cord (n = 3). * p < 0.05, SOD1G93A vs wtSOD1; Student’s t-test.
Figure 3
Figure 3
Increase of GPR17 and NG2 expression and impaired oligodendroglial maturation in the developing spinal cord of SOD1G93A mice. (AC) Representative images and quantifications of GPR17 protein levels analyzed by western blot in the total spinal cord of wtSOD1 and SOD1G93A mice at developmental stages P2 and P7-10. Histograms show the results of densitometric analysis, data are expressed as mean ± SE. (n = 7 wtSOD1 mice and n = 5 SOD1G93A mice); * p < 0.05, compared to wtSOD1, non-parametric Mann–Whitney test. (D) Representative images of NG2, GPR17, and CC1 staining in the ventral spinal cord of wtSOD1 and SOD1G93A mice at P7-10. Dashed line separates white matter (WM) and grey matter (GM). Scale bar: 50 µm. (E) Histograms show results of the densitometric analysis of the NG2 staining and of GPR17 and CC1 cell density in WM and in GM of ventral spinal cord (n = 3). * p < 0.05 SOD1G93A vs wtSOD1; Student’s t-test.
Figure 4
Figure 4
OPCs isolated from P7 SOD1G93A mice exhibit alterations in differentiation capabilities. (A) Representative images showing cells from both WT and SOD1G93A OPC cultures that have incorporated EdU in their nuclei or have acquired a mature phenotype (MBP+ cells). Hoechst33258 was used to label cell nuclei. Scale bar: 50 µm. (B) Histograms showing the quantification of the percentage of proliferating cells after 2, 7, or 24 h treatment with EdU. Data are the mean ± SE of cell counts from at least three coverslips/conditions from three independent experiments. (C) Histograms showing the quantification of the percentage of MBP+ cells in OPC cultures from WT and SOD1G93A mice. Data are the mean ± SE of cell counts from at least three coverslips/condition from four independent experiments. ** p < 0.01 SOD1G93A vs WT; Student’s t-test.
Figure 5
Figure 5
OPCs isolated from P7 SOD1G93A mice are blocked at immature GPR17+ stage. (A) Representative images showing GPR17+ cells in WT and in SOD1G93A OPC cultures. Insets show higher magnification of representative GPR17+ cells with branched (in WT cultures) or with bi/tripolar morphology (in SOD1G93A cultures). Arrows indicate GPR17+ cells with highly ramified or bipolar/tripolar morphology. Scale bar: 50–15 µm. (B) Stacked histograms showing the quantification of the bipolar/tripolar and the branched GPR17+ cells. Data are the mean ± SE of cell counts from a total of six coverslips/condition from three experiments. * p < 0.05 SOD1G93A vs. WT; Student’s t-test. (C) Histograms showing GPR17 mRNA level quantification by qRT-PCR in SODG93A cultures with respect to WT cultures (n = 3). * p < 0.05 SOD1G93A vs. WT; Student’s t-test.
Figure 6
Figure 6
Montelukast increases differentiation in OPCs isolated from spinal cord of SOD1G93A mice. (A) Representative images showing MBP+ cells in SOD1G93A cultures exposed to montelukast (MTK) or vehicle. Hoechst33258 was used to label cell nuclei. Scale bar: 50 µm. (B) Histograms showing the quantification of the percentage of MBP+ cells in cultures from WT and SOD1G93A mice exposed to MTK or vehicle (n = 6–8 coverslips from three independent experiments). Data are expressed as mean ± SE and vehicle-treated cells have been set to 100%. ** p < 0.01 SOD1G93A MTK vs. vehicle, Student’s t-test. (C) Graph showing the percentage of MBP+ cells with ring-like morphology in SOD1G93A cultures exposed to MTK or vehicle (n = 7 coverslips form three independent experiments). Data are expressed as mean ± SE and vehicle-treated cells have been set to 100%. (D) Graph showing the percentage of MBP+ cells with branched morphology in SOD1G93A cultures exposed to MTK or vehicle (n = 7 coverslips form three independent experiments). Data are expressed as mean ± SE and vehicle-treated cells have been set to 100%. * p < 0.05 MTK vs vehicle, Student’s t-test.

Similar articles

Cited by

References

    1. Eisen A. Amyotrophic lateral sclerosis-evolutionary and other perspectives. Muscle Nerve. 2009;40:297–304. doi: 10.1002/mus.21404. - DOI - PubMed
    1. Hayashi Y., Homma K., Ichijo H. SOD1 in neurotoxicity and its controversial roles in SOD1 mutation-negative ALS. Adv. Biol. Regul. 2016;60:95–104. doi: 10.1016/j.jbior.2015.10.006. - DOI - PubMed
    1. Rafałowska J., Dziewulska D. White matter injury in amyotrophic lateral sclerosis (ALS) Folia Neuropathol. 1996;34:87–91. - PubMed
    1. Mollink J., Hiemstra M., Miller K.L., Huszar I.N., Jenkinson M., Raaphorst J., Wiesmann M., Ansorge O., Pallebage-Gamarallage M., van Cappellen van Walsum A.M. White matter changes in the perforant path area in patients with amyotrophic lateral sclerosis. Neuropathol. Appl. Neurobiol. 2019;45:570–585. doi: 10.1111/nan.12555. - DOI - PMC - PubMed
    1. Serio A., Patani R. Concise Review: The Cellular Conspiracy of Amyotrophic Lateral Sclerosis. Stem Cells. 2018;36:293–303. doi: 10.1002/stem.2758. - DOI - PubMed

MeSH terms