Review
. 2020 Mar 31;9(4):843.
doi: 10.3390/cells9040843.

The Cuprizone Model: Dos and Do Nots

Affiliations
Review

The Cuprizone Model: Dos and Do Nots

Jiangshan Zhan et al. Cells. .

Abstract

Multiple sclerosis (MS) is a chronic inflammatory demyelinating disease of the central nervous system. Various pre-clinical models with different specific features of the disease are available to study MS pathogenesis and to develop new therapeutic options. During the last decade, the model of toxic demyelination induced by cuprizone has become more and more popular, and it has contributed substantially to our understanding of distinct yet important aspects of the MS pathology. Here, we aim to provide a practical guide on how to use the cuprizone model and which pitfalls should be avoided.

Keywords: cuprizone model; histological analyses; multiple sclerosis.


Conflict of interest statement

The authors declare no conflict of interest.

Figures

Figure 1
Figure 1
Hallmarks of the cuprizone model. (A) Schematic drawing illustrating pathological hallmarks during the course of cuprizone-induced demyelination. The blue line illustrates the levels of myelination. (B) The left image illustrates interfascicular oligodendrocytes (arrowheads) in the corpus callosum of a control mouse. The center image illustrates the appearance of an apoptotic cell (arrow) after 1 week of cuprizone intoxication. The right image illustrates mature OLIG2+/CC1+ oligodendrocytes and pre-mature OLIG2+/CC1 oligodendrocytes (white arrowheads). Scale bar = 10 µm. Abbreviations: oligodendrocyte transcription factor 2 (OLIG2), adenomatous polyposis coli gene clone CC1 (CC1).
Figure 2
Figure 2
Oligodendrocyte stress and degeneration. (A) Different appearances of apoptotic oligodendrocytes in the white matter corpus callosum and grey matter cortex. The left image illustrates the appearance of an apoptotic cell (arrowhead) in the corpus callosum after 1 week of cuprizone intoxication. The center image illustrates a perineuronal oligodendrocyte in the cortex of a control mouse. The right image illustrates an apoptotic perineuronal oligodendrocyte. Perineuronal oligodendrocytes are also called “satellite oligodendrocytes”. Scale bar = 10 µm. (B) Expression of the stress transcription factor ATF3 in control animals and in mice intoxicated with cuprizone for 4 days. White arrowheads highlight a stressed APC+ oligodendrocyte. Scale bar = 10 µm (upper row) and 5 µm (lower row). Abbreviations: activating transcription factor 3 (ATF3).
Figure 3
Figure 3
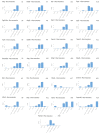
Cellular expression signature. Cellular enrichment of the top 25 downregulated mRNAs as shown in Table 1, retrieved from Brain RNA-Seq database [36]; # represents rank number. Full-size image see Supplementary Figure S1. Abbreviations: myelin oligodendrocyte glycoprotein (Mog), protein phosphatase 1 regulatory inhibitor subunit 14A (Ppp1r14a), fatty acid 2-hydroxylase (Fa2h), transmembrane protein 63A (Tmem63a), kallikrein related peptidase 6 (Klk6), EF-hand domain family member D1 (Efhd1), peptidyl arginine deiminase 2 (Padi2), sphingosine-1-phosphate receptor 5 (S1pr5), UDP galactosyltransferase 8A (Ugt8a), myelin-associated glycoprotein (Mag), myelin and lymphocyte protein (Mal), phosphatidylinositol glycan anchor biosynthesis class Z (Pigz), gelsolin (Gsn), guanidinoacetate N-methyltransferase (Gamt), carnosine synthase 1 (Carns1), nerve injury-induced protein 2 (Ninj2), thrombospondin 4 (Thbs4), tweety family member 2 (Ttyh2), carboxypeptidase M (Cpm), gap junction protein gamma 2 (Gjc2), tetraspanin 2 (Tspan2), NIPA-like domain containing 4 (Nipal4), CKLF-like MARVEL transmembrane domain containing 5 (Cmtm5), transmembrane protein 98 (Tmem98), and plexin B3 (Plxnb3).
Figure 4
Figure 4
Demyelination and microgliosis. (A) Demyelination and microglia activation during the course of cuprizone-induced demyelination. Myelin was visualized by anti-PLP immunohistochemistry (upper row) and LFB/PAS (center row). Microglia activation was visualized by anti-IBA1 immunohistochemistry (lower row). Scale bar = 100 µm. (B) The principle of quantifying microglia morphology by calculating a ramification index. The maximum projection area Ap and the cell area Ac are measured. Resting microglia have a relatively large maximum projection area Ap, but a relatively small cell area Ac. In that case, the ramification index Ri has a high value. During their activation, microglia retract their fine processes, and both the cell bodies and processes become hypertrophic. In that case, Ri approaches a value close to 1 (exactly 1 in the case of a perfectly round cell with equal values for Ap and Ac). Scale bar = 5 µm. Abbreviations: myelin proteolipid protein (PLP), Luxol fast blue/periodic acid-Schiff stains (LFB/PAS), and ionized calcium-binding adapter molecule 1 (IBA1). (C) Toluidine blue-stained semithin sections in control and cuprizone mice. The arrowhead and arrow indicate transverse or longitudinal sections of an axon, respectively. Scale bar = 50 µm.
Figure 5
Figure 5
Astrocyte morphology. (A) Two anti-GFAP positive cells are demonstrated. Cell 1 shows anti-GFAP immunoreactivity within the entire perinuclear space, which allows for clear definition of the astrocytic cell body. Cell 2 shows anti-GFAP immunoreactivity at just one site of the cell body, making it difficult to clearly delineate the astrocyte cell body (highlighted by arrowheads). Scale bar = 20 µm (center), 10 µm (left, right). (B) Expression of the mitochondrial protein TSPO (red) in eGFP-expressing astrocytes. Adopted from [48]. Scale-bar = 25 µm. Abbreviations: glial fibrillary acidic protein (GFAP), translocator protein (TSPO), enhanced green fluorescent protein (eGFP).
Figure 6
Figure 6
Acute axonal injury. (A) Acute axonal injury after 5 weeks of cuprizone intoxication, visualized by anti-APP stains. Arrowheads in the left image highlight APP spheroids. Arrowheads in the right image highlight small APP+ particles in close vicinity to a cell nucleus. These small APP+ particles might belong to glia cells rather than axons. (B) Acute axonal injury visualized by the two mitochondrial-specific antibodies anti-VDAC1 and anti-COX4, as well as the synaptic protein specific antibody anti-GLT1. Arrowheads highlight the sites of acute axonal injury, indicated by a breakdown of the anterograde axonal transport machinery. Scale bar = 30 µm. Abbreviations: amyloid precursor protein (APP), voltage-dependent anion-selective channel 1 (VDAC1), cytochrome c oxidase subunit 4 (COX4), glutamate transporter 1 (GLT1).
Figure 7
Figure 7
Topographical aspects. (A) Principal regions suggested by the authors for histopathological analyses. As shown in the right image, the tip of the cingulum provides a good anatomical border to delineate the lateral border of the midline of the corpus callosum at the level of the anterior commissure (i.e., R215). Scale-bar = 1300 µm (left, center); 150 µm (right). (B) Overview of anti-PLP stained sections at the level of the rostral hippocampus from control and 5 week cuprizone-intoxicated mice. The arrowheads highlight severe demyelination of the midline corpus callosum. Scale bar = 650 µm. (C) Overview and high magnification of anti-PLP stained sections from control and 5 week cuprizone-intoxicated mice. Arrowheads highlight the fornix, which is somewhat resistant to the cuprizone intoxication. Scale bar = 300 µm (left column); 600 µm (right column). Abbreviations: myelin proteolipid protein (PLP).

Similar articles

Cited by

References

    1. Carassiti D., Altmann D.R., Petrova N., Pakkenberg B., Scaravilli F., Schmierer K. Neuronal loss, demyelination and volume change in the multiple sclerosis neocortex. Neuropathol. Appl. Neurobiol. 2018;44:377–390. doi: 10.1111/nan.12405. - DOI - PubMed
    1. Dutta R., Chang A., Doud M.K., Kidd G.J., Ribaudo M.V., Young E.A., Fox R.J., Staugaitis S.M., Trapp B.D. Demyelination causes synaptic alterations in hippocampi from multiple sclerosis patients. Ann. Neurol. 2011;69:445–454. doi: 10.1002/ana.22337. - DOI - PMC - PubMed
    1. Jurgens T., Jafari M., Kreutzfeldt M., Bahn E., Bruck W., Kerschensteiner M., Merkler D. Reconstruction of single cortical projection neurons reveals primary spine loss in multiple sclerosis. Brain. 2016;139:39–46. doi: 10.1093/brain/awv353. - DOI - PubMed
    1. Trapp B.D., Peterson J., Ransohoff R.M., Rudick R., Mork S., Bo L. Axonal transection in the lesions of multiple sclerosis. New Engl. J. Med. 1998;338:278–285. doi: 10.1056/NEJM199801293380502. - DOI - PubMed
    1. Peterson J.W., Bo L., Mork S., Chang A., Trapp B.D. Transected neurites, apoptotic neurons, and reduced inflammation in cortical multiple sclerosis lesions. Ann. Neurol. 2001;50:389–400. doi: 10.1002/ana.1123. - DOI - PubMed

Publication types

MeSH terms