

Transcriptome Profiling and Toxicity Following Long-Term, Low Dose Exposure of Human Lung Cells to Ni and NiO Nanoparticles-Comparison with NiCl2
- PMID: 32244462
- PMCID: PMC7221965
- DOI: 10.3390/nano10040649
Transcriptome Profiling and Toxicity Following Long-Term, Low Dose Exposure of Human Lung Cells to Ni and NiO Nanoparticles-Comparison with NiCl2
Abstract
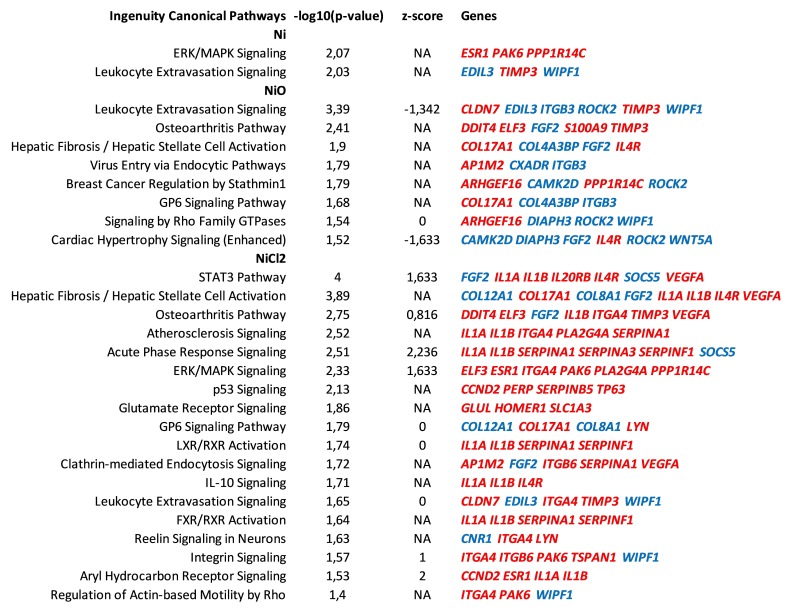
Production of nickel (Ni) and nickel oxide (NiO) nanoparticles (NPs) leads to a risk of exposure and subsequent health effects. Understanding the toxicological effects and underlying mechanisms using relevant in vitro methods is, therefore, needed. The aim of this study is to explore changes in gene expression using RNA sequencing following long term (six weeks) low dose (0.5 µg Ni/mL) exposure of human lung cells (BEAS-2B) to Ni and NiO NPs as well as soluble NiCl2. Genotoxicity and cell transformation as well as cellular dose of Ni are also analyzed. Exposure to NiCl2 resulted in the largest number of differentially expressed genes (197), despite limited uptake, suggesting a major role of extracellular receptors and downstream signaling. Gene expression changes for all Ni exposures included genes coding for calcium-binding proteins (S100A14 and S100A2) as well as TIMP3, CCND2, EPCAM, IL4R and DDIT4. Several top enriched pathways for NiCl2 were defined by upregulation of, e.g., interleukin-1A and -1B, as well as Vascular Endothelial Growth Factor A (VEGFA). All Ni exposures caused DNA strand breaks (comet assay), whereas no induction of micronuclei was observed. Taken together, this study provides an insight into Ni-induced toxicity and mechanisms occurring at lower and more realistic exposure levels.
Keywords: RNA sequencing; genotoxicity; long-term exposure; nickel nanoparticles.
Conflict of interest statement
The funders had no role in the design of the study; in the collection, analyses, or interpretation of data; in the writing of the manuscript, or in the decision to publish the results.
Figures


Similar articles
-
Calcium-dependent cyto- and genotoxicity of nickel metal and nickel oxide nanoparticles in human lung cells.Part Fibre Toxicol. 2018 Jul 17;15(1):32. doi: 10.1186/s12989-018-0268-y. Part Fibre Toxicol. 2018. PMID: 30016969 Free PMC article.
-
Genotoxic and mutagenic properties of Ni and NiO nanoparticles investigated by comet assay, γ-H2AX staining, Hprt mutation assay and ToxTracker reporter cell lines.Environ Mol Mutagen. 2018 Apr;59(3):211-222. doi: 10.1002/em.22163. Epub 2017 Dec 15. Environ Mol Mutagen. 2018. PMID: 29243303 Free PMC article.
-
Inflammation and (secondary) genotoxicity of Ni and NiO nanoparticles.Nanotoxicology. 2019 Oct;13(8):1060-1072. doi: 10.1080/17435390.2019.1640908. Epub 2019 Jul 19. Nanotoxicology. 2019. PMID: 31322448
-
Comparative effectiveness of NiCl2, Ni- and NiO-NPs in controlling oral bacterial growth and biofilm formation on oral surfaces.Arch Oral Biol. 2013 Dec;58(12):1804-11. doi: 10.1016/j.archoralbio.2013.09.011. Epub 2013 Oct 5. Arch Oral Biol. 2013. PMID: 24200307
-
Nickel Oxide Nanoparticles Induced Transcriptomic Alterations in HEPG2 Cells.Adv Exp Med Biol. 2018;1048:163-174. doi: 10.1007/978-3-319-72041-8_10. Adv Exp Med Biol. 2018. PMID: 29453538 Review.
Cited by
-
Toxicity of Metal Oxide Nanoparticles: Looking through the Lens of Toxicogenomics.Int J Mol Sci. 2023 Dec 30;25(1):529. doi: 10.3390/ijms25010529. Int J Mol Sci. 2023. PMID: 38203705 Free PMC article.
-
Nickel nanoparticles induce epithelial-mesenchymal transition in human bronchial epithelial cells via the HIF-1α/HDAC3 pathway.Nanotoxicology. 2022 Aug-Oct;16(6-8):695-712. doi: 10.1080/17435390.2022.2142169. Epub 2022 Nov 7. Nanotoxicology. 2022. PMID: 36345150 Free PMC article.
-
In Vitro Approaches to Determine the Potential Carcinogenic Risk of Environmental Pollutants.Int J Mol Sci. 2023 Apr 25;24(9):7851. doi: 10.3390/ijms24097851. Int J Mol Sci. 2023. PMID: 37175558 Free PMC article. Review.
-
Lung Cell Toxicity of Metal-Containing Nanoparticles.Nanomaterials (Basel). 2022 Sep 2;12(17):3044. doi: 10.3390/nano12173044. Nanomaterials (Basel). 2022. PMID: 36080081 Free PMC article.
-
In Vitro Cell Transformation Assays: A Valuable Approach for Carcinogenic Potentiality Assessment of Nanomaterials.Int J Mol Sci. 2023 May 4;24(9):8219. doi: 10.3390/ijms24098219. Int J Mol Sci. 2023. PMID: 37175926 Free PMC article. Review.
References
Grants and funding
LinkOut - more resources
Full Text Sources
Research Materials
Miscellaneous
