

Epidemiological Characteristics and Spatiotemporal Trend Analysis of Human Brucellosis in China, 1950-2018
- PMID: 32244493
- PMCID: PMC7178157
- DOI: 10.3390/ijerph17072382
Epidemiological Characteristics and Spatiotemporal Trend Analysis of Human Brucellosis in China, 1950-2018
Abstract
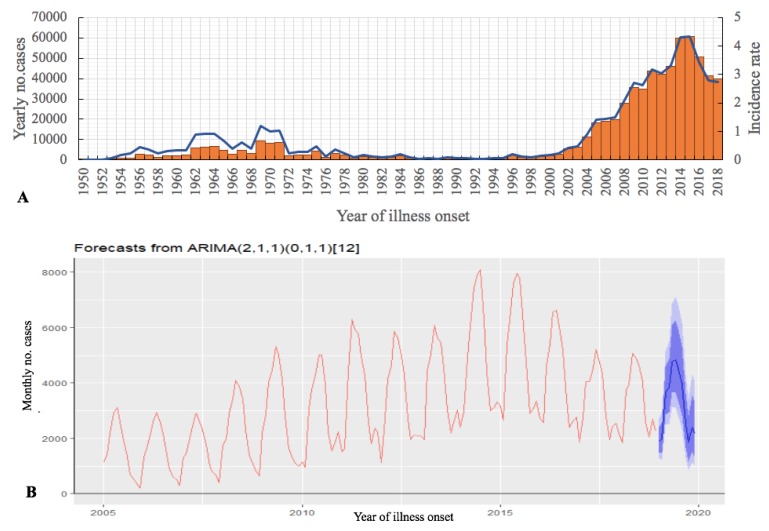
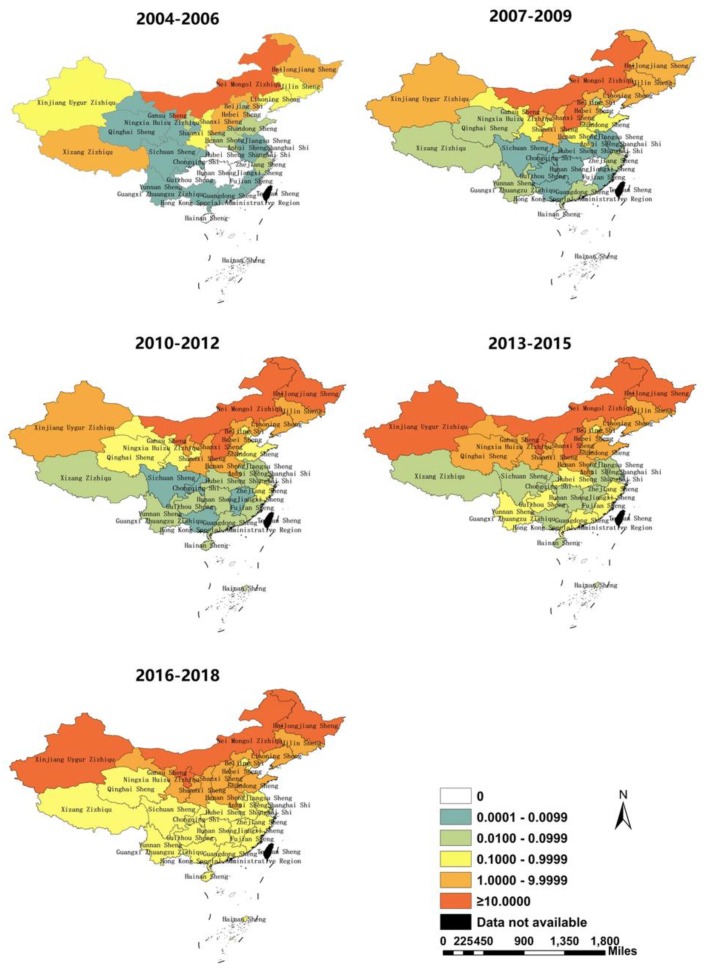
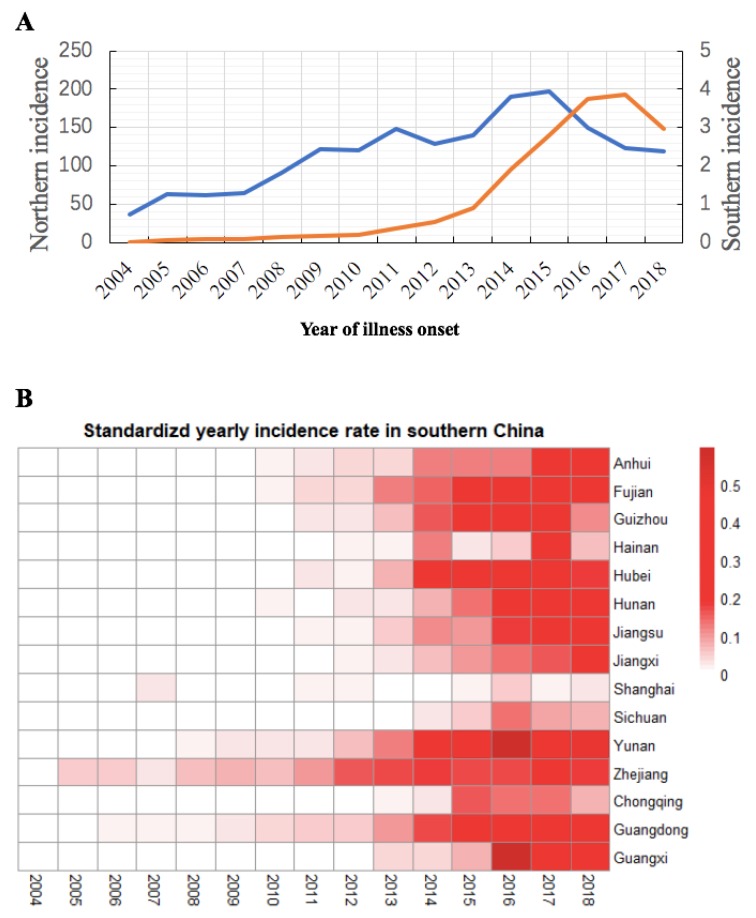
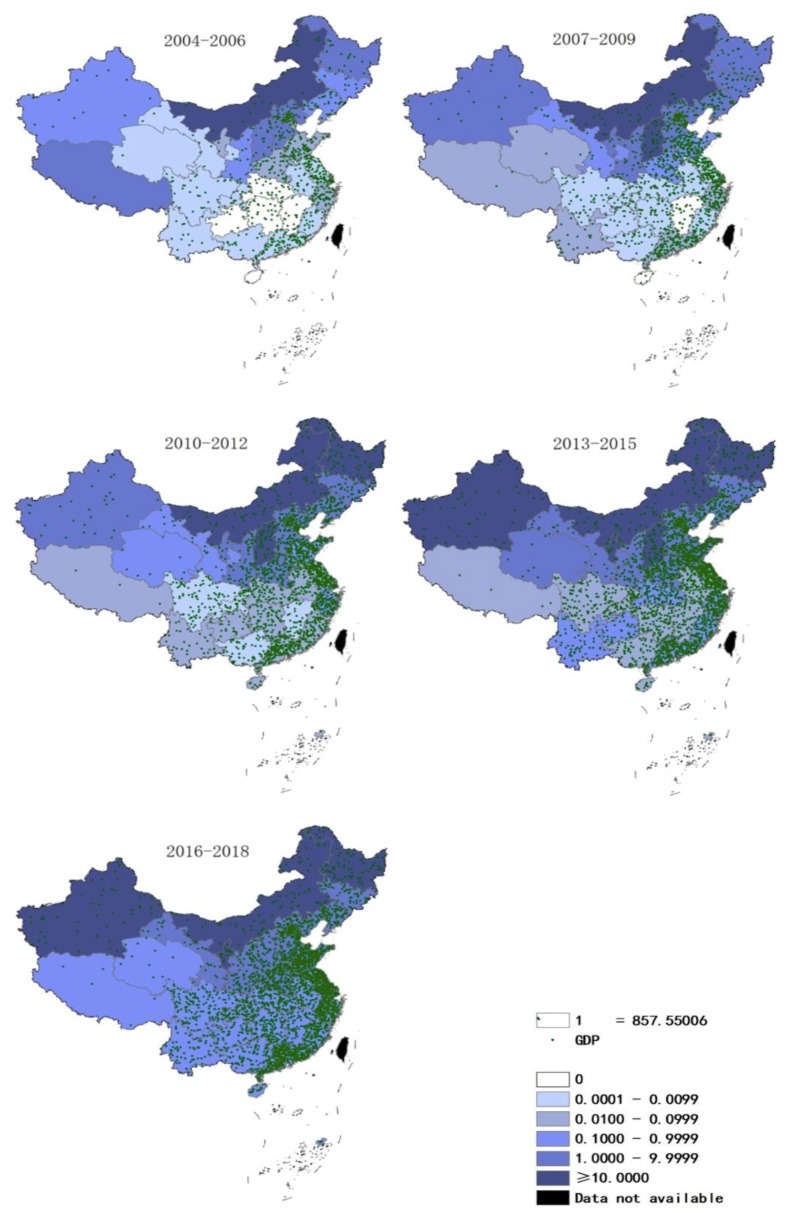
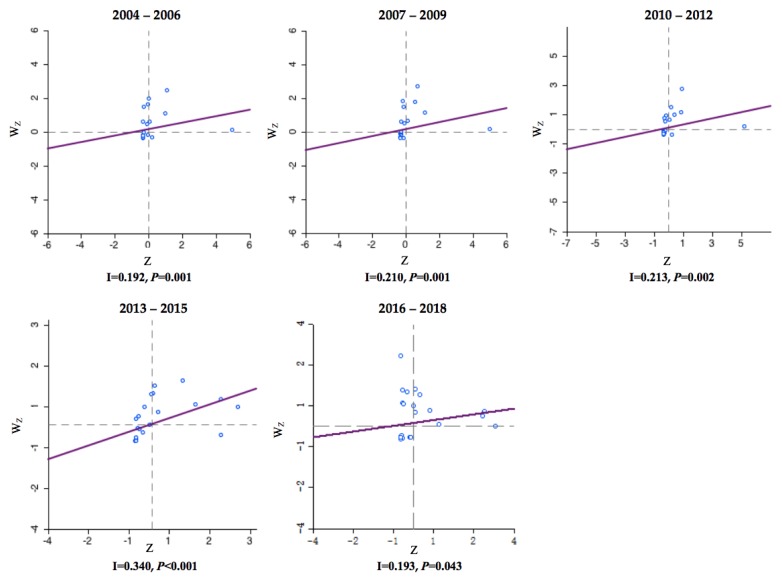
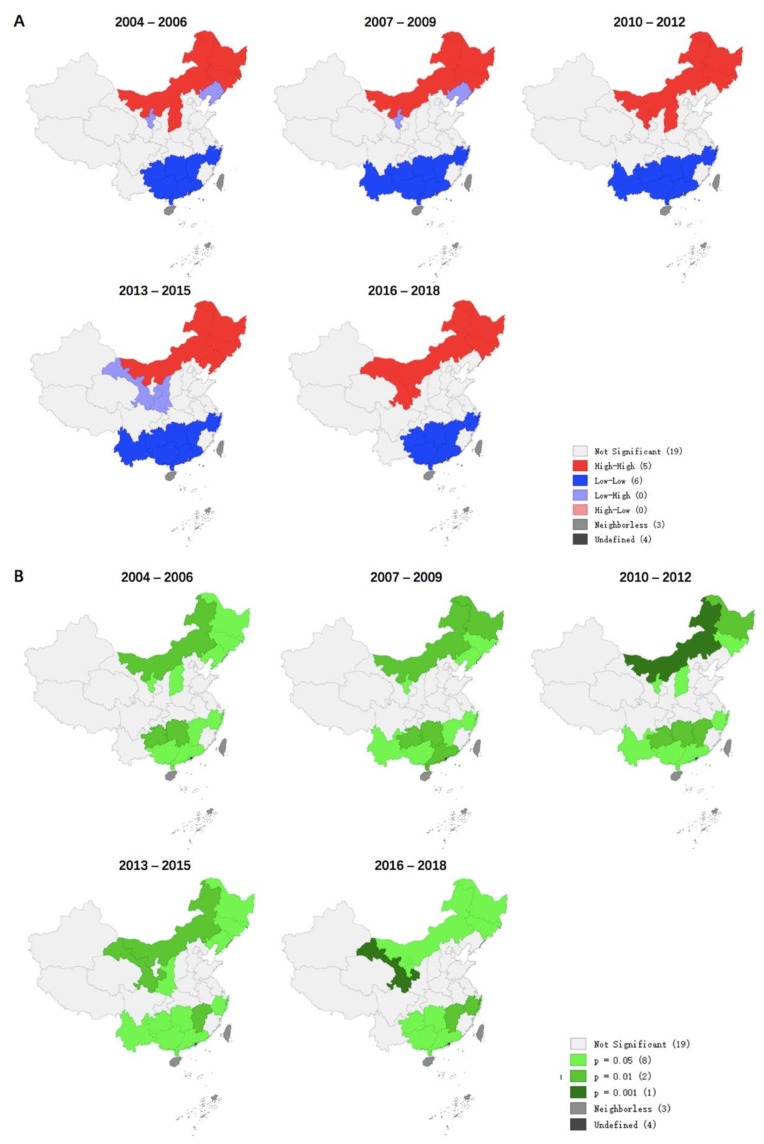
The rate of brucellosis, a zoonotic disease, has rapidly increased in humans brucellosis(HB) in recent years. In 1950-2018, a total of 684,380 HB cases (median 2274/year (interquartile range (IQR) 966-8325)) were reported to the National Infectious Disease Surveillance System in mainland China. The incidence of HB peaked in 2014 (4.32/100,000), and then showed a downward trend; we predict that it will maintain a steady downward trend in 2019-2020. Since 2015, the incidence of HB has shown opposite trends in the north and south of China; rates in the north have fallen and rates in the south have increased. In 2004-2018, the most significant increases in incidence of HB were in Yunnan (IQR 0.002-0.463/100,000), Hubei (IQR 0.000-0.338/100,000), and Guangdong (IQR 0.015-0.350/100,000). The areas where HB occurs have little overlap with areas with high per capita GDP in China. The "high-high" clusters of HB are located in northeastern China (Inner Mongolia, Heilongjiang, Jilin, Liaoning, Ningxia, Shanxi, and Gansu), and the "low-low" clusters of HB are located in southern China (Yunnan, Jiangxi, Shanghai, Guangxi, Guangdong, Zhejiang, Guizhou, and Hunan). In recent years, the incidence of HB in China has been controlled to some extent, but the incidence of HB has increased in southern China, and the disease has spread geographically in China from north to south. Further research is needed to address this change and to continue to explore the relationship between the incidence of HB and relevant factors.
Keywords: China; GDP; brucellosis; epidemiology; humans; spatiotemporal trend; zoonoses.
Conflict of interest statement
The authors declare that no conflict of interest exists regarding this work. The funders had no role in the design of the study; in the collection, analyses, or interpretation of data; in the writing of the manuscript, and in the decision to publish the results. The statements and conclusions in this report are those of the authors and do not necessarily represent the official position of the Centers for Disease Control and Prevention.
Figures
Similar articles
-
Spatiotemporal dynamics and influencing factors of human brucellosis in Mainland China from 2005-2021.BMC Infect Dis. 2024 Jan 11;24(1):76. doi: 10.1186/s12879-023-08858-w. BMC Infect Dis. 2024. PMID: 38212685 Free PMC article.
-
Epidemiological characteristics and spatio-temporal clusters of human brucellosis in Inner Mongolia, 2010-2021.BMC Infect Dis. 2024 Nov 20;24(1):1321. doi: 10.1186/s12879-024-10165-x. BMC Infect Dis. 2024. PMID: 39567873 Free PMC article.
-
[Malaria situation in the People's Republic of China in 2002].Zhongguo Ji Sheng Chong Xue Yu Ji Sheng Chong Bing Za Zhi. 2003;21(4):193-6. Zhongguo Ji Sheng Chong Xue Yu Ji Sheng Chong Bing Za Zhi. 2003. PMID: 14628361 Chinese.
-
Human brucellosis in the People's Republic of China during 2005-2010.Int J Infect Dis. 2013 May;17(5):e289-92. doi: 10.1016/j.ijid.2012.12.030. Epub 2013 Feb 23. Int J Infect Dis. 2013. PMID: 23462301 Review.
-
Brucellosis seroprevalence in dairy cattle in China during 2008-2018: A systematic review and meta-analysis.Acta Trop. 2019 Jan;189:117-123. doi: 10.1016/j.actatropica.2018.10.002. Epub 2018 Oct 9. Acta Trop. 2019. PMID: 30308207
Cited by
-
Spatiotemporal risk of human brucellosis under intensification of livestock keeping based on machine learning techniques in Shaanxi, China.Epidemiol Infect. 2024 Oct 24;152:e132. doi: 10.1017/S0950268824001018. Epidemiol Infect. 2024. PMID: 39444373 Free PMC article.
-
Human Brucellosis in the Rural and Urban Population of Pakistan: Seroprevalence, Risk Factors, and Clinical Manifestations.Curr Microbiol. 2025 Jan 11;82(2):80. doi: 10.1007/s00284-025-04063-x. Curr Microbiol. 2025. PMID: 39797980
-
Spatiotemporal dynamics and influencing factors of human brucellosis in Mainland China from 2005-2021.BMC Infect Dis. 2024 Jan 11;24(1):76. doi: 10.1186/s12879-023-08858-w. BMC Infect Dis. 2024. PMID: 38212685 Free PMC article.
-
Comparison of two surgical interventions for lumbar brucella spondylitis in adults: a retrospective analysis.Sci Rep. 2023 Oct 4;13(1):16684. doi: 10.1038/s41598-023-43812-5. Sci Rep. 2023. PMID: 37794091 Free PMC article.
-
Prediction and control for the transmission of brucellosis in inner Mongolia, China.Sci Rep. 2025 Jan 28;15(1):3532. doi: 10.1038/s41598-025-87959-9. Sci Rep. 2025. PMID: 39875488 Free PMC article.
References
-
- Mohamed N.S., Stephen M.B., Nammalwar S. Brucellosis: A re-emerging zoonosis. Vet. Microbiol. 2010;140:392–398. - PubMed
-
- Overview of National Infectious Diseases in 2018. [(accessed on 24 April 2019)]; Available online: http://www.nhc.gov.cn/jkj/s3578/201904/050427ff32704a5db64f4ae1f6d57c6c.....
-
- Ministry of Health of the People’s Republic of China Measures for the management of infectious diseases. Jiang Xi Zhong Yi Yao. 1955;8:4–7.
Publication types
MeSH terms
LinkOut - more resources
Full Text Sources
Medical
