

Discoidin Domain Receptor-1 (DDR1) is Involved in Angiolymphatic Invasion in Oral Cancer
- PMID: 32244515
- PMCID: PMC7226486
- DOI: 10.3390/cancers12040841
Discoidin Domain Receptor-1 (DDR1) is Involved in Angiolymphatic Invasion in Oral Cancer
Abstract
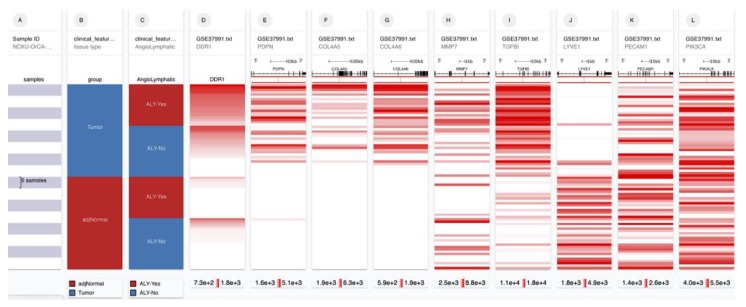
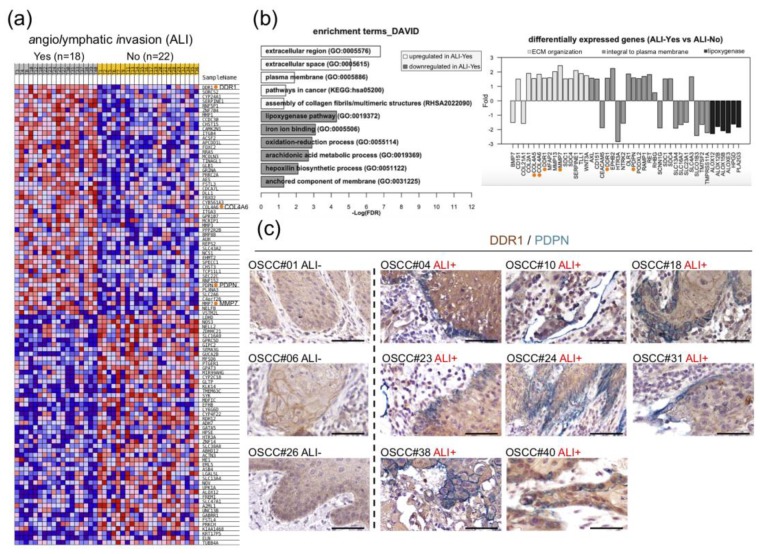
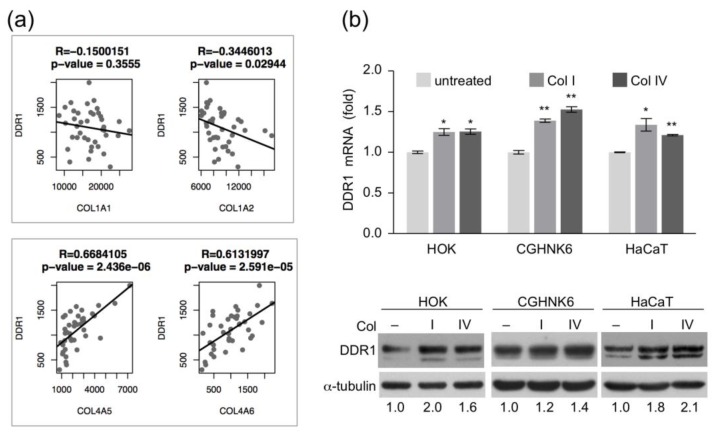
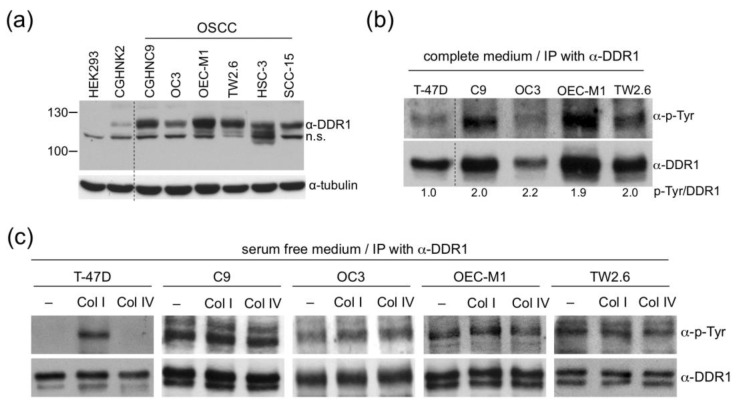
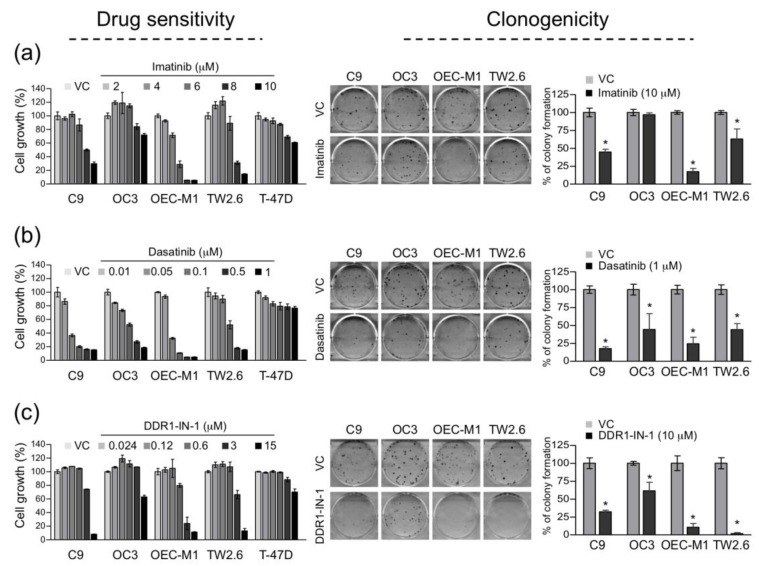
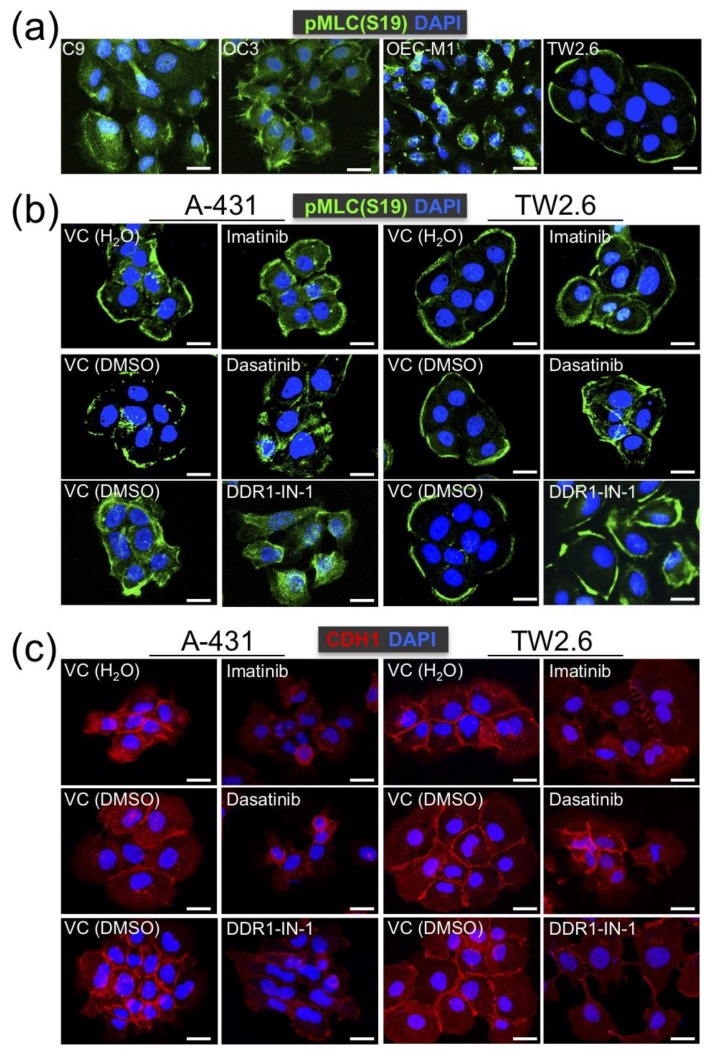
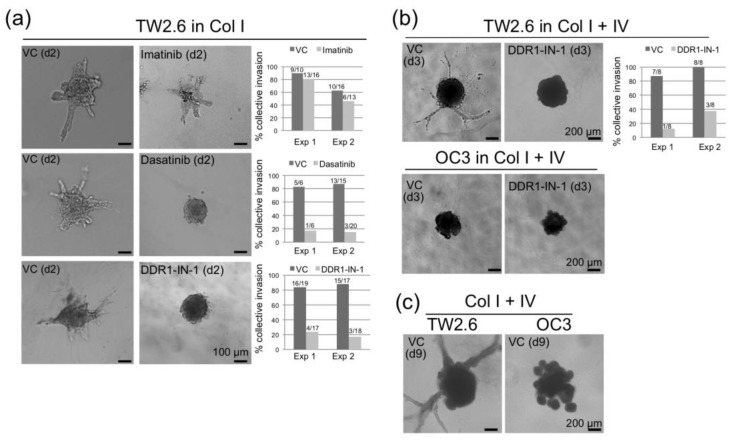
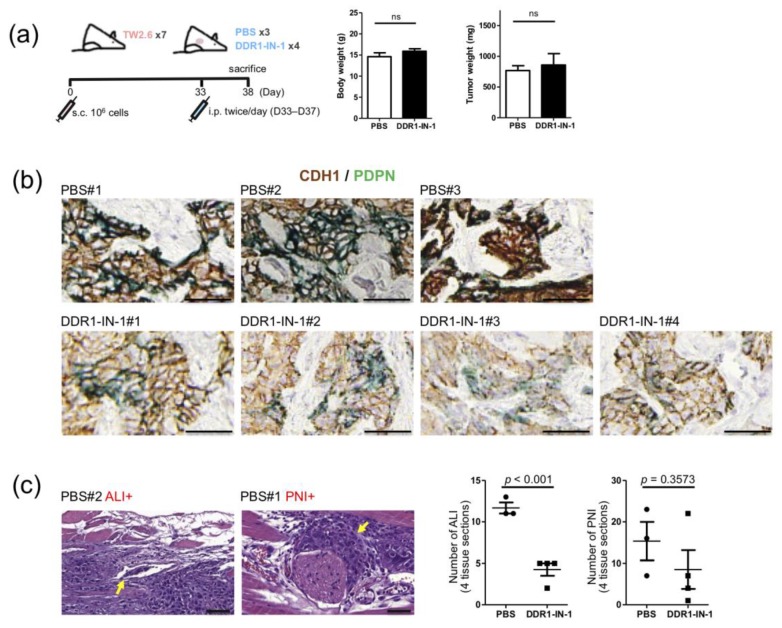
The discoidin domain receptor-1 (DDR1) is a non-integrin collagen receptor recently implicated in the collective cell migration of other cancer types. Previously, we identified an elevated expression of DDR1 in oral squamous cell carcinoma (OSCC) cells. Through the data mining of a microarray dataset composed of matched tumor-normal tissues from forty OSCC patients, we distilled overexpressed genes statistically associated with angiolymphatic invasion, including DDR1, COL4A5, COL4A6 and PDPN. Dual immunohistochemical staining further confirmed the spatial locations of DDR1 and PDPN in OSCC tissues indicative of collective cancer cell invasion. An elevated DDR1 expression at both the transcription and protein level was observed by treating keratinocytes with collagen of fibrillar or basement membrane types. In addition, inhibition of DDR1 kinase activity in OSCC TW2.6 cells disrupted cell cohesiveness in a 2D culture, reduced spheroid invasion in a collagen gel matrix, and suppressed angiolymphatic invasion in xenograft tissues. Taken together, these results suggest that collagen deposition in the affected tissues followed by DDR1 overexpression could be central to OSCC tumor growth and angiolymphatic invasion. Thus, DDR1 inhibitors are potential therapeutic compounds in restraining oral cancer, which has not been previously explored.
Keywords: angiolymphatic invasion (ALI); collective cancer cell migration; discoidin domain receptor-1 (DDR1); oral squamous cell carcinoma (OSCC).
Conflict of interest statement
The authors declare no conflict of interest.
Figures
Similar articles
-
Biological information and functional analysis reveal the role of discoidin domain receptor 1 in oral squamous cell carcinoma.Oral Surg Oral Med Oral Pathol Oral Radiol. 2021 Feb;131(2):221-230. doi: 10.1016/j.oooo.2020.10.010. Epub 2020 Oct 22. Oral Surg Oral Med Oral Pathol Oral Radiol. 2021. PMID: 33309038
-
MicroRNA-486-3p functions as a tumor suppressor in oral cancer by targeting DDR1.J Exp Clin Cancer Res. 2019 Jun 28;38(1):281. doi: 10.1186/s13046-019-1283-z. J Exp Clin Cancer Res. 2019. PMID: 31253192 Free PMC article.
-
Discoidin domain receptor 1 activity drives an aggressive phenotype in bladder cancer.Am J Transl Res. 2017 May 15;9(5):2500-2507. eCollection 2017. Am J Transl Res. 2017. PMID: 28560000 Free PMC article.
-
Discoidin Domain Receptors: Potential Actors and Targets in Cancer.Front Pharmacol. 2016 Mar 14;7:55. doi: 10.3389/fphar.2016.00055. eCollection 2016. Front Pharmacol. 2016. PMID: 27014069 Free PMC article. Review.
-
A patent review of discoidin domain receptor 1 (DDR1) modulators (2014-present).Expert Opin Ther Pat. 2020 May;30(5):341-350. doi: 10.1080/13543776.2020.1732925. Epub 2020 Feb 26. Expert Opin Ther Pat. 2020. PMID: 32077340 Review.
Cited by
-
Identification of Prognostic Biomarkers Originating From the Tumor Stroma of Betel Quid-Associated Oral Cancer Tissues.Front Oncol. 2021 Nov 16;11:769665. doi: 10.3389/fonc.2021.769665. eCollection 2021. Front Oncol. 2021. PMID: 34869001 Free PMC article.
-
The Journey of DDR1 and DDR2 Kinase Inhibitors as Rising Stars in the Fight Against Cancer.Int J Mol Sci. 2021 Jun 18;22(12):6535. doi: 10.3390/ijms22126535. Int J Mol Sci. 2021. PMID: 34207360 Free PMC article. Review.
-
Tumor specifically internalizing peptide 'HN-1': Targeting the putative receptor retinoblastoma-regulated discoidin domain receptor 1 involved in metastasis.World J Clin Oncol. 2022 May 24;13(5):323-338. doi: 10.5306/wjco.v13.i5.323. World J Clin Oncol. 2022. PMID: 35662982 Free PMC article.
-
Discoidin domain receptor inhibitor DDR1-IN-1 induces autophagy and necroptotic cell death in malignant peripheral nerve sheath tumor.Cell Death Discov. 2025 Mar 1;11(1):83. doi: 10.1038/s41420-025-02367-2. Cell Death Discov. 2025. PMID: 40025071 Free PMC article.
-
The Collagen Receptor Discoidin Domain Receptor 1b Enhances Integrin β1-Mediated Cell Migration by Interacting With Talin and Promoting Rac1 Activation.Front Cell Dev Biol. 2022 Mar 3;10:836797. doi: 10.3389/fcell.2022.836797. eCollection 2022. Front Cell Dev Biol. 2022. PMID: 35309920 Free PMC article.
References
-
- Taiwan MOHW Cancer Registry Annual Cancer Report, Ministry of Health and Welfare, Taiwan. [(accessed on 1 February 2020)]; Available online: http://tcr.cph.ntu.edu.tw.
Grants and funding
LinkOut - more resources
Full Text Sources
