. 2020 Mar 31;21(7):2429.
doi: 10.3390/ijms21072429.

CBD Reverts the Mesenchymal Invasive Phenotype of Breast Cancer Cells Induced by the Inflammatory Cytokine IL-1β

Affiliations

CBD Reverts the Mesenchymal Invasive Phenotype of Breast Cancer Cells Induced by the Inflammatory Cytokine IL-1β

Lázaro García-Morales et al. Int J Mol Sci. .

Abstract

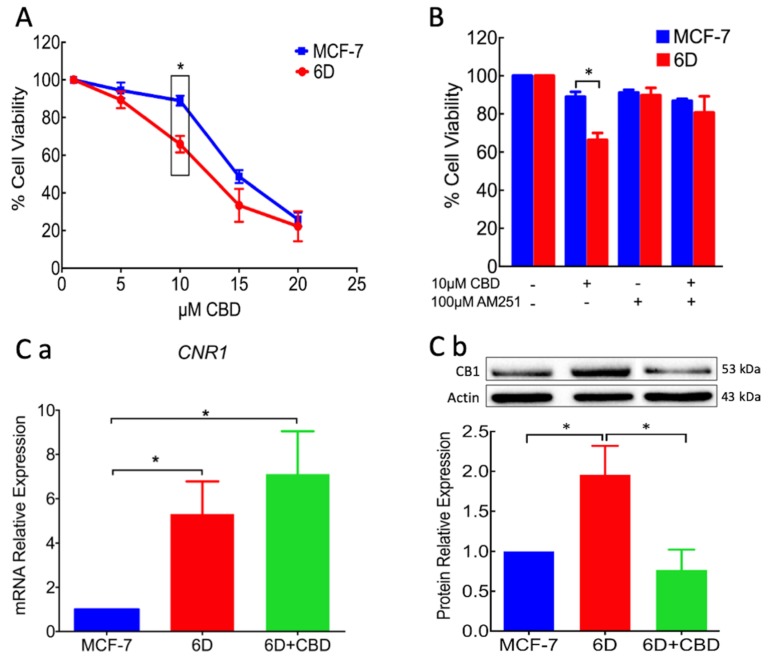
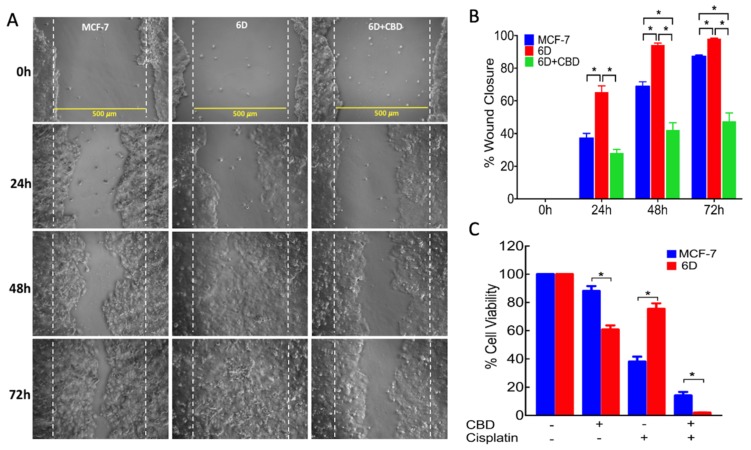
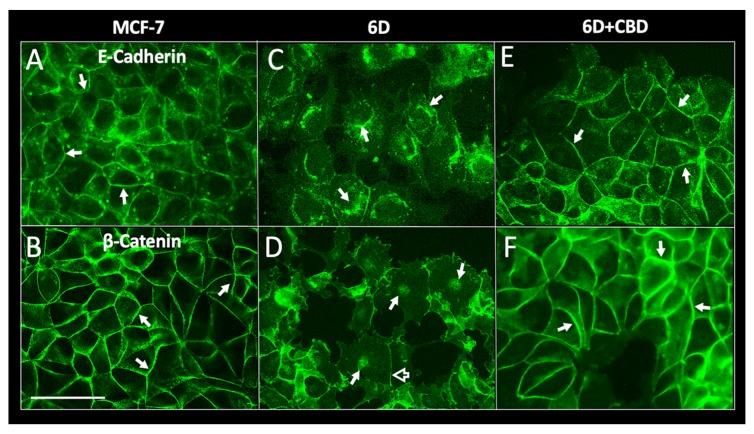
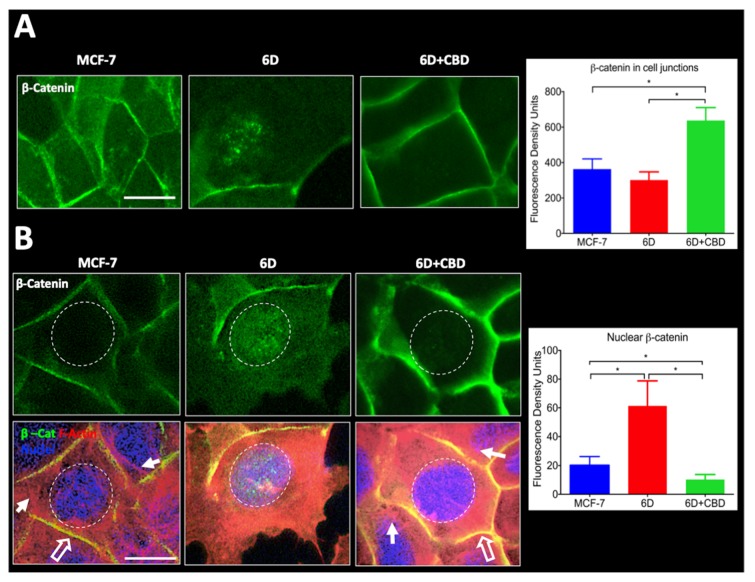
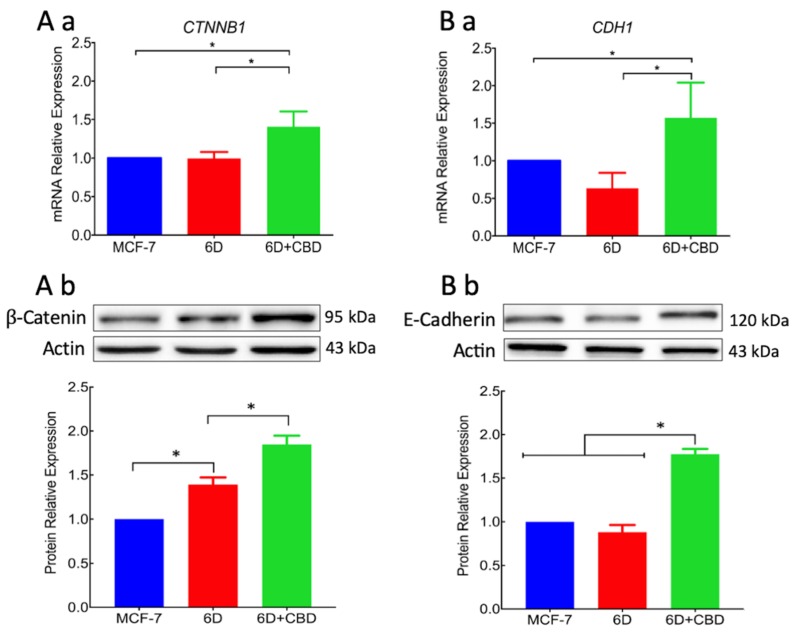
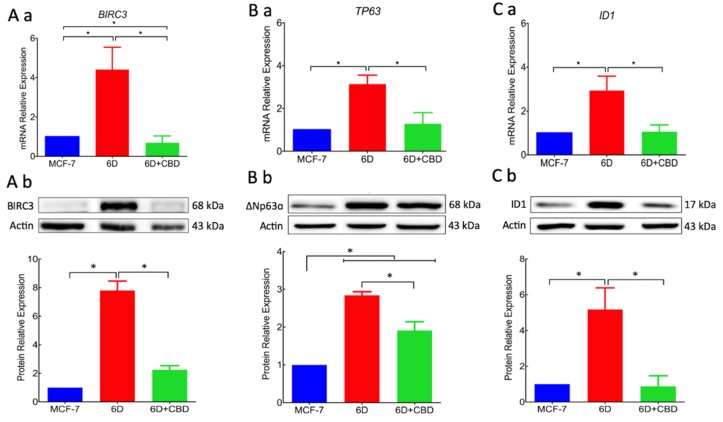
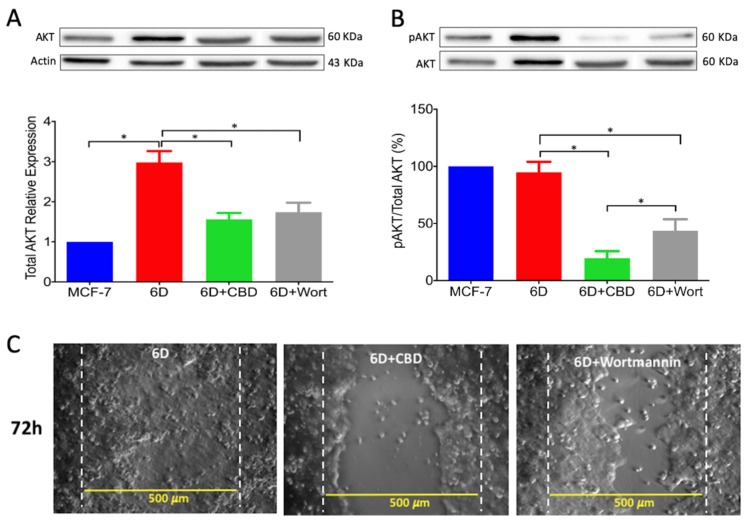
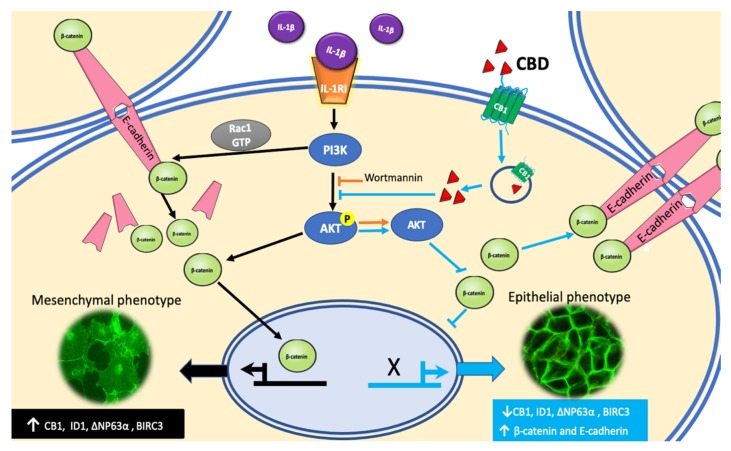
Cannabidiol (CBD) has been used to treat a variety of cancers and inflammatory conditions with controversial results. In previous work, we have shown that breast cancer MCF-7 cells, selected by their response to inflammatory IL-1β cytokine, acquire a malignant phenotype (6D cells) through an epithelial-mesenchymal transition (EMT). We evaluated CBD as a potential inhibitor of this transition and inducer of reversion to a non-invasive phenotype. It decreased 6D cell viability, downregulating expression of receptor CB1. The CBD blocked migration and progression of the IL-1β-induced signaling pathway IL-1β/IL-1RI/β-catenin, the driver of EMT. Cannabidiol reestablished the epithelial organization lost by dispersion of the cells and re-localized E-cadherin and β-catenin at the adherens junctions. It also prevented β-catenin nuclear translocation and decreased over-expression of genes for ∆Np63α, BIRC3, and ID1 proteins, induced by IL-1β for acquisition of malignant features. Cannabidiol inhibited the protein kinase B (AKT) activation, a crucial effector in the IL-1β/IL-1RI/β-catenin pathway, indicating that at this point there is crosstalk between IL-1β and CBD signaling which results in phenotype reversion. Our 6D cell system allowed step-by-step analysis of the phenotype transition and better understanding of mechanisms by which CBD blocks and reverts the effects of inflammatory IL-1β in the EMT.

Keywords: CBD; cancer treatment; inflammatory IL1β; phenotype reversion; signaling pathways.


Conflict of interest statement

The authors declare no conflict of interest.

Figures

Figure 1
Figure 1
Cell viability and CB1 receptor expression in MCF-7 and 6D cells treated with CBD. (A) Cannabidiol concentration–response curve by cells after 48 h treatment. At 10 µM CBD, the viability difference between the two cell types was statistically significant (Box). (B) Cell viability of MCF-7 and 6D cells treated in three different experimental conditions: (1) cells without any treatment, (2) cells treated with 10 µM CBD, (3) cells treated with 100 nM AM251 and (4) cells treated with AM251 and then with CBD. The MCF7 and 6D cells without any treatment were given 100% viability values in these experiments, data represent three independent batches of cells (biological replicates) were each examined in triplicate (assay replication, n = 9). (Ca) CNR1 gene expression determined by qRT-PCR in MCF-7 and 6D cells treated or not treated with CBD. (Cb) A representative Western blot of CB1 protein in the three types of cells and the densitometric analysis of CB1 levels. The values were normalized to actin as the protein load control and expressed relative to those in MCF-7 cells. The mRNA expression and Western blot results represent the average of three independent experiments ± SD (n = 3). Asterisks indicate significance at p < 0.05.
Figure 2
Figure 2
Cell migration and cell viability assays. The MCF-7 and 6D cells were cultured to 90% confluence and wounded to obtain a clear area of 500 µm flanked by dotted parallel lines. After making the wound, a set of 6D cells was treated with 10 µM CBD. (A) Closure of the wound was registered every 24 h by phase contrast microscopy until 72 h. (B) The percentage of wound closure was measured in all the experimental conditions by image analysis and represent the average of three independent batches of cells (biological replicates) were each examined in quadruplicate (assay replication, n = 12). (C) Resistance to 100 µM cisplatin was evaluated by cell viability assays. Data from three independent experiments are presented as percentage of viable 6D cells relative to control MCF-7 cells (n = 9). Asterisks indicate significance at p < 0.05.
Figure 3
Figure 3
Immunolocalization of adherens junction proteins E-cadherin and β-catenin. MCF-7 and 6D cells treated or not treated with 10 µM CBD were cultured for 48 h, fixed, and stained with specific antibodies to E-cadherin and β-catenin. (A) E-cadherin is localized in the periphery of MCF-7 cells. Adherens junctions are indicated by arrows. (B) β-catenin in MCF-7 cells also is localized at the intercellular junctions (arrows). (C) In 6D cells stained to visualize E-cadherin the protein is in the cytoplasm and around the nuclei (arrows). (D) β-catenin in the dispersed 6D cells is localized in the nuclei (arrows) and a faint signal is still visible in the remaining junctions (empty arrow). (E) 6D cells treated with 10 µM CBD showed E-cadherin normal localization in the periphery of the cells making contact (arrows). (F) In 6D cells treated with CBD, β-catenin is localized and mostly increased in the reconstituted adherens junctions (arrows). In addition, β-catenin is no longer detected in the nuclei. Bar = 50 µm.
Figure 4
Figure 4
Quantification of β-catenin levels in cell junctions and nuclei. (A) The three panels in the figure show representative images taken from randomly selected fields to measure the fluorescence density levels of β-catenin in the cell junctions of MCF-7 and 6D cells treated or not treated with CBD. The graph on the right shows the fluorescence density units obtained. (B) Top panels show images of MCF-7 and 6D cells treated or not treated with CBD and stained with anti-β-catenin antibody to visualize and measure the protein in the nuclei. The graph on the right shows the fluorescence density values obtained. The bottom panels show cells stained with phalloidin to visualize actin fibers (red), nuclei (blue) and β-catenin (green). The graph on the bottom shows the obtained values of nuclear β-catenin levels. Fluorescence density units results represent the average of three independent batches of cells (biological replicates, n = 3) ± SD. Full arrows indicate actin fibers, empty arrows indicate colocalization of actin and β-catenin in the cell junctions (yellow). Asterisks indicate significance at p < 0.05. Bar = 20 µm.
Figure 5
Figure 5
The CBD increased the levels of adherens junction proteins. (Aa) Expression of the CTNNB1 gene that codifies for β-catenin was determined in MCF-7, 6D, and CBD-treated 6D cells by qRT-PCR and values obtained normalized to the expression levels of the gene RPLP0. (Ab) Western blot of β-catenin in the three types of cells mentioned above. (Ba) mRNA relative expression levels of the gene CDH1 that codifies for E-cadherin in cells not treated and treated with CBD. (Bb) Representative Western blot of E-cadherin levels in the three types of cells and densitometric values of E-cadherin levels. Values were normalized to actin and expressed relative to those obtained in MCF7 cells. mRNA expression and Western blot results represent the average of three independent batches of cells (biological replicates, n = 3) ± SD. Asterisks indicate p < 0.05.
Figure 6
Figure 6
The CBD modified the overexpression of effector proteins downstream in the IL-1β-induced pathway. (Aa) mRNA relative expression levels of gene BIRC3 that codifies for the BIRC3 protein was determined in MCF-7cells and 6D cells treated or not treated with CBD. The data of mRNA expression in all the cases were normalized to the expression of gene RPLP0. (Ab) Representative Western blot of BIRC3 in the three cell types mentioned above. Densitometric values corresponding to BIRC3 levels were normalized to actin and expressed relative to those in MCF-7 cells. (Ba) mRNA relative expression of the TP63 gene and the ∆NP63α isoform (Bb). (Ca) mRNA relative expression levels of gene ID1 and ID1 protein (Cb). Representative Western blot of ID1 levels in the cells. mRNA expression and Western blot results represent the average of three independent batches of cells (biological replicates, n = 3) ± SD. Asterisks indicate p < 0.05.
Figure 7
Figure 7
The CBD decreased the expression and activation of AKT, blocking cell migration. (A) Representative Western blot of AKT in MCF-7 and 6D treated or not treated with CBD and 6D cells treated with 100 µM wortmannin. Densitometric values correspond to total AKT obtained from three independent experiments (n = 3) ± SD. All values were normalized to actin and expressed relative to those in MCF7 cells. Asterisks indicate p < 0.05. (B) Representative Western blot of pAKT(Ser473) in the conditions mentioned above. Percentage of AKT phosphorylation expressed as pAKT/AKT ratio. (C) To illustrate the effect of wortmannin inhibition of AKT phosphorylation in the cell migration, wound healing assays were performed with 6D, CBD-treated and wortmannin-treated cells. The percentage of the wound closure was calculated as done in Figure 2. Asterisks indicate p < 0.05.
Figure 8
Figure 8
CBD blocks the IL-1β/IL-1RI/β-catenin pathway and induces an epithelial phenotype. A hypothetical model of CBD blockage of the IL-1β-activated signaling pathway that leads into a malignant phenotype is represented by the black pathway. CBD binding to its receptor CB1 induces AKT activation and blocks the translocation of β-catenin into the nucleus. CBD also decreases the expression of malignant markers such as ∆NP63α isoform, BIRC3, and ID1 (blue pathway). CBD increased epithelial marker E-cadherin and its associated β-catenin in the adherens junction resulting in cells with an epithelial phenotype.

Similar articles

Cited by

References

    1. Yang L., Lin P.C. Mechanisms that drive inflammatory tumor microenvironment, tumor heterogeneity, and metastatic progression. Semin. Cancer Biol. 2017;47:185–195. doi: 10.1016/j.semcancer.2017.08.001. - DOI - PMC - PubMed
    1. Apte R.N., Dotan S., Elkabets M., White M.R., Reich E., Carmi Y., Song X., Dvozkin T., Krelin Y., Voronov E. The involvement of IL-1 in tumorigenesis, tumor invasiveness, metastasis and tumor-host interactions. Cancer Metastasis Rev. 2006;25:387–408. doi: 10.1007/s10555-006-9004-4. - DOI - PubMed
    1. Franco-Barraza J., Valdivia-Silva J.E., Zamudio-Meza H., Castillo A., García-Zepeda E.A., Benítez-Bribiesca L., Meza I. Actin Cytoskeleton Participation in the Onset of IL-1β Induction of an Invasive Mesenchymal-like Phenotype in Epithelial MCF-7 Cells. Arch. Med. Res. 2010;41:170–181. doi: 10.1016/j.arcmed.2010.04.010. - DOI - PubMed
    1. Perez-Yepez E.A., Ayala-Sumuano J.-T., Reveles-Espinoza A.M., Meza I. Selection of a MCF-7 Breast Cancer Cell Subpopulation with High Sensitivity to IL-1 β: Characterization of and Correlation between Morphological and Molecular Changes Leading to Increased Invasiveness. Int. J. Breast Cancer. 2012;2012:1–12. doi: 10.1155/2012/609148. - DOI - PMC - PubMed
    1. Perez-Yepez E.A., Ayala-Sumuano J.-T., Lezama R., Meza I. A novel β-catenin signaling pathway activated by IL-1β leads to the onset of epithelial–mesenchymal transition in breast cancer cells. Cancer Lett. 2014;354:164–171. doi: 10.1016/j.canlet.2014.08.015. - DOI - PubMed

MeSH terms