. 2020 Mar 31;21(7):2436.
doi: 10.3390/ijms21072436.

Human Melanoma-Cell Metabolic Profiling: Identification of Novel Biomarkers Indicating Metastasis

Affiliations

Human Melanoma-Cell Metabolic Profiling: Identification of Novel Biomarkers Indicating Metastasis

Mariangela Kosmopoulou et al. Int J Mol Sci. .

Abstract

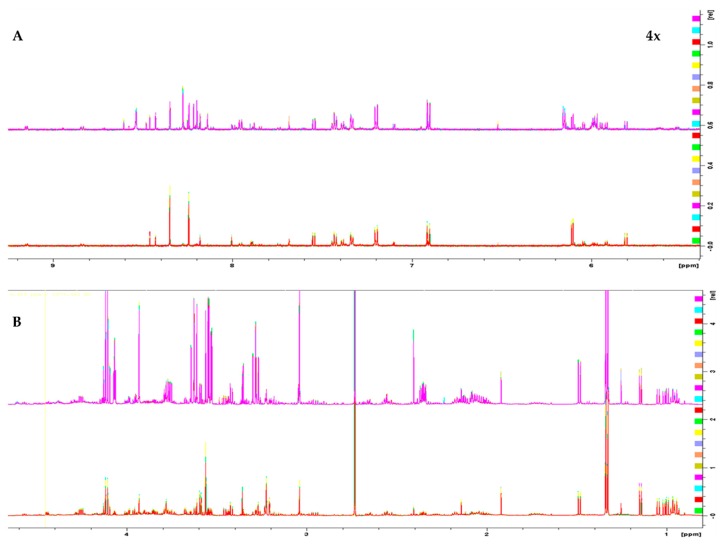
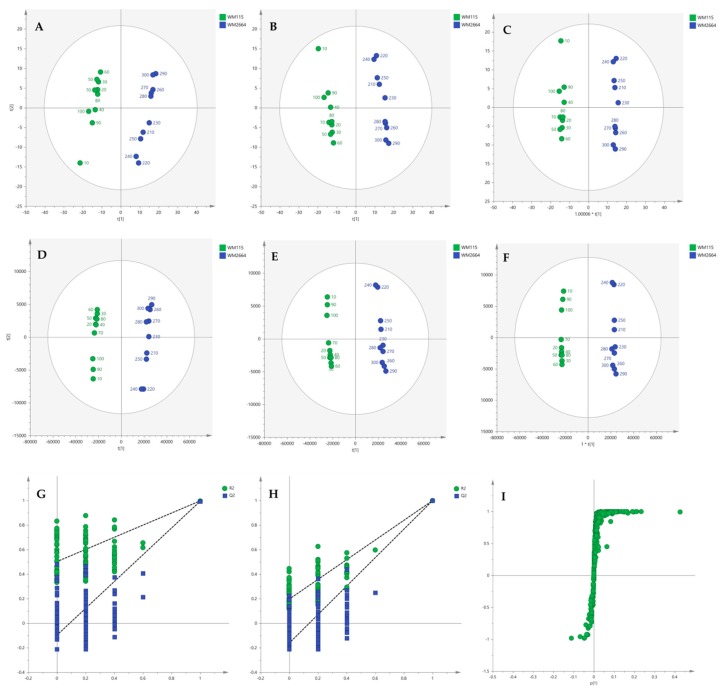
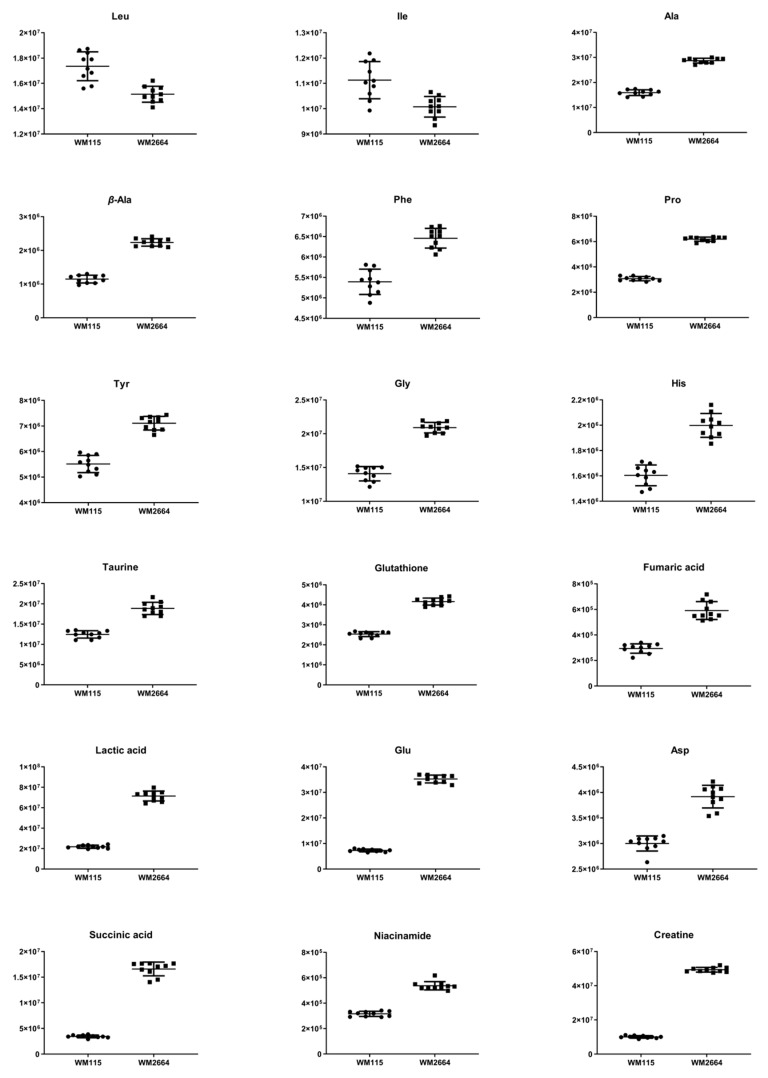
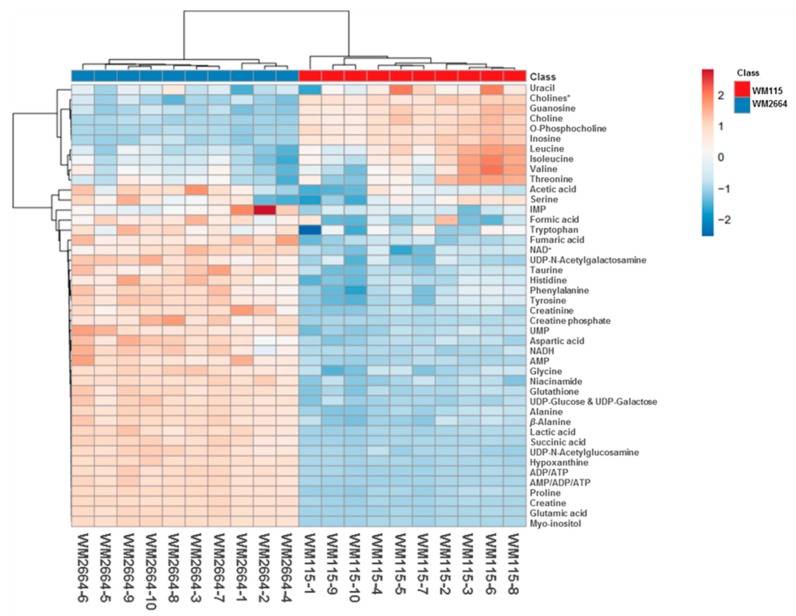
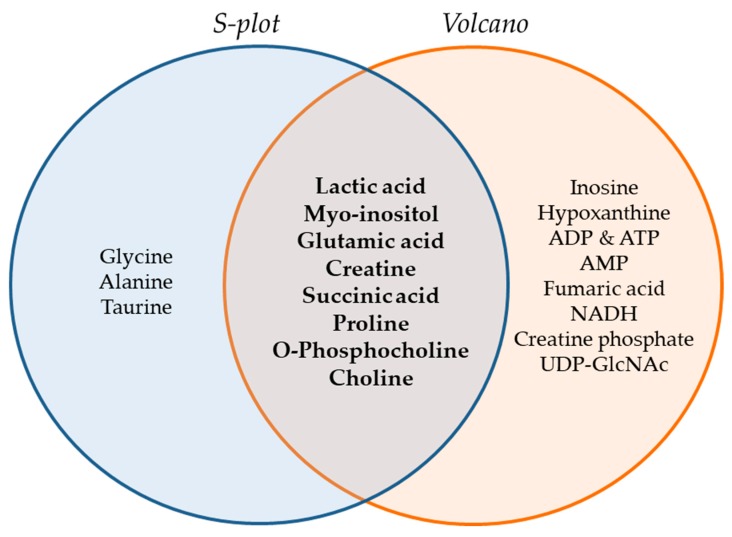
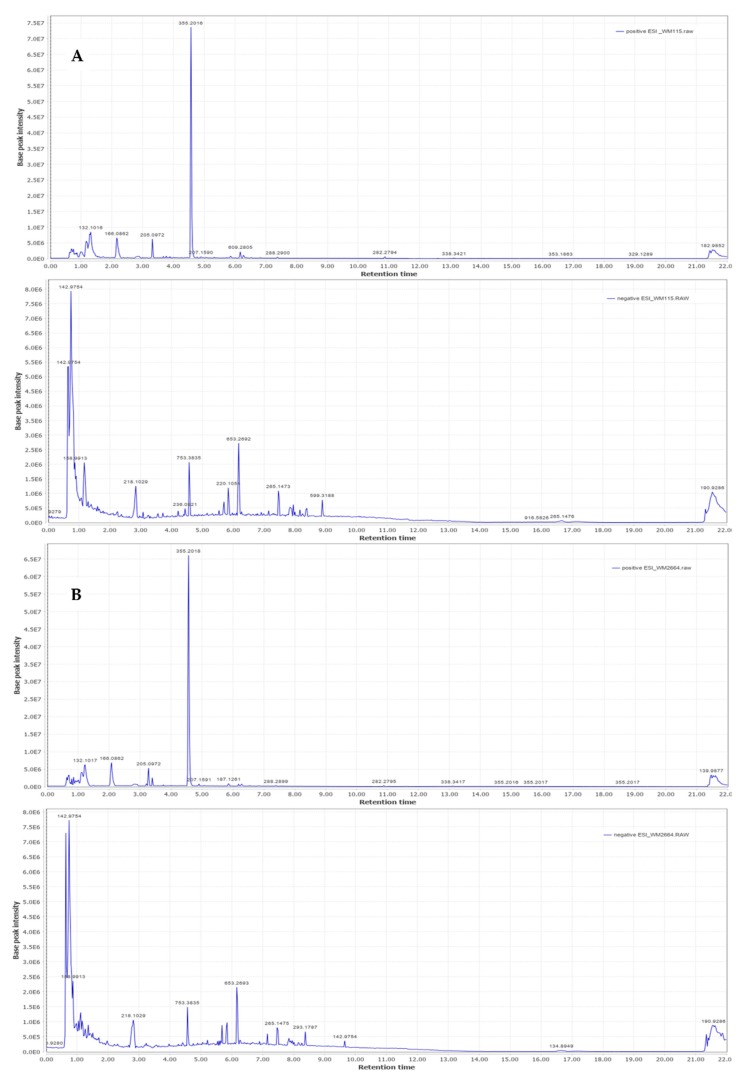
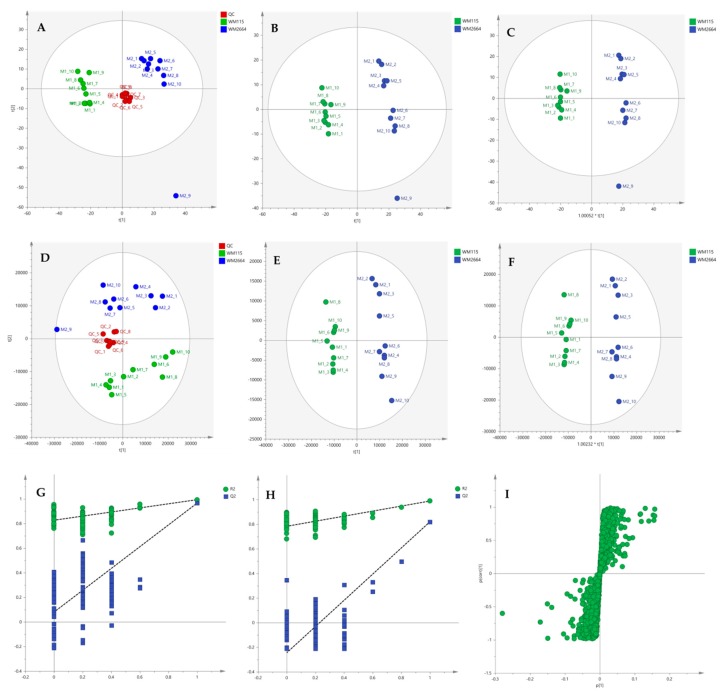
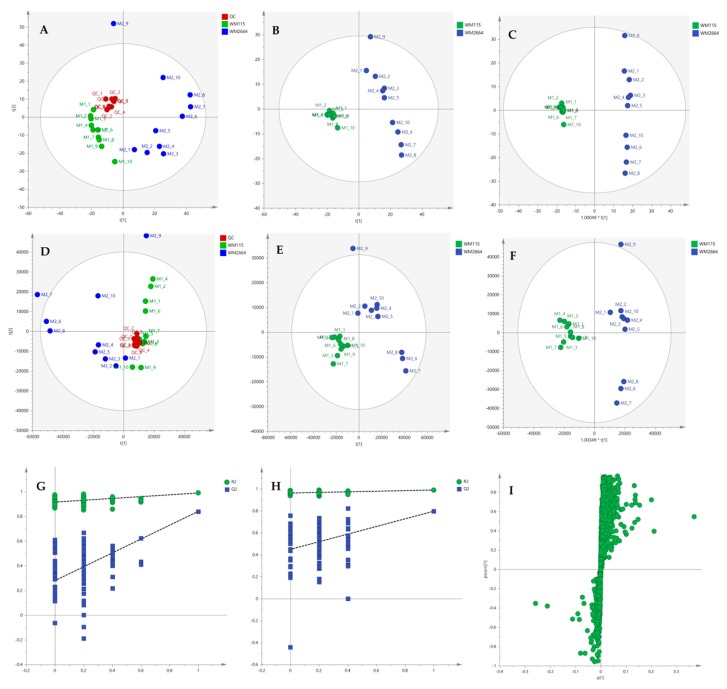
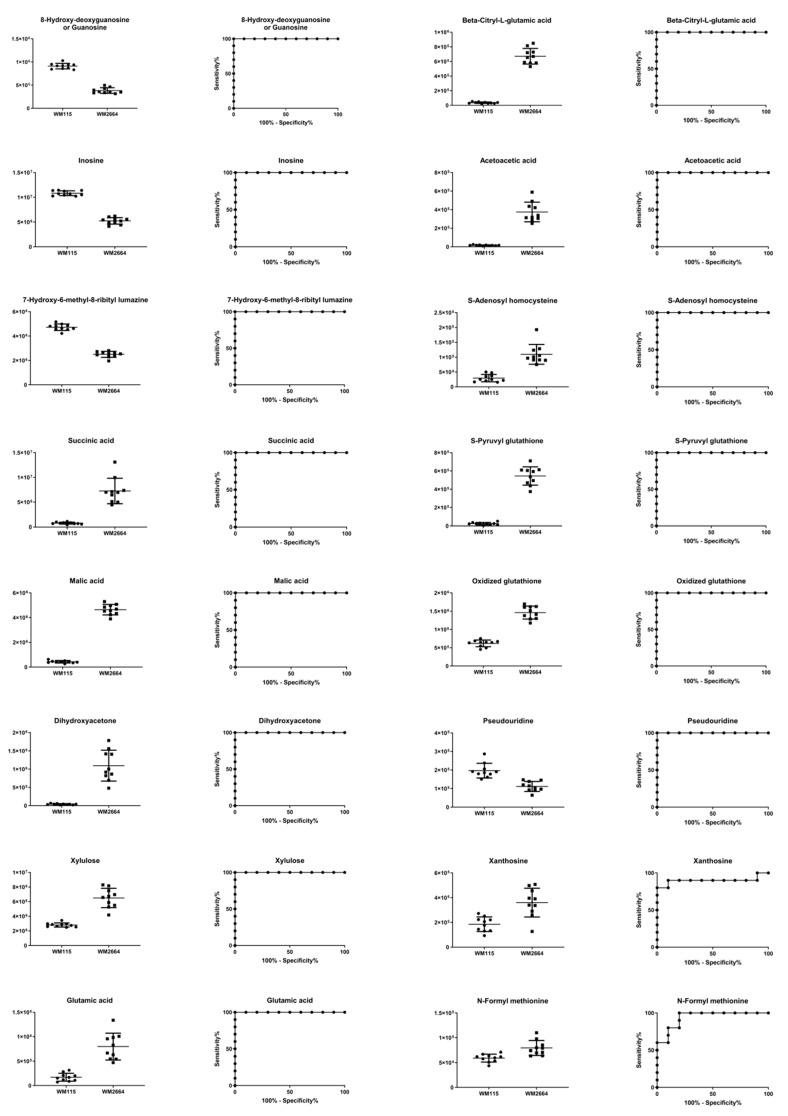
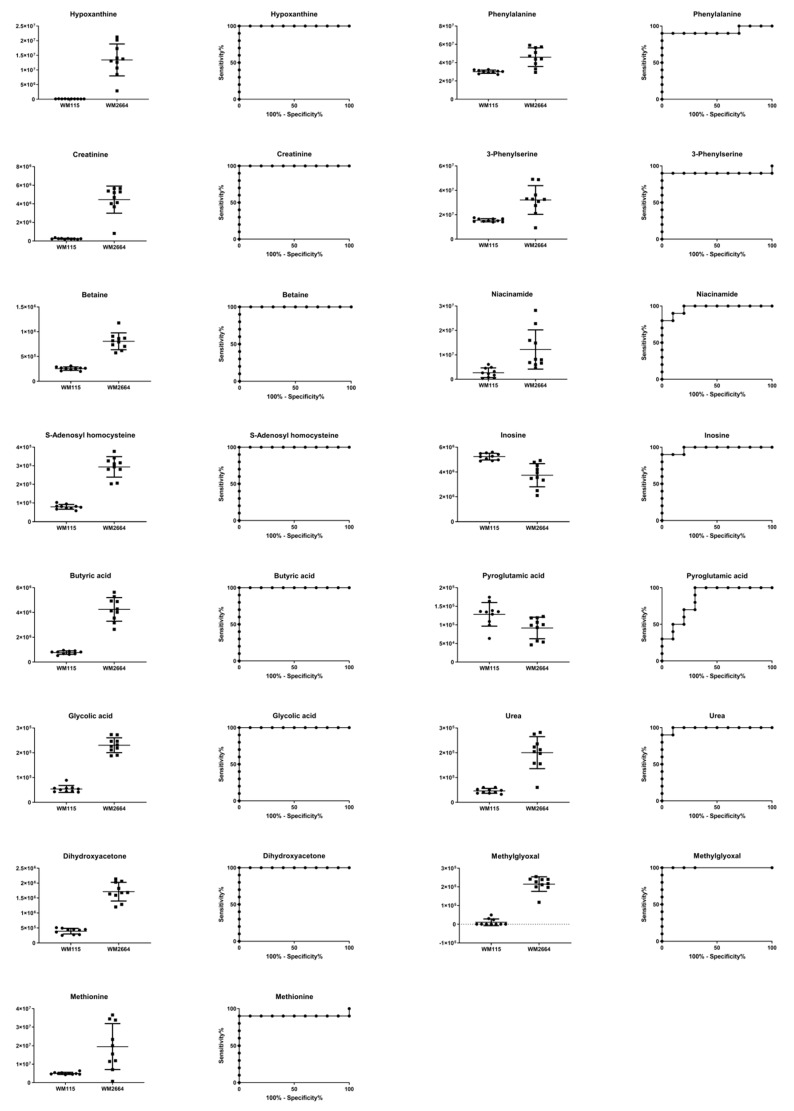
Melanoma is the most aggressive type of skin cancer, leading to metabolic rewiring and enhancement of metastatic transformation. Efforts to improve its early and accurate diagnosis are largely based on preclinical models and especially cell lines. Hence, we herein present a combinational Nuclear Magnetic Resonance (NMR)- and Ultra High Performance Liquid Chromatography-High-Resolution Tandem Mass Spectrometry (UHPLC-HRMS/MS)-mediated untargeted metabolomic profiling of melanoma cells, to landscape metabolic alterations likely controlling metastasis. The cell lines WM115 and WM2664, which belong to the same patient, were examined, with WM115 being derived from a primary, pre-metastatic, tumor and WM2664 clonally expanded from lymph-node metastases. Metabolite samples were analyzed using NMR and UHPLC-HRMS. Multivariate statistical analysis of high resolution NMR and MS (positive and negative ionization) results was performed by Principal Component Analysis (PCA), Partial Least Squares-Discriminant Analysis (PLS-DA) and Orthogonal Partial Least Squares-Discriminant Analysis (OPLS-DA), while metastasis-related biomarkers were determined on the basis of VIP lists, S-plots and Student's t-tests. Receiver Operating Characteristic (ROC) curves of NMR and MS data revealed significantly differentiated metabolite profiles for each cell line, with WM115 being mainly characterized by upregulated levels of phosphocholine, choline, guanosine and inosine. Interestingly, WM2664 showed notably increased contents of hypoxanthine, myo-inositol, glutamic acid, organic acids, purines, pyrimidines, AMP, ADP, ATP and UDP(s), thus indicating the critical roles of purine, pyrimidine and amino acid metabolism during human melanoma metastasis.

Keywords: MS; NMR; biomarker; cancer; melanoma; metabolomics; metastasis.


Conflict of interest statement

The authors declare that have no competing financial and/or non-financial interests.

Figures

Figure 1
Figure 1
1H 1D NMR spectra of: (A) the aromatic region and (B) the aliphatic region of the WM2664 metastatic (n = 10, top) and WM115 pre-metastatic cell group (n = 10, bottom). The metastatic group exhibits notable upregulation of most metabolites. Aromatic region was magnified (4×) compared to the aliphatic one, in order to aid visual inspection.
Figure 2
Figure 2
(A) PCA, (B) PLS-DA and (C) OPLS-DA score plots in UV scaling, and (DF) the corresponding scores plots in Pareto scaling of NMR data. Permutation tests of PLS-DA models (G) in UV scaling και (H) in Pareto scaling. (I) S-plot from OPLS-DA model.
Figure 3
Figure 3
Boxplots for melanoma-originated metabolites (AUC ≥ 0.9) that have been herein identified in NMR data.
Figure 3
Figure 3
Boxplots for melanoma-originated metabolites (AUC ≥ 0.9) that have been herein identified in NMR data.
Figure 4
Figure 4
Presentation of NMR-identified, melanoma-derived, metabolites, in a heatmap form. * O-Acetylcholine and sn-Glycero-3-phosphocholine.
Figure 5
Figure 5
Volcano plot of human melanoma metabolites. Fold Change (FC) < 0.5, or Fold Change (FC) > 2 and p < 10−5 are observed for metabolites indicated in color.
Figure 6
Figure 6
Venn diagram of melanoma metabolites that are related to metastasis. Important metabolites are highlighted (bold fonts) at the interphase of S-plot and Volcano plot.
Figure 7
Figure 7
Typical base peak intensity chromatograms of: (A) WM115 and (B) WM2664 melanoma cells, for positive (upper panels) and negative (bottom panels) ion mode.
Figure 8
Figure 8
(A) PCA, (B) PLS-DA and (C) OPLS-DA scores plots in UV scaling, and (DF) the corresponding scores plots in Pareto scaling of Mass Spectrometry (MS) data, in negative ion mode. Permutation tests of PLS-DA models (G) in UV και (H) in Pareto scaling. (I) S-plot from OPLS-DA model.
Figure 9
Figure 9
(A) PCA, (B) PLS-DA and (C) OPLS-DA scores plots in UV scaling, and (DF) the corresponding scores plots in Pareto scaling of MS data, in positive ion mode. Permutation tests of PLS-DA models (G) in UV και (H) in Pareto scaling. (I) S-plot from OPLS-DA model.
Figure 10
Figure 10
Boxplots and ROC curves, for identified MS features, in negative ion mode, with AUC > 0.8.
Figure 11
Figure 11
Boxplots and ROC curves, for identified MS features, in positive ion mode, with AUC > 0.8.
Figure 12
Figure 12
Flow-diagram showing pathways and cognate metabolites critically involved in the discrimination of primary and metastatic human melanoma cells. Blue: reduced levels (Fold Change < 0.50); Red: increased levels (Fold Change > 2). The metastatic cell group is presented with elevated contents of hypoxanthine, myo-inositol, AXP (X: D, or T), UDPs, amino acids and organic acids, and decreased levels of guanosine, inosine and cholines, thus indicating the perturbed purine, pyrimidine and amino acid metabolism during metastasis in melanoma.

Similar articles

Cited by

References

    1. Ali Z., Yousaf N., Larkin J. Melanoma epidemiology, biology and prognosis. EJC Suppl. 2013;11:81–91. doi: 10.1016/j.ejcsup.2013.07.012. - DOI - PMC - PubMed
    1. Cummins D.L., Cummins J.M., Pantle H., Silverman M.A., Leonard A.L., Chanmugam A. Cutaneous Malignant Melanoma. Mayo Clin. Proc. 2006;81:500–507. doi: 10.4065/81.4.500. - DOI - PubMed
    1. Ratnikov B.I., Scott D.A., Osterman A.L., Smith J.W., Ronai Z.A. Metabolic rewiring in melanoma. Oncogene. 2017;36:147–157. doi: 10.1038/onc.2016.198. - DOI - PMC - PubMed
    1. Beger R.D. A Review of Applications of Metabolomics in Cancer. Metabolites. 2013;3:552–574. doi: 10.3390/metabo3030552. - DOI - PMC - PubMed
    1. Nicholson J.K. Global systems biology, personalized medicine and molecular epidemiology. Mol. Syst. Biol. 2006;2:52. doi: 10.1038/msb4100095. - DOI - PMC - PubMed