. 2020 Apr 1;12(4):974.
doi: 10.3390/nu12040974.

Potential Adverse Public Health Effects Afforded by the Ingestion of Dietary Lipid Oxidation Product Toxins: Significance of Fried Food Sources

Affiliations

Potential Adverse Public Health Effects Afforded by the Ingestion of Dietary Lipid Oxidation Product Toxins: Significance of Fried Food Sources

Martin Grootveld et al. Nutrients. .

Abstract

Exposure of polyunsaturated fatty acid (PUFA)-rich culinary oils (COs) to high temperature frying practices generates high concentrations of cytotoxic and genotoxic lipid oxidation products (LOPs) via oxygen-fueled, recycling peroxidative bursts. These toxins, including aldehydes and epoxy-fatty acids, readily penetrate into fried foods and hence are available for human consumption; therefore, they may pose substantial health hazards. Although previous reports have claimed health benefits offered by the use of PUFA-laden COs for frying purposes, these may be erroneous in view of their failure to consider the negating adverse public health threats presented by food-transferable LOPs therein. When absorbed from the gastrointestinal (GI) system into the systemic circulation, such LOPs may significantly contribute to enhanced risks of chronic non-communicable diseases (NCDs), e.g. cancer, along with cardiovascular and neurological diseases. Herein, we provide a comprehensive rationale relating to the public health threats posed by the dietary ingestion of LOPs in fried foods. We begin with an introduction to sequential lipid peroxidation processes, describing the noxious effects of LOP toxins generated therefrom. We continue to discuss GI system interactions, the metabolism and biotransformation of primary lipid hydroperoxide LOPs and their secondary products, and the toxicological properties of these agents, prior to providing a narrative on chemically-reactive, secondary aldehydic LOPs available for human ingestion. In view of a range of previous studies focused on their deleterious health effects in animal and cellular model systems, some emphasis is placed on the physiological fate of the more prevalent and toxic α,β-unsaturated aldehydes. We conclude with a description of targeted nutritional and interventional strategies, whilst highlighting the urgent and unmet clinical need for nutritional and epidemiological trials probing relationships between the incidence of NCDs, and the frequency and estimated quantities of dietary LOP intake.

Keywords: acrolein; aldehyde toxins; atherosclerosis; cancer; cooking oil fumes; cytogenicity/gentoxicity/mutagenicity; fried foods; frying oils; lipid hydroperoxides; lipid oxidation products; maximum human dietary intake (MHDI).


Conflict of interest statement

None of the authors declare any conflicts of interest.

Figures
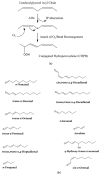
Figure 1
Figure 1
(a) Simplified reaction scheme for the peroxidation of a linoleic acid substrate molecule present in a culinary oil linoleoylglycerol species (H represents a hydrogen atom); the conjugated hydroperoxydiene (CHPD) species shown is one of the cis,trans-CHPD classification. (b) Molecular structures of aldehydes arising from the fragmentation of lipid hydroperoxides (HPMs and CHPDs). n-Nonanal and trans-2-decenal arise from the fragmentation of oleoylglycerol-derived HPMs; n-hexanal, trans-2-octenal and trans,trans-deca-2,4-dienal from the fragmentation of linolenoylglycerol-derived CHPDs; and propanal, acrolein, trans-2-pentenal and trans,trans-hepta-2,4-adienal from linolenoylglycerol-derived CHPD fragmentation. cis,trans-Deca-2,4-dienal may arise from the thermally-induced isomerism of its trans,trans-isomer [12].
Figure 2
Figure 2
(a) Expanded aldehydic-CHO proton (9.20–10.20 ppm) regions of 600 MHz 1H-NMR spectra of corn oil exposed to laboratory-simulated frying episodes at 180 °C for periods of 0 (blue), 30 (red) and 90 min. (green). Typical spectra are shown. Abbreviations: -CHO function resonances of 1, trans-2-alkenals; 2, trans,trans-2,4-alkadienals; 3, 4,5-epoxy-trans-2-alkenals; 4, combined 4-hydroxy and 4-hydroperoxy-trans-2-alkenals; 5, cis,trans-2,4-alkadienals; 6, n-alkanals; 7, low-molecular-mass short-chain n-alkanals, particularly propanal and n-butanal from the peroxidation of linolenoylglycerols; 8, cis-2-alkenals, potentially arising from the thermally-induced isomerism of trans-2-alkenals; 9, unassigned aldehyde doublet resonance. All resonances visible are doublets, with the exception of signals 6 and 7, which are triplets (J = 1.73 and 1.74 Hz respectively). Samples were prepared for 1H NMR analysis by the method described in [11], and spectra were acquired on a JEOL-ECZR600 NMR spectrometer (De Montfort University facility, Leicester, UK) operating at a frequency of 600.17 MHz. (b) Heatmap profile showing the time-dependent generation of the three major secondary aldehydic LOPs, i.e., trans-2-alkenals (t-2-Alken), trans,trans-2,4-alkadienals (t,t-A-2,4-D) and n-alkanals (n-Alk) in canola (CAO), coconut (COO), extra-virgin olive (OO) and sunflower (SFO) oils exposed to LSSFEs for periods of 0, 5, 10, 20, 30 60 and 90 min. (ordinate axis codes 00, 05, 10, 20, 30, 60 and 90 respectively). Generalised log- (glog-) transformed aldehyde concentrations (mmol/mol. FA) are shown on the right-hand side abscissa axis. Deep blue and red colourations depict extremes of low and high concentrations respectively. The left-hand abscissa axis shows agglomerative hierarchal clustering of these 3 aldehyde classes, which demonstrate that trans,trans-alka-2,4-dienals, which are generated only from PUFA peroxidation, have some independence (orthogonality) from a combination of trans-2-alkenals and n-alkanals, which arise from the fragmentation of both MUFA and PUFA hydroperoxide sources. Manufacturer-specified SFA, MUFA and PUFA contents of these oils were 7.5, 63.7 and 28.8% for canola oil; 90.1, 8.1 and 1.8% (w/w) respectively for coconut oil; 13.0, 77.4 and 9.4% for extra virgin olive oil; and 10.3, 29.3 and 60.4% (w/w) for sunflower oil. For canola oil, 9.8% of the 28.8% (w/w) PUFA content was linolenic acid (as linolenoylglycerols).
Figure 2
Figure 2
(a) Expanded aldehydic-CHO proton (9.20–10.20 ppm) regions of 600 MHz 1H-NMR spectra of corn oil exposed to laboratory-simulated frying episodes at 180 °C for periods of 0 (blue), 30 (red) and 90 min. (green). Typical spectra are shown. Abbreviations: -CHO function resonances of 1, trans-2-alkenals; 2, trans,trans-2,4-alkadienals; 3, 4,5-epoxy-trans-2-alkenals; 4, combined 4-hydroxy and 4-hydroperoxy-trans-2-alkenals; 5, cis,trans-2,4-alkadienals; 6, n-alkanals; 7, low-molecular-mass short-chain n-alkanals, particularly propanal and n-butanal from the peroxidation of linolenoylglycerols; 8, cis-2-alkenals, potentially arising from the thermally-induced isomerism of trans-2-alkenals; 9, unassigned aldehyde doublet resonance. All resonances visible are doublets, with the exception of signals 6 and 7, which are triplets (J = 1.73 and 1.74 Hz respectively). Samples were prepared for 1H NMR analysis by the method described in [11], and spectra were acquired on a JEOL-ECZR600 NMR spectrometer (De Montfort University facility, Leicester, UK) operating at a frequency of 600.17 MHz. (b) Heatmap profile showing the time-dependent generation of the three major secondary aldehydic LOPs, i.e., trans-2-alkenals (t-2-Alken), trans,trans-2,4-alkadienals (t,t-A-2,4-D) and n-alkanals (n-Alk) in canola (CAO), coconut (COO), extra-virgin olive (OO) and sunflower (SFO) oils exposed to LSSFEs for periods of 0, 5, 10, 20, 30 60 and 90 min. (ordinate axis codes 00, 05, 10, 20, 30, 60 and 90 respectively). Generalised log- (glog-) transformed aldehyde concentrations (mmol/mol. FA) are shown on the right-hand side abscissa axis. Deep blue and red colourations depict extremes of low and high concentrations respectively. The left-hand abscissa axis shows agglomerative hierarchal clustering of these 3 aldehyde classes, which demonstrate that trans,trans-alka-2,4-dienals, which are generated only from PUFA peroxidation, have some independence (orthogonality) from a combination of trans-2-alkenals and n-alkanals, which arise from the fragmentation of both MUFA and PUFA hydroperoxide sources. Manufacturer-specified SFA, MUFA and PUFA contents of these oils were 7.5, 63.7 and 28.8% for canola oil; 90.1, 8.1 and 1.8% (w/w) respectively for coconut oil; 13.0, 77.4 and 9.4% for extra virgin olive oil; and 10.3, 29.3 and 60.4% (w/w) for sunflower oil. For canola oil, 9.8% of the 28.8% (w/w) PUFA content was linolenic acid (as linolenoylglycerols).
Figure 3
Figure 3
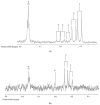
1H-NMR Analysis of Aldehydic LOPs in C2HCl3 Extracts of Fast-Food Restaurant Fried Food Samples. (a) and (b), Expanded aldehydic-CHO proton (9.40–9.90 ppm) regions of the 400 MHz 1H NMR spectra of C2HCl3 extracts of fried potato chip and chicken (batter portion) servings purchased from fast-food restaurants, which contain trans-2-alkenal, trans,trans-2,4-alkadienal, 4,5-epoxy-trans-2-alkenal, combined 4-hydroxy-/4-hydroperoxy-trans-2-alkenal, cis,trans-2,4-alkadienal and n-alkanal aldehydic LOP resonances in (a), and trans-2-alkenal, trans,trans-2,4-alkadienal and n-alkanal resonances in (b). Typical spectra are shown. Typically, no aldehydic LOPs were 1H NMR-detectable in the corresponding meat portion of the fried chicken sample corresponding to the batter extract spectrum shown in (b). Samples were extracted and prepared for 1H NMR analysis by the method described in [11], and spectra were acquired on a 400 MHz Bruker Avance NMR spectrometer equipped with a QNP probe, and operating at 399.93 MHz (De Montfort University facility, Leicester, UK). Abbreviations: as Figure 1, with F representing formaldehyde in (b).
Figure 4
Figure 4
600 MHz 1D 1H and 2D 1H-1H correlation spectroscopy (COSY) NMR spectral profiles of a C2HCl3 extract of a commercially-available chocolate hazelnut spread product. (a) Expanded 9.40–9.90 ppm region of a 1D spectrum of this extract showing an intense –CHO function resonance arising from the flavouring agent vanillin (abbreviated V1), along with 1H-NMR-detectable traces of trans,trans-2,4-alkadienals (2) and long-chain n-alkanals (6). (b) Expanded 5.655–6.670 (F1 axis) and 9.364–9.660 ppm (F2 axis) region of a 1H-1H COSY spectrum acquired on this extract, revealing connectivities between the C1-CHO and C2-CH=CH- resonances of trans,trans-2,4-alkadienals. (c) Expanded 2.230–2.670 (F1 axis) and 9.668–9.797 ppm (F2 axis) region of the 1H-1H COSY spectrum shown in (b), showing differential molecular couplings between one major (A) and one relatively minor (A1) long-chain n-alkanal species. (d) and (e), Expanded 5.7–8.2 and 3.4–4.2 ppm regions of the 1D spectrum shown in (a) respectively, with resonances ascribable to the C5H/C6H (V2) and C2H (V3) aromatic, and C3-OCH3 (V4) protons of vanillin indicated. DV represents a tentative assignment to the C3-OCH3 function of divanillin, a vanillin oxidation product. Further abbreviations: -OOH, lipid hydroperoxide-OOH function resonance; CHCl3, residual chloroform; X, residual chloroform 13C satellite.
Figure 4
Figure 4
600 MHz 1D 1H and 2D 1H-1H correlation spectroscopy (COSY) NMR spectral profiles of a C2HCl3 extract of a commercially-available chocolate hazelnut spread product. (a) Expanded 9.40–9.90 ppm region of a 1D spectrum of this extract showing an intense –CHO function resonance arising from the flavouring agent vanillin (abbreviated V1), along with 1H-NMR-detectable traces of trans,trans-2,4-alkadienals (2) and long-chain n-alkanals (6). (b) Expanded 5.655–6.670 (F1 axis) and 9.364–9.660 ppm (F2 axis) region of a 1H-1H COSY spectrum acquired on this extract, revealing connectivities between the C1-CHO and C2-CH=CH- resonances of trans,trans-2,4-alkadienals. (c) Expanded 2.230–2.670 (F1 axis) and 9.668–9.797 ppm (F2 axis) region of the 1H-1H COSY spectrum shown in (b), showing differential molecular couplings between one major (A) and one relatively minor (A1) long-chain n-alkanal species. (d) and (e), Expanded 5.7–8.2 and 3.4–4.2 ppm regions of the 1D spectrum shown in (a) respectively, with resonances ascribable to the C5H/C6H (V2) and C2H (V3) aromatic, and C3-OCH3 (V4) protons of vanillin indicated. DV represents a tentative assignment to the C3-OCH3 function of divanillin, a vanillin oxidation product. Further abbreviations: -OOH, lipid hydroperoxide-OOH function resonance; CHCl3, residual chloroform; X, residual chloroform 13C satellite.
Figure 5
Figure 5
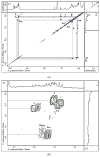
(a) 5.7–10.2 ppm regions of single-pulse (1D) and two-dimensional (2D) 1H-1H COSY spectra of a commercial cod liver oil product exposed to a LSSFE for a period of 90 min. at 180 °C, with 1H chemical shift scales (ppm) on the F1 (ordinate) and F2 (abscissa) axes. (b) Expanded 5.98–6.47 (F1 axis) and 9.36–9.73 ppm (F2 axis) region of the above 1H-1H COSY spectrum, revealing linkages between the C1-CHO, C2-CH=CH- (and in some cases C3-CH=CH-) resonances of trans-2-alkenals, trans,trans-2,4-alkadienals, cis,trans-2,4-alkadienals, acrolein and 4,5-epoxy-trans-2-alkenals (1, 2, 5, Acr and Epox, respectively). A1 represents a connectivity between the δ = 9.484 and 6.119 ppm resonances, and is tentatively assigned to a trans-2-alkenal classification with a significantly different carbon chain length range than that giving rise to the characteristic 9.480 ppm signal. (c) Expanded 2.33–2.94 (F1 axis) and 9.68-9.91 ppm (F2 axis) region of the 1H-1H COSY spectrum shown in (a), exhibiting clear distinctions between connectivities arising from three long-chain (A, A1 and B) and one short-chain (D) n-alkanal classification. C represents the 1H-1H correlation for the -CHO and α-CH2 function protons of 4-oxo-n-alkanals. Samples were prepared for 1H-NMR analysis by the method described in [11], and spectra were acquired on the NMR facility described in Figure 2.
Figure 5
Figure 5
(a) 5.7–10.2 ppm regions of single-pulse (1D) and two-dimensional (2D) 1H-1H COSY spectra of a commercial cod liver oil product exposed to a LSSFE for a period of 90 min. at 180 °C, with 1H chemical shift scales (ppm) on the F1 (ordinate) and F2 (abscissa) axes. (b) Expanded 5.98–6.47 (F1 axis) and 9.36–9.73 ppm (F2 axis) region of the above 1H-1H COSY spectrum, revealing linkages between the C1-CHO, C2-CH=CH- (and in some cases C3-CH=CH-) resonances of trans-2-alkenals, trans,trans-2,4-alkadienals, cis,trans-2,4-alkadienals, acrolein and 4,5-epoxy-trans-2-alkenals (1, 2, 5, Acr and Epox, respectively). A1 represents a connectivity between the δ = 9.484 and 6.119 ppm resonances, and is tentatively assigned to a trans-2-alkenal classification with a significantly different carbon chain length range than that giving rise to the characteristic 9.480 ppm signal. (c) Expanded 2.33–2.94 (F1 axis) and 9.68-9.91 ppm (F2 axis) region of the 1H-1H COSY spectrum shown in (a), exhibiting clear distinctions between connectivities arising from three long-chain (A, A1 and B) and one short-chain (D) n-alkanal classification. C represents the 1H-1H correlation for the -CHO and α-CH2 function protons of 4-oxo-n-alkanals. Samples were prepared for 1H-NMR analysis by the method described in [11], and spectra were acquired on the NMR facility described in Figure 2.

Similar articles

Cited by

References

    1. Grootveld M., Ruiz-Rodado V., Silwood C.J.L. Detection, monitoring and deleterious health effects of lipid oxidation products generated in COs during thermal stressing episodes. Inform Am. Oil Chem. Soc. 2014;25:614–624.
    1. Grootveld M., Silwood C.J.L., Addis P., Claxson A.W.D., Bonet Serra B., Viana M. Health effects of oxidised heated oils. Foodserv. Res. Internat. 2001;13:39–53. doi: 10.1111/j.1745-4506.2001.tb00028.x. - DOI
    1. Grootveld M., Percival B.C., Grootveld K.L. Chronic non-communicable disease risks presented by lipid oxidation products in fried foods. Hepatobil. Surg. Nutr. 2018;7:305–312. doi: 10.21037/hbsn.2018.04.01. - DOI - PMC - PubMed
    1. Estévez M., Li Z., Soladoye O.P., Van-Hecke T. Chapter Two - Health Risks of Food Oxidation. Advanc. Food Nutrit. Res. 2017;82:45–81. - PubMed
    1. Jackson V., Penumetcha M. Dietary oxidised lipids, health consequences and novel food technologies that thwart food lipid oxidation: An update. Intern. J. Food Sci. Technol. 2019;54:1981–1988. doi: 10.1111/ijfs.14058. - DOI

Publication types

LinkOut - more resources