. 2020 Apr 1;9(4):982.
doi: 10.3390/jcm9040982.

Master Regulator Analysis of the SARS-CoV-2/Human Interactome

Affiliations

Master Regulator Analysis of the SARS-CoV-2/Human Interactome

Pietro H Guzzi et al. J Clin Med. .

Abstract

The recent epidemic outbreak of a novel human coronavirus called SARS-CoV-2 causing the respiratory tract disease COVID-19 has reached worldwide resonance and a global effort is being undertaken to characterize the molecular features and evolutionary origins of this virus. In this paper, we set out to shed light on the SARS-CoV-2/host receptor recognition, a crucial factor for successful virus infection. Based on the current knowledge of the interactome between SARS-CoV-2 and host cell proteins, we performed Master Regulator Analysis to detect which parts of the human interactome are most affected by the infection. We detected, amongst others, affected apoptotic and mitochondrial mechanisms, and a downregulation of the ACE2 protein receptor, notions that can be used to develop specific therapies against this new virus.

Keywords: COVID-19; SARS-CoV-2; bioinformatics; coronavirus; gene network analysis.


Conflict of interest statement

The authors declare no conflict of interest.

Figures

Figure 1
Figure 1
Representation of the predicted SARS-CoV-2/Human interactome [26] (available for download at http://korkinlab.org/wuhanDataset), containing 200 unique interactions among 125 proteins (nodes). SARS-CoV-2 proteins are depicted as green circles, while human proteins are represented as squares. The color of human protein nodes reflects the integrated effect of MERS and SARS infections on the node network (see Supplementary Table S2) as a Normalized Enrichment Score (NES). Network visualization was performed via Cytoscape [49].
Figure 2
Figure 2
Master Regulator Analysis of the 8 human proteins in the human/SARS-CoV-2 interactome and most concordantly affected by beta-coronavirus infection. The visualization was obtained through the mraplot function of the R CRAN package corto. In brief, for each analyzed network, the centroid is indicated by its gene symbol (e.g., EEF1A1, ACE2). The genes in each network (generated by the corto package from the GTEX healthy lung RNA-Seq dataset) are shown in a barcode-like diagram showing all transcriptome genes by means of their differential expression upon viral infection, from most downregulated (left) to most upregulated (right). Positively- (red) and negatively- (blue) correlated targets are overlayed on the differential expression signature as bars of a different color. Normalized Enrichment Score (NES) and p-value are also indicated. To the right, the 12 highest-likelihood network putative targets of each protein are shown, in red if upregulated, in blue if downregulated, with a pointed arrow if predicted to be activated by the centroid protein, and with a blunt arrow if predicted to be repressed. The figure shows two analyses based on the MERS infection signature (A) and on the SARS infection signature (B). Full results are available as Supplementary Table S2.
Figure 3
Figure 3
Scatterplot depicting the Normalized Enrichment Scores (NES) of the Master Regulator Analysis of human proteins interacting with SARS-CoV-2. Two analyses are compared using the signatures of MERS and SARS infection on human bronchial 2B4 cells. TMPRSS2, along with the 8 most significant proteins by absolute sum of NES, is labeled. Full results are available in Supplementary Table S2.
Figure 4
Figure 4
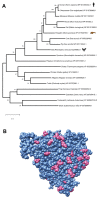
Cross-species analysis of the Angiotensin-converting enzyme 2 (ACE2) protein. (A) Maximum-likelihood evolutionary tree of ACE2 orthologs in selected vertebrates (numbers in the branch points indicate the % bootstrap supporting the branch structure). The tree is drawn to scale, with branch lengths measured in the number of substitutions per site. (B) A visualization of a human ACE2 crystal structure (resolution: 2.2 Å, PDB:1R42). The residues that are conserved across human, pangolin and bat are depicted in cornflower blue, and the residues that are conserved in human and pangolin but differ in bat (Supplementary Table S3) are depicted in opaque pink.

References

    1. Cui J., Li F., Shi Z.-L. Origin and evolution of pathogenic coronaviruses. Nat. Rev. Microbiol. 2019;17:181–192. doi: 10.1038/s41579-018-0118-9. - DOI - PMC - PubMed
    1. Tortorici M.A., Veesler D. Advances in Virus Research. Volume 105. Elsevier; Amsterdam, The Netherlands: 2019. Structural insights into coronavirus entry; pp. 93–116. - PMC - PubMed
    1. Zeng Z.-Q., Chen D.-H., Tan W.-P., Qiu S.-Y., Xu D., Liang H.-X., Chen M.-X., Li X., Lin Z.-S., Liu W.-K., et al. Epidemiology and clinical characteristics of human coronaviruses OC43, 229E, NL63, and HKU1: A study of hospitalized children with acute respiratory tract infection in Guangzhou, China. Eur. J. Clin. Microbiol. Infect. Dis. 2018;37:363–369. doi: 10.1007/s10096-017-3144-z. - DOI - PMC - PubMed
    1. Zhu N., Zhang D., Wang W., Li X., Yang B., Song J., Zhao X., Huang B., Shi W., Lu R., et al. A Novel Coronavirus from Patients with Pneumonia in China, 2019. N. Engl. J. Med. 2020;382:727–733. doi: 10.1056/NEJMoa2001017. - DOI - PMC - PubMed
    1. Zhong N., Zheng B., Li Y., Poon L., Xie Z., Chan K., Li P., Tan S., Chang Q., Xie J., et al. Epidemiology and cause of severe acute respiratory syndrome (SARS) in Guangdong, People’s Republic of China, in February, 2003. Lancet. 2003;362:1353–1358. doi: 10.1016/S0140-6736(03)14630-2. - DOI - PMC - PubMed

LinkOut - more resources