. 2020 Apr 1;21(7):2454.
doi: 10.3390/ijms21072454.

Differential Inhibition of Human Nav1.2 Resurgent and Persistent Sodium Currents by Cannabidiol and GS967

Affiliations

Differential Inhibition of Human Nav1.2 Resurgent and Persistent Sodium Currents by Cannabidiol and GS967

Emily R Mason et al. Int J Mol Sci. .

Abstract

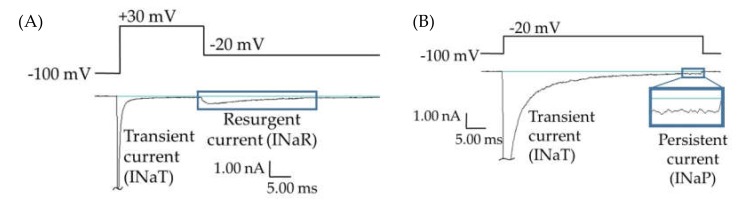
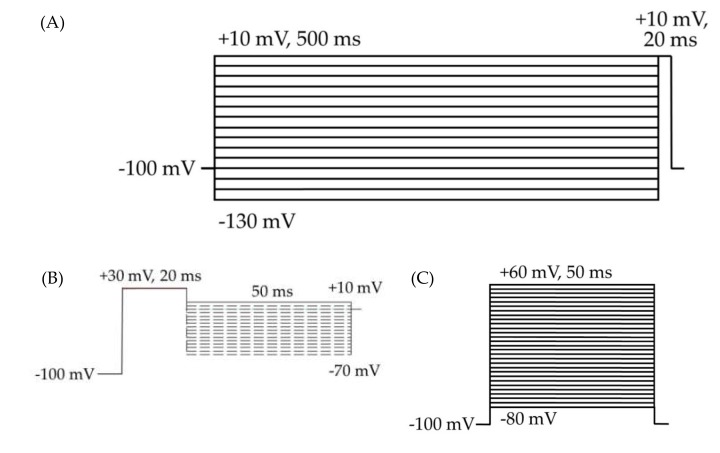
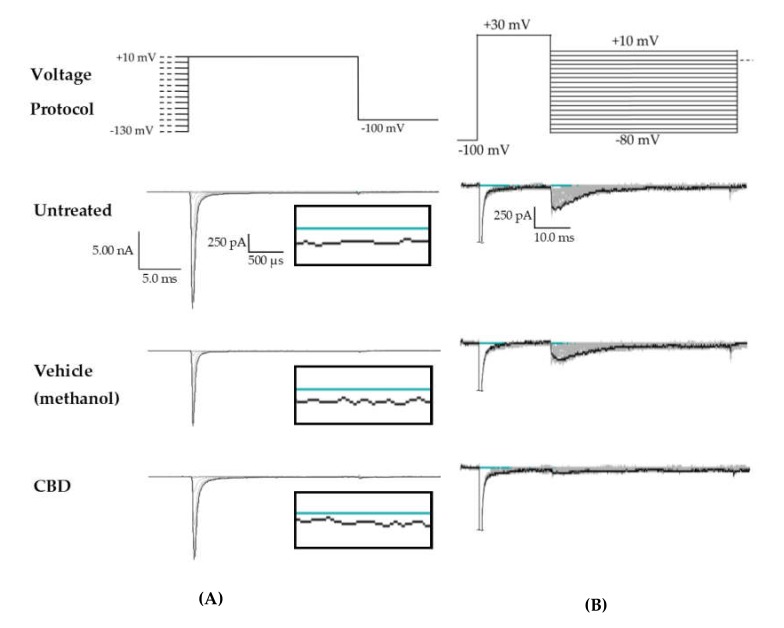
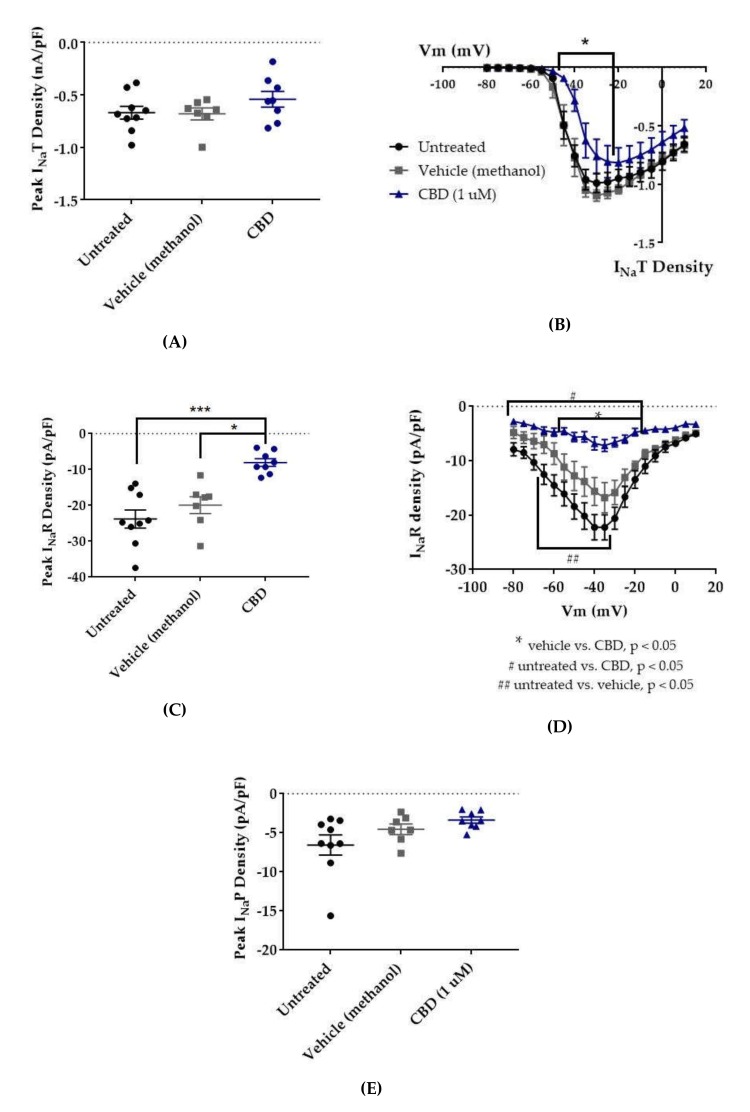
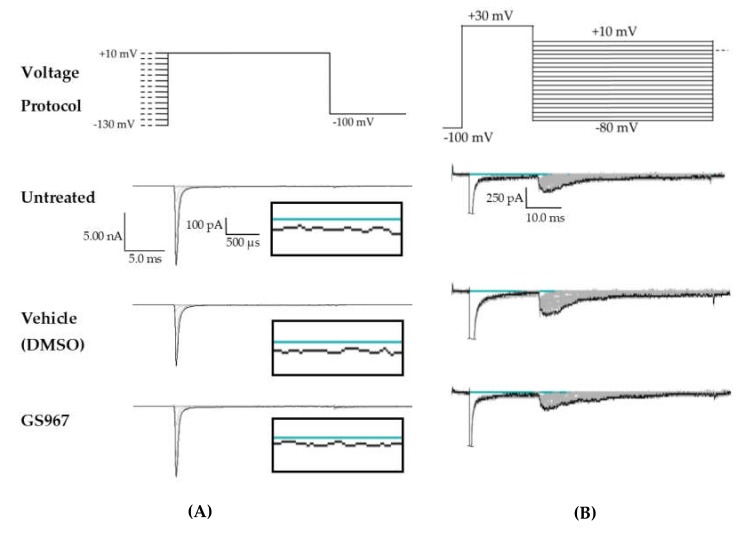
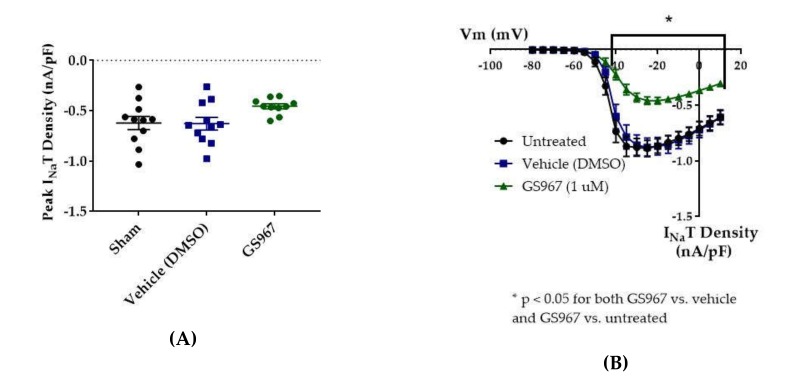
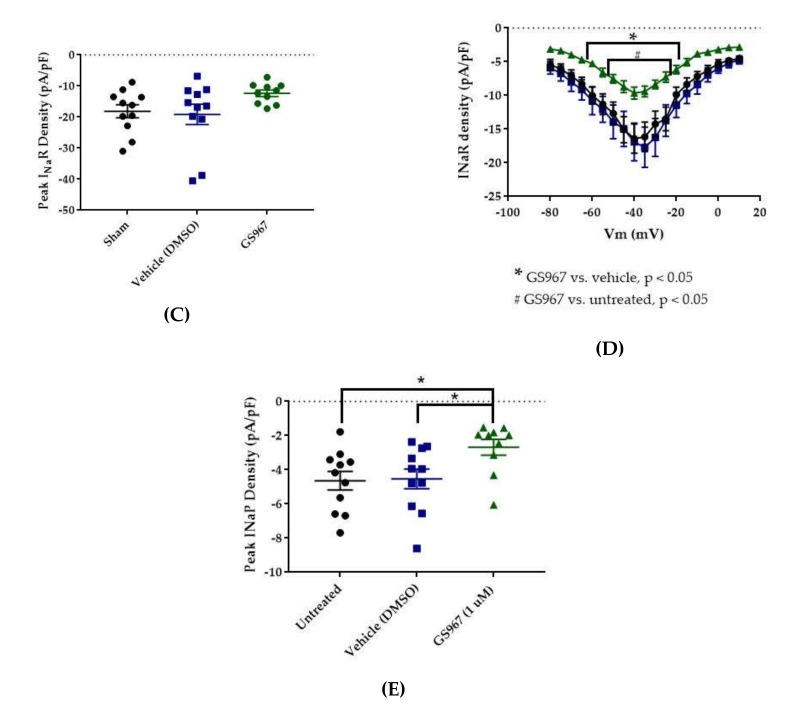
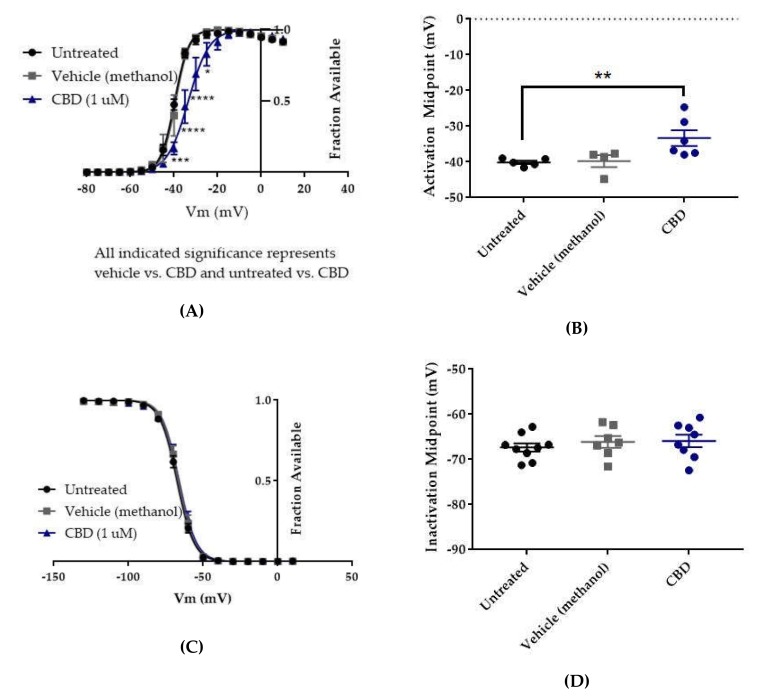
Many epilepsy patients are refractory to conventional antiepileptic drugs. Resurgent and persistent currents can be enhanced by epilepsy mutations in the Nav1.2 channel, but conventional antiepileptic drugs inhibit normal transient currents through these channels, along with aberrant resurgent and persistent currents that are enhanced by Nav1.2 epilepsy mutations. Pharmacotherapies that specifically target aberrant resurgent and/or persistent currents would likely have fewer unwanted side effects and be effective in many patients with refractory epilepsy. This study investigated the effects of cannbidiol (CBD) and GS967 (each at 1 μM) on transient, resurgent, and persistent currents in human embryonic kidney (HEK) cells stably expressing wild-type hNav1.2 channels. We found that CBD preferentially inhibits resurgent currents over transient currents in this paradigm; and that GS967 preferentially inhibits persistent currents over transient currents. Therefore, CBD and GS967 may represent a new class of more targeted and effective antiepileptic drugs.

Keywords: CBD; GS967; Nav1.2; Prax330; antiepileptic drugs; cannabidiol; persistent current; resurgent current; voltage-gated sodium channels.


Conflict of interest statement

The authors declare no conflict of interest.

Figures

Figure 1
Figure 1
Persistent and resurgent currents. (A) A raw current trace from a human embryonic kidney (HEK) cell expressing hNav1.2 cDNA. Peak resurgent current (blue box) was measured as the peak current occurring during the repolarization pulse in the resurgent current voltage protocol (single step from the protocol shown above the trace). (B) A raw current trace from an HEK cell expressing hNav1.2 cDNA. Peak persistent current (blue box) was measured as the average current over the last 5 ms of a 50 ms depolarization pulse (shown above the trace). Inset shows persistent current, amplified 5×.
Figure 2
Figure 2
HEK cell electrophysiology voltage protocols. Cells were held at −100 mV for all three protocols. (A) Voltage protocol for the analysis of inactivation and transient currents. The 500 ms depolarizing prepulses from −130 to +10 mV, in 10 mV steps, followed by a 20 ms test pulse at +10 mV. (B) Resurgent current protocol. (C) Voltage protocol for the analysis of activation, transient currents, persistent currents, and gating pore currents. The 50 ms square pulses from −80 to +60 mV, in 5 mV steps.
Figure 3
Figure 3
Raw data from cannbidiol (CBD) treatments. (A) Voltage protocol used to evaluate transient current (INaT) and persistent current (INaP) (top) and raw current trace families from representative cells, with the trace from the –130 mV prepulse step highlighted. Inset (box) shows zoom view of persistent current (INaP). (B) Voltage protocol used to evaluate resurgent current (INaR) (top) and raw current trace families from representative cells, with peak resurgent current trace highlighted.
Figure 4
Figure 4
Effects of cannabidiol (CBD) on wild-type (WT) hNav1.2 in stable human embryonic kidney (HEK) cell lines. The Navβ4 peptide was included in the pipette solution for all experiments with CBD. Unless otherwise indicated, * p < 0.05, *** p < 0.001. (A) The maximal peak transient current density of each cell is plotted; average and SEM for each group is indicated by bars. Significance was determined by Kruskal–Wallis test. n = 9 untreated, 7 vehicle (methanol), 8 CBD. (B) The maximal peak resurgent current density of each cell is plotted; average and standard error of the mean (SEM) for each group is indicated by bars. Significance was determined by two-way ANOVA with Tukey’s multiple comparisons. *p < 0.05, CBD vs. vehicle. n = 9 untreated, 7 vehicle (methanol), 8 CBD. (C) The maximal peak persistent current density of each cell is plotted; average and SEM for each group is indicated by bars. Significance was determined by Kruskal–Wallis test with Dunn’s multiple comparisons. n = 9 untreated, 7 vehicle (methanol), 8 CBD. (D) Average current densities elicited by voltage steps from −80 to +10 mV. Significance was determined by two-way ANOVA with Tukey’s multiple comparisons. *p < 0.05, CBD vs. vehicle, #p < 0.05, CBD vs. untreated, ##p < 0.05, vehicle vs. untreated. n = 9 untreated, 7 vehicle (methanol), 8 CBD. (E) Average peak resurgent current densities over a range of voltages from −65 to +5 mV. Significance was determined by Kruskal–Wallis test. n = 9 untreated, 7 vehicle (methanol), 8 CBD.
Figure 5
Figure 5
Raw data from GS967 treatments. (A) Voltage protocol used to evaluate transient current (INaT) and persistent current (INaP) (top) and raw current trace families from representative cells, with the trace from the –130 mV prepulse step highlighted. Inset (box) shows zoom view of persistent current (INaP). (B) Voltage protocol used to evaluate resurgent current (INaR) (top) and raw current trace families from representative cells, with peak resurgent current trace highlighted.
Figure 6
Figure 6
Effects of GS967 on WT hNav1.2 in stable HEK cell lines. The Navβ4 peptide was included in the pipette solution for all experiments with GS967. (A) The maximal peak transient current density of each cell is plotted; average and SEM for each group is indicated by bars. Significance was determined by one-way ANOVA. n = 11 untreated, 11 vehicle, 10 GS967. (B) The maximal peak resurgent current density of each cell is plotted; average and SEM for each group is indicated by bars. Significance was determined by two-way ANOVA with Tukey’s multiple comparisons. *p < 0.05 for both GS967 vs. vehicle and GS967 vs. untreated. n = 11 untreated, 11 vehicle, 10 GS967. (C) The maximal peak resurgent current density of each cell is plotted; average and SEM for each group is indicated by bars. Significance was determined by one-way ANOVA. n = 11 untreated, 11 vehicle, 10 GS967. (D) Average current densities elicited by voltage steps from −80 to +10 mV. Significance was determined by two-way ANOVA with Tukey’s multiple comparisons. *p < 0.05, GS967 vs. vehicle, #p < 0.05, GS967 vs. untreated. n = 11 untreated, 11 vehicle, 9 GS967. (E) Average peak resurgent current densities over a range of voltages from −65 to +5 mV. Significance was determined by Kruskal–Wallis test with Dunn’s multiple comparisons. n = 11 untreated, 11 vehicle, 10 GS967. DMSO = dimethyl sulfoxide.
Figure 6
Figure 6
Effects of GS967 on WT hNav1.2 in stable HEK cell lines. The Navβ4 peptide was included in the pipette solution for all experiments with GS967. (A) The maximal peak transient current density of each cell is plotted; average and SEM for each group is indicated by bars. Significance was determined by one-way ANOVA. n = 11 untreated, 11 vehicle, 10 GS967. (B) The maximal peak resurgent current density of each cell is plotted; average and SEM for each group is indicated by bars. Significance was determined by two-way ANOVA with Tukey’s multiple comparisons. *p < 0.05 for both GS967 vs. vehicle and GS967 vs. untreated. n = 11 untreated, 11 vehicle, 10 GS967. (C) The maximal peak resurgent current density of each cell is plotted; average and SEM for each group is indicated by bars. Significance was determined by one-way ANOVA. n = 11 untreated, 11 vehicle, 10 GS967. (D) Average current densities elicited by voltage steps from −80 to +10 mV. Significance was determined by two-way ANOVA with Tukey’s multiple comparisons. *p < 0.05, GS967 vs. vehicle, #p < 0.05, GS967 vs. untreated. n = 11 untreated, 11 vehicle, 9 GS967. (E) Average peak resurgent current densities over a range of voltages from −65 to +5 mV. Significance was determined by Kruskal–Wallis test with Dunn’s multiple comparisons. n = 11 untreated, 11 vehicle, 10 GS967. DMSO = dimethyl sulfoxide.
Figure 7
Figure 7
Effects of CBD on WT hNav1.2 gating in stable HEK cell lines. Unless otherwise indicated, * p < 0.05, ** p < 0.01, *** p < 0.001, **** p < 0.0001. (A) Activation curves. Conductance was calculated as G/Gmax, where G = I/(Vm-Vrev), Vrev = reversal potential, and Gmax = maximum inward conductance across all tested voltages. Significance was determined by two-way ANOVA with Tukey’s multiple comparisons. All indicated significance represents both CBD vs. vehicle and CBD vs. untreated. n = 5 untreated, 4 vehicle, 6 CBD. (B) The estimated activation midpoint for each cell is plotted; average and SEM for each group is indicated by bars. Significance was determined by Kruskal–Wallis test with Dunn’s multiple comparisons. n = 5 untreated, 4 vehicle, 6 CBD. (C) Inactivation curves. Fraction available was calculated as I/Imax for each cell at each voltage step. Significance was determined by two-way ANOVA with Tukey’s multiple comparisons. n = 9 untreated, 7 vehicle, 8 CBD. (D) The estimated inactivation midpoint for each cell is plotted; average and SEM for each group is indicated by bars. Significance was determined by Kruskal–Wallis test. n = 9 untreated, 7 vehicle, 8 CBD.
Figure 8
Figure 8
Effects of GS967 on WT hNav1.2 gating in stable HEK cell lines. (A) Activation curves. Conductance was calculated as G/Gmax, where G = I/(Vm-Vrev), Vrev = reversal potential, and Gmax = maximum inward conductance across all tested voltages. Significance was determined by two-way ANOVA with Tukey’s multiple comparisons. ***p < 0.0001, vehicle vs. untreated, *p < 0.05, GS967 vs. untreated. n = 8 untreated, 5 vehicle, 10 GS967. (B) The estimated activation midpoint for each cell is plotted; average and SEM for each group is indicated by bars. Significance was determined by Kruskal–Wallis test with Dunn’s multiple comparisons. n = 8 untreated, 5 vehicle, 10 GS967. (C) Inactivation curves. Fraction available was calculated as I/Imax for each cell at each voltage step. Significance was determined by two-way ANOVA with Tukey’s multiple comparisons. ***p < 0.001, GS967 vs. untreated and GS967 vs. vehicle. n = 12 untreated, 11 vehicle, 10 GS967. (D) The estimated inactivation midpoint for each cell is plotted; average and SEM for each group is indicated by bars. Significance was determined by one-way ANOVA with Tukey’s multiple comparisons. n = 12 untreated, 11 vehicle, 10 GS967. **** p < 0.0001.

Similar articles

Cited by

References

    1. French J.A. Refractory epilepsy: clinical overview. Epilepsia. 2007;48:3–7. doi: 10.1111/j.1528-1167.2007.00992.x. - DOI - PubMed
    1. Beleza P. Refractory epilepsy: a clinically oriented review. Eur. Neurol. 2009;62:65–71. doi: 10.1159/000222775. - DOI - PubMed
    1. Löscher W., Klitgaard H., Twyman R.E., Schmidt D. New avenues for anti-epileptic drug discovery and development. Nat. Rev. Drug Disc. 2013;12:757–776. doi: 10.1038/nrd4126. - DOI - PubMed
    1. Laxer K.D., Trinka E., Hirsch L.J., Cendes F., Langfitt J., Delanty N., Resnick T., Benbadis S.R. The consequences of refractory epilepsy and its treatment. Epilepsy Behav. 2014;37:59–70. doi: 10.1016/j.yebeh.2014.05.031. - DOI - PubMed
    1. Moshe S.L., Perucca E., Ryvlin P., Tomson T. Epilepsy: new advances. Lancet. 2015;385:884–898. doi: 10.1016/S0140-6736(14)60456-6. - DOI - PubMed

MeSH terms

Substances

LinkOut - more resources