

Influence of Salt Stress on Growth of Spermosphere Bacterial Communities in Different Peanut (Arachis hypogaea L.) Cultivars
- PMID: 32244906
- PMCID: PMC7139419
- DOI: 10.3390/ijms21062131
Influence of Salt Stress on Growth of Spermosphere Bacterial Communities in Different Peanut (Arachis hypogaea L.) Cultivars
Abstract
Background: Exposure of seeds to high salinity can cause reduced germination and poor seedling establishment. Improving the salt tolerance of peanut (Arachis hypogaea L.) seeds during germination is an important breeding goal of the peanut industry. Bacterial communities in the spermosphere soils may be of special importance to seed germination under salt stress, whereas extant results in oilseed crop peanut are scarce.
Methods: Here, bacterial communities colonizing peanut seeds with salt stress were characterized using 16S rRNA gene sequencing.
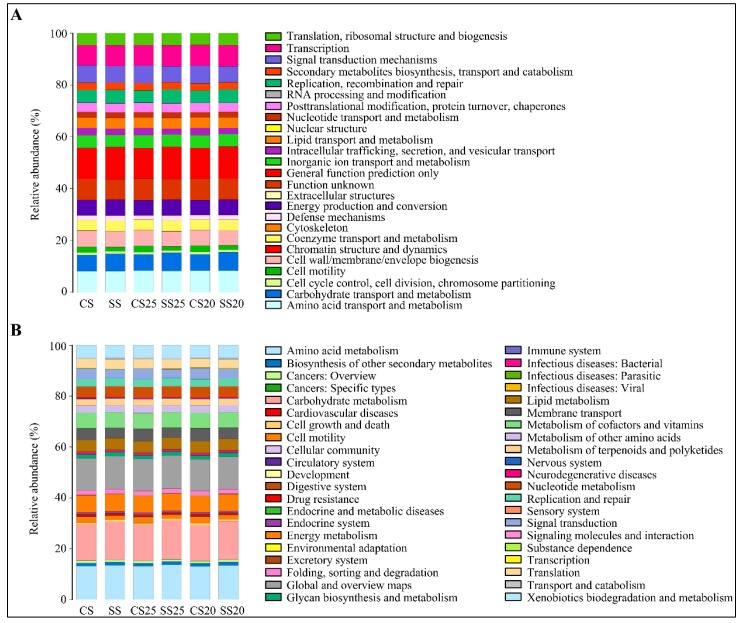
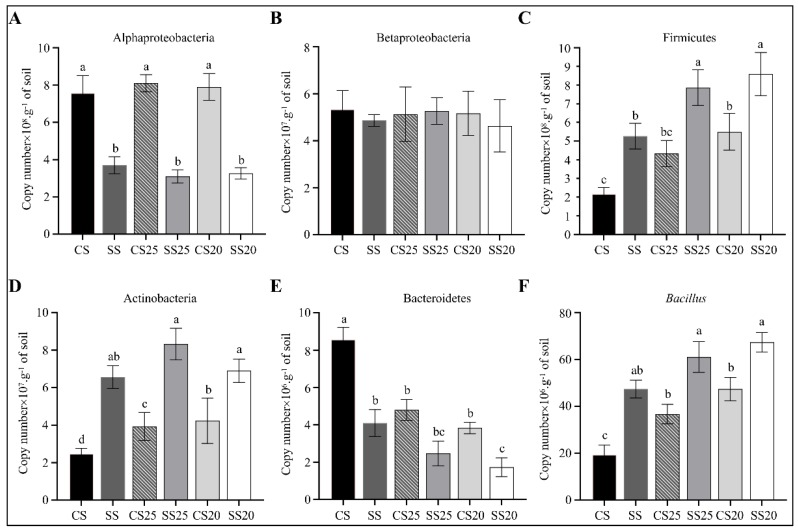
Results: Peanut spermosphere was composed of four dominant genera: Bacillus, Massilia, Pseudarthrobacter, and Sphingomonas. Comparisons of bacterial community structure revealed that the beneficial bacteria (Bacillus), which can produce specific phosphatases to sequentially mineralize organic phosphorus into inorganic phosphorus, occurred in relatively higher abundance in salt-treated spermosphere soils. Further soil enzyme activity assays showed that phosphatase activity increased in salt-treated spermosphere soils, which may be associated with the shift of Bacillus.
Conclusion: This study will form the foundation for future improvement of salt tolerance of peanuts at the seed germination stage via modification of the soil microbes.
Keywords: bacterial community diversity; peanut (Arachis hypogaea L.); peanut cultivars; salt stress; spermosphere.
Conflict of interest statement
The authors declare no conflict of interest.
Figures


Similar articles
-
Influence of salt stress on the rhizosphere soil bacterial community structure and growth performance of groundnut (Arachis hypogaea L.).Int Microbiol. 2020 Aug;23(3):453-465. doi: 10.1007/s10123-020-00118-0. Epub 2020 Jan 13. Int Microbiol. 2020. PMID: 31933013
-
The synergy effect of arbuscular mycorrhizal fungi symbiosis and exogenous calcium on bacterial community composition and growth performance of peanut (Arachis hypogaea L.) in saline alkali soil.J Microbiol. 2021 Jan;59(1):51-63. doi: 10.1007/s12275-021-0317-3. Epub 2020 Nov 17. J Microbiol. 2021. PMID: 33201434
-
Comprehensive effects of salt stress and peanut cultivars on the rhizosphere bacterial community diversity of peanut.Arch Microbiol. 2021 Dec 11;204(1):15. doi: 10.1007/s00203-021-02619-6. Arch Microbiol. 2021. PMID: 34894277
-
Interaction among Arachis hypogaea L. (peanut) and beneficial soil microorganisms: how much is it known?Crit Rev Microbiol. 2010 Aug;36(3):179-94. doi: 10.3109/10408410903584863. Crit Rev Microbiol. 2010. PMID: 20214416 Review.
-
A review: what is the spermosphere and how can it be studied?J Appl Microbiol. 2015 Dec;119(6):1467-81. doi: 10.1111/jam.12946. Epub 2015 Oct 2. J Appl Microbiol. 2015. PMID: 26332271 Review.
Cited by
-
Microbial inoculants - fostering sustainability in groundnut production.Sci Prog. 2025 Apr-Jun;108(2):368504251338943. doi: 10.1177/00368504251338943. Epub 2025 May 5. Sci Prog. 2025. PMID: 40324969 Free PMC article. Review.
-
Genome-wide analysis of the peanut CaM/CML gene family reveals that the AhCML69 gene is associated with resistance to Ralstonia solanacearum.BMC Genomics. 2024 Feb 21;25(1):200. doi: 10.1186/s12864-024-10108-5. BMC Genomics. 2024. PMID: 38378471 Free PMC article.
-
Green manure increases peanut production by shaping the rhizosphere bacterial community and regulating soil metabolites under continuous peanut production systems.BMC Plant Biol. 2023 Feb 1;23(1):69. doi: 10.1186/s12870-023-04079-0. BMC Plant Biol. 2023. PMID: 36726076 Free PMC article.
-
Genome-Wide Identification of Auxin Response Factors in Peanut (Arachis hypogaea L.) and Functional Analysis in Root Morphology.Int J Mol Sci. 2022 May 10;23(10):5309. doi: 10.3390/ijms23105309. Int J Mol Sci. 2022. PMID: 35628135 Free PMC article.
-
Comparative metagenomic analysis reveals rhizosphere microbial community composition and functions help protect grapevines against salt stress.Front Microbiol. 2023 Feb 20;14:1102547. doi: 10.3389/fmicb.2023.1102547. eCollection 2023. Front Microbiol. 2023. PMID: 36891384 Free PMC article.
References
-
- Chakraborty K., Bhaduri D., Meena H.N., Kalariya K. External potassium (K+) application improves salinity tolerance by promoting Na+-exclusion, K+-accumulation and osmotic adjustment in contrasting peanut cultivars. Plant Physiol. Biochem. 2016;103:143–153. doi: 10.1016/j.plaphy.2016.02.039. - DOI - PubMed
MeSH terms
Substances
Grants and funding
- 31971856/National Natural Science Foundation of China
- 31901574/National Natural Science Foundation of China
- CXGC2018E21/Agricultural Scientific and the Technological Innovation Project of Shandong Academy of Agricultural Sciences
- 2019JZZY010702/Major Scientific and Technological Innovation Projects in Shandong Province
LinkOut - more resources
Full Text Sources
