

Qualitative Field Observation of Pedestrian Injury Hotspots: A Mixed-Methods Approach for Developing Built- and Socioeconomic-Environmental Risk Signatures
- PMID: 32244976
- PMCID: PMC7143108
- DOI: 10.3390/ijerph17062066
Qualitative Field Observation of Pedestrian Injury Hotspots: A Mixed-Methods Approach for Developing Built- and Socioeconomic-Environmental Risk Signatures
Abstract
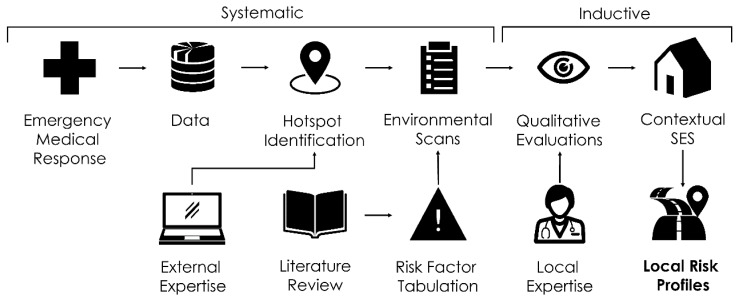
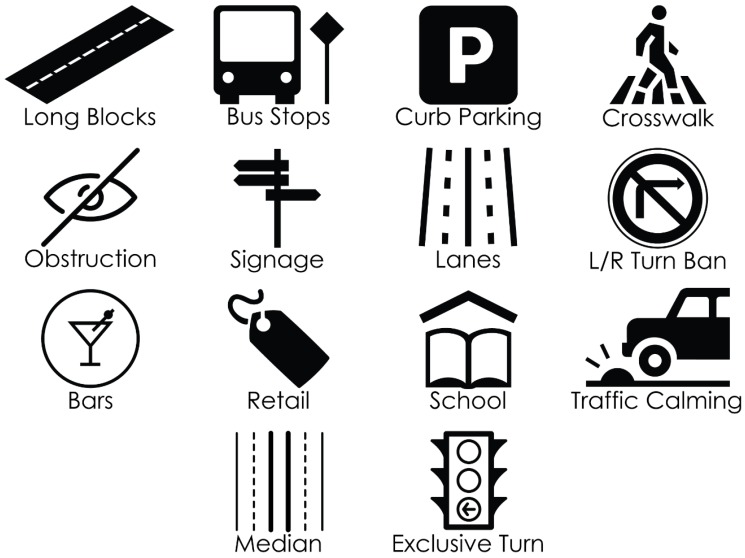
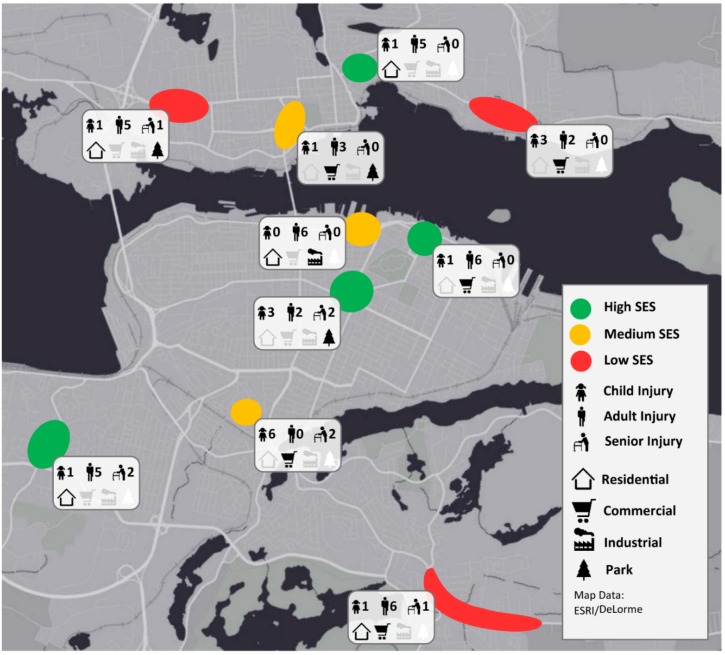
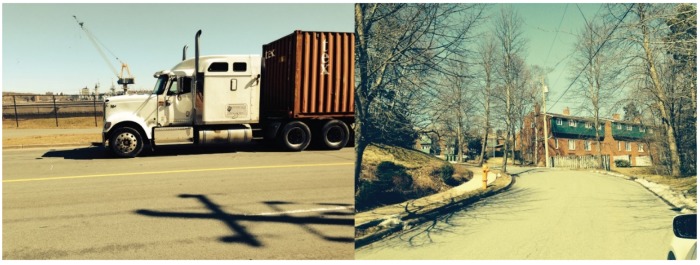
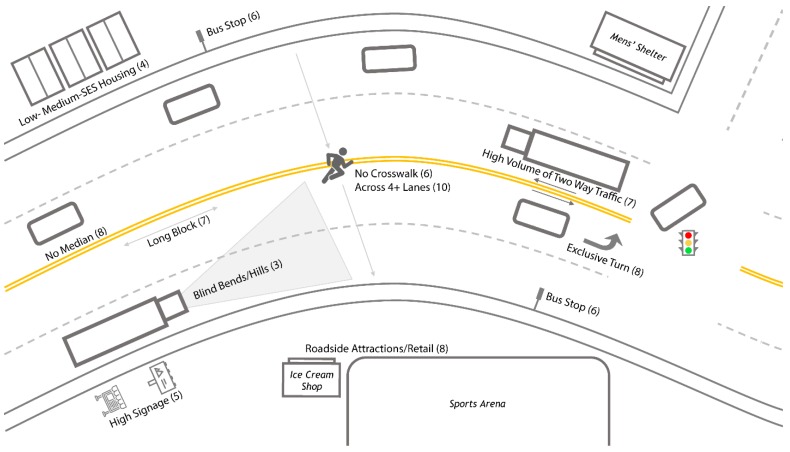
Road traffic injuries constitute a significant global health burden; the World Health Organization estimates that they result in 1.35 million deaths annually. While most pedestrian injury studies rely predominantly on statistical modelling, this paper argues for a mixed-methods approach combining spatial analysis, environmental scans, and local knowledge for assessing environmental risk factors. Using data from the Nova Scotia Trauma Registry, severe pedestrian injury cases and ten corresponding hotspots were mapped across the Halifax Regional Municipality. Using qualitative observation, quantitative environmental scans, and a socioeconomic deprivation index, we assessed hotspots over three years to identify key social- and built-environmental correlates. Injuries occurred in a range of settings; however, clear patterns were not observed based on land use, age, or socio-economic status (SES) alone. Three hotspots revealed an association between elevated pedestrian injury and a pattern of geographic, environmental, and socio-economic factors: low- to middle-SES housing separated from a roadside attraction by several lanes of traffic, and blind hills/bends. An additional generalized scenario was constructed representing common risk factors across all hotspots. This study is unique in that it moves beyond individual measures (e.g., statistical, environmental scans, or geographic information systems (GIS) mapping) to combine all three methods toward identifying environmental features associated with pedestrian motor vehicle crashes (PMVC).
Keywords: geographic information systems; hotspots; mapping; mixed methods; pedestrian injury; socio-economic status.
Conflict of interest statement
The authors declare no conflict of interest.
Figures
References
-
- Haagsma J.A., Graetz N., Bolliger I., Naghavi M., Higashi H., Mullany E.C., Abera S.F., Abraham J.P., Adofo K., Alsharif U., et al. The global burden of injury: Incidence, mortality, disability-adjusted life years and time trends from the Global Burden of Disease study 2013. Inj. Prev. 2015;22:3–18. doi: 10.1136/injuryprev-2015-041616. - DOI - PMC - PubMed
-
- World Health Organization YLL Estimates, 2000–2012. [(accessed on 12 December 2016)]; Available online: http://www.who.int/healthinfo/global_burden_disease/estimates/en/
-
- World Health Organization Road Traffic Injuries. [(accessed on 10 February 2020)]; Available online: https://www.who.int/news-room/fact-sheets/detail/road-traffic-injuries.
MeSH terms
LinkOut - more resources
Full Text Sources
Medical
