. 2020 Mar 21;10(3):479.
doi: 10.3390/biom10030479.

1 H-Imidazole-2,5-Dicarboxamides as NS4A Peptidomimetics: Identification of a New Approach to Inhibit HCV-NS3 Protease

Affiliations

1 H-Imidazole-2,5-Dicarboxamides as NS4A Peptidomimetics: Identification of a New Approach to Inhibit HCV-NS3 Protease

Abdelsattar M Omar et al. Biomolecules. .

Abstract

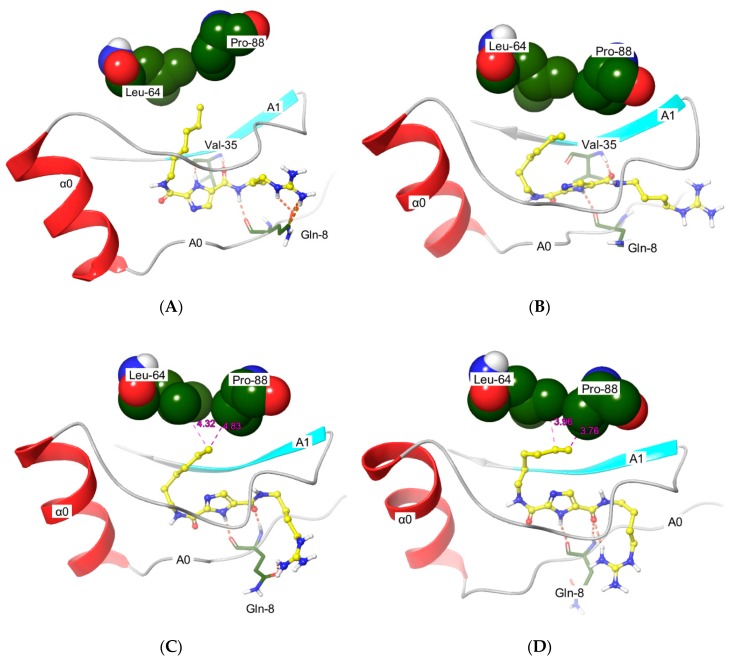
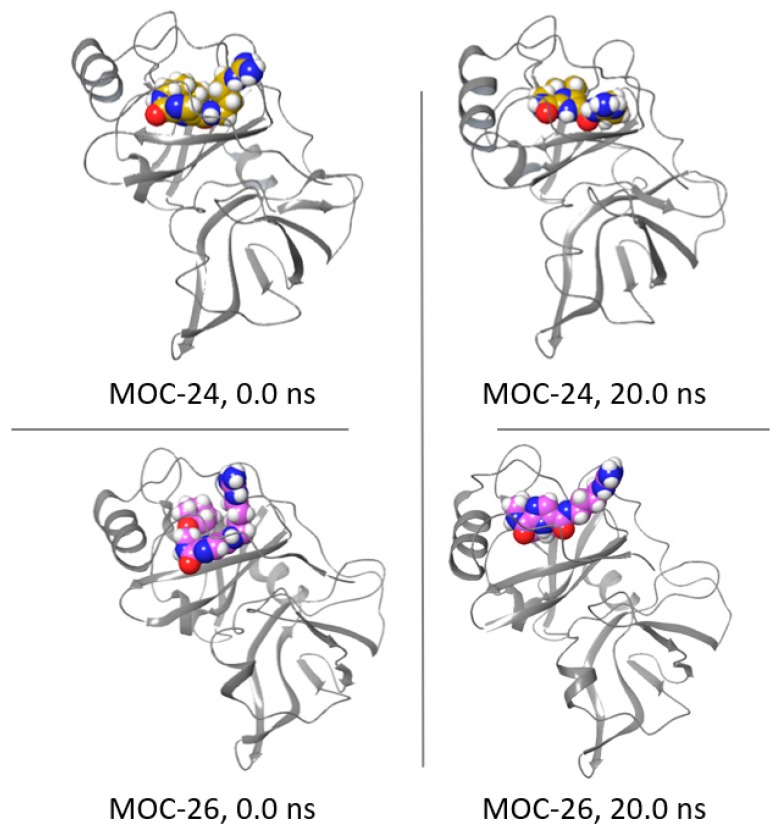
The nonstructural (NS) protein NS3/4A protease is a critical factor for hepatitis C virus (HCV) maturation that requires activation by NS4A. Synthetic peptide mutants of NS4A were found to inhibit NS3 function. The bridging from peptide inhibitors to heterocyclic peptidomimetics of NS4A has not been considered in the literature and, therefore, we decided to explore this strategy for developing a new class of NS3 inhibitors. In this report, a structure-based design approach was used to convert the bound form of NS4A into 1H-imidazole-2,5-dicarboxamide derivatives as first generation peptidomimetics. This scaffold mimics the buried amino acid sequence Ile-25` to Arg-28` at the core of NS4A21`-33` needed to activate the NS3 protease. Some of the synthesized compounds (Coded MOC) were able to compete with and displace NS4A21`-33` for binding to NS3. For instance, N5-(4-guanidinobutyl)-N2-(n-hexyl)-1H-imidazole-2,5-dicarboxamide (MOC-24) inhibited the binding of NS4A21`-33` with a competition half maximal inhibitory concentration (IC50) of 1.9 ± 0.12 µM in a fluorescence anisotropy assay and stabilized the denaturation of NS3 by increasing the aggregation temperature (40% compared to NS4A21`-33`). MOC-24 also inhibited NS3 protease activity in a fluorometric assay. Molecular dynamics simulations were conducted to rationalize the differences in structure-activity relationship (SAR) between the active MOC-24 and the inactive MOC-26. Our data show that MOC compounds are possibly the first examples of NS4A peptidomimetics that have demonstrated promising activities against NS3 proteins.

Keywords: DSLS; Flaviviridae; NS3 inhibitors; NS4A; allosteric inhibitors; binding assay; hepatitis C virus; imidazole; molecular dynamics; peptidomimetics.


Conflict of interest statement

The authors declare no conflict of interest.

Figures

Figure 1
Figure 1
(A) The planar kink region of nonstructural (NS)4A extracted from crystal structure 1NS3 (Protein Data Bank (PDB) Code: 1NS3) is shadowed. (B) De novo design of 1H-imidazole-2,5-diamide derivatives that mimic this planar area.
Figure 2
Figure 2
The conservation of important hydrogen bonding in the structure-based design. (A) Interactions of NS4A (light green) with some NS3 residues (yellow). (B) Designed imidazole-2,5-dicarboxamide (light blue).
Scheme 1
Scheme 1
Synthesis of NS4A peptidomimetics and the structures of screened compounds. Reagents and conditions: (a) NH2OH·HCl, Na2CO3, EtOH, H2O (b) Et3N, toluene, microwave (MW) (120 °C, 300 W, 13 min. (c) Trifluoroacetic acid (TFA), dichloromethane (DCM), 12 h. (d) 1-Ethyl-3-(3-dimethylaminopropyl)carbodiimide (EDCI), 1-hydroxybenzotriazole hydrate (HOBt), DIPEA, THF, room temperature to 60 °C. (e) THF, H2O (f) Propylphosphonic anhydride (T3P), THF, 24–48 h. (g) Dioxane, DCM.
Figure 3
Figure 3
(A) Bar graph representation of changes in thermal stability (ΔTagg) of NS3 when mixed with MOC derivatives or NS4A (n = 3). (BE) Plot graphs of protein aggregation (% light intensity) increase by increasing temperature (°C). The aggregation curve of NS3 domain alone is shown in the right bundles. The left bundles are for NS3 domain mixed with peptides as follows: (B) NS4A21`–33`, (C) MOC-11, (D) MOC-23 and (E) MOC-24.
Figure 3
Figure 3
(A) Bar graph representation of changes in thermal stability (ΔTagg) of NS3 when mixed with MOC derivatives or NS4A (n = 3). (BE) Plot graphs of protein aggregation (% light intensity) increase by increasing temperature (°C). The aggregation curve of NS3 domain alone is shown in the right bundles. The left bundles are for NS3 domain mixed with peptides as follows: (B) NS4A21`–33`, (C) MOC-11, (D) MOC-23 and (E) MOC-24.
Figure 4
Figure 4
Fluorescence anisotropy competition assay for MOC-24. The emitted fluorescence was measured (480/520 nm) proportional to the amount of bound FITC-NS4A21`–33` (Y axis).
Figure 5
Figure 5
The effect of MOC-24 on the NS3 activity (n = 5). Neg_Ctrl = NS3 alone, MOC-24 = NS3 mixed with MOC-24 and Pos_Ctrl = NS3 mixed with NS4A21`–33`. The emitted fluorescence (Y axis) are proportional to the catalytic activity of the enzyme (n = 3).
Figure 6
Figure 6
Plot of the MOC-24 root mean square deviation (RMSD) (red, right Y scale) and NS3 protein backbone RMSD (green, left Y scale) against simulation time. The dashed lines indicate distinct phases of protein and ligand conformation evolving over the simulation time.
Figure 7
Figure 7
Root mean square fluctuations (RMSF) of MOC-24 heavy atoms. Note the highest conformational instability of the guanidine terminal and low motility of both the imidazole diamide core and the n-hexyl side chain.
Figure 8
Figure 8
Interactions of MOC-24 (yellow) with the most important residues (green) at the significant time frames. (A) At the start of the simulations, (B) at 10 ns when protein stability started, (C) at 13.4 ns when imidazole-2,5-diamide completely flipped, and (D) at the end of the molecular dynamics (MD) simulation. Hydrogen bonds are dashed lines in orange, valid van der Waals (VdW) interaction distances are shown as dashed lines, and numerical values are displayed in angstroms with a magenta color.
Figure 9
Figure 9
Change in the positioning of MOC-24 (upper, ligand colored golden yellow) and MOC-26 (lower, ligand colored magenta). The right images are for protein-ligand (PL) complexes before the start of the MD simulations and the left two images are for PL complexes after completion of the MD simulations.

Similar articles

References

    1. WHO Global Hepatitis Report. [(accessed on 21 January 2020)];2017 Available online: https://www.who.int/hepatitis/publications/global-hepatitis-report2017/en/
    1. Friedrich M.J. Third millennium challenge: Hepatitis C. JAMA. 1999;282:221–222. - PubMed
    1. Dickson R.C. Clinical manifestations of hepatitis C. Clin. Liver Dis. 1997;1:569–585. doi: 10.1016/S1089-3261(05)70322-6. - DOI - PubMed
    1. Stanaway J.D., Flaxman A.D., Naghavi M., Fitzmaurice C., Vos T., Abubakar I., Abu-Raddad L.J., Assadi R., Bhala N., Cowie B., et al. The global burden of viral hepatitis from 1990 to 2013: Findings from the Global Burden of Disease Study 2013. Lancet. 2016;388:1081–1088. doi: 10.1016/S0140-6736(16)30579-7. - DOI - PMC - PubMed
    1. North C.S., Hong B.A., Adewuyi S.A., Pollio D.E., Jain M.K., Devereaux R., Quartey N.A., Ashitey S., Lee W.M., Lisker-Melman M. Hepatitis C treatment and SVR: The gap between clinical trials and real-world treatment aspirations. Gen. Hosp. Psychiatry. 2013;35:122–128. doi: 10.1016/j.genhosppsych.2012.11.002. - DOI - PubMed

MeSH terms

Substances