

Structural Features of Triethylammonium Acetate through Molecular Dynamics
- PMID: 32245229
- PMCID: PMC7146455
- DOI: 10.3390/molecules25061432
Structural Features of Triethylammonium Acetate through Molecular Dynamics
Abstract
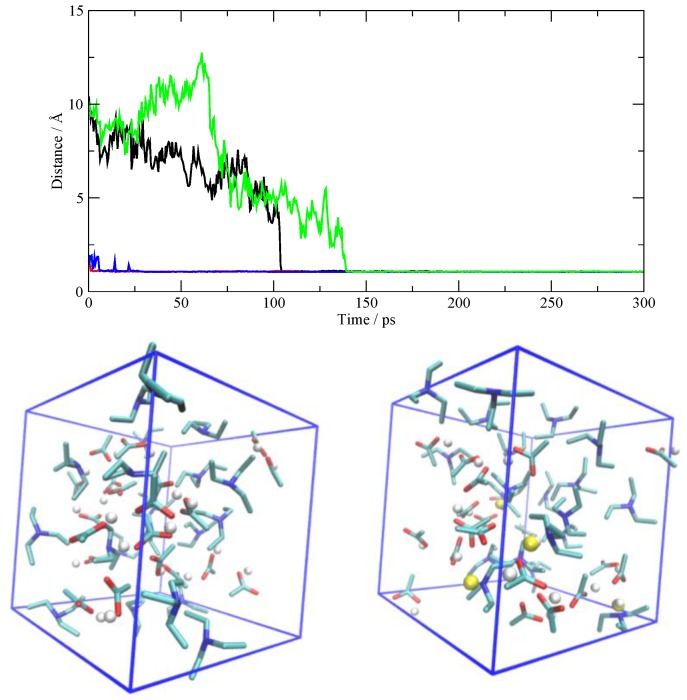
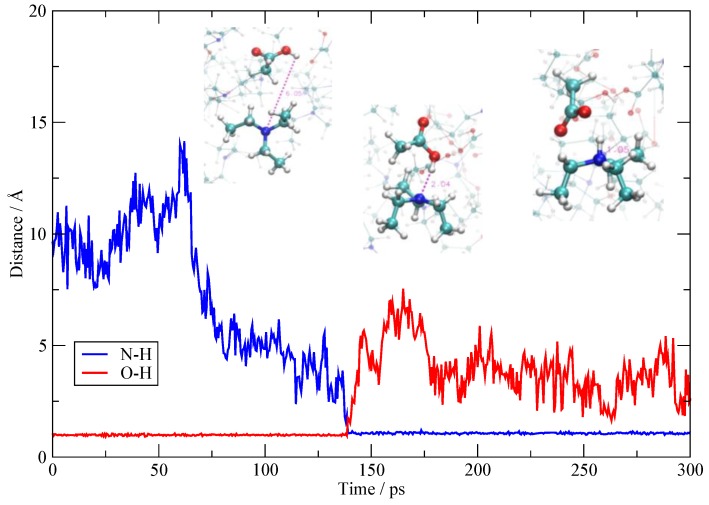
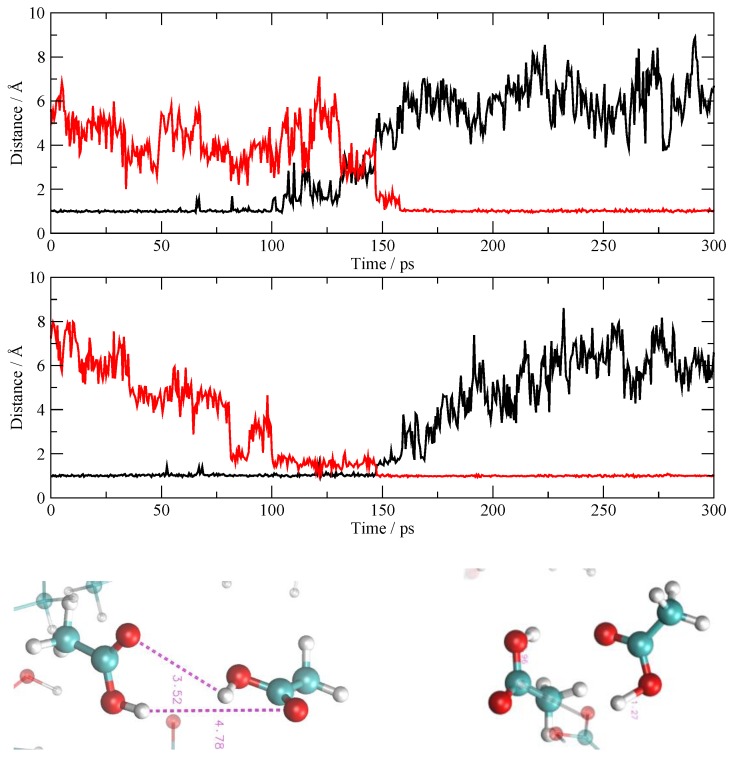
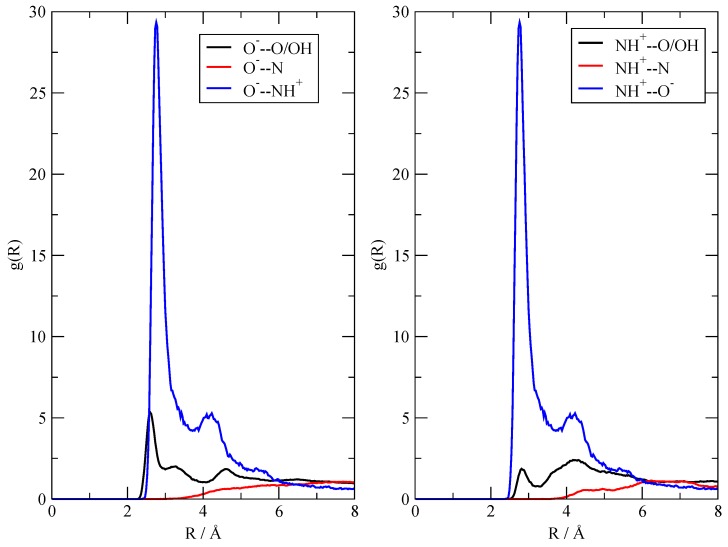
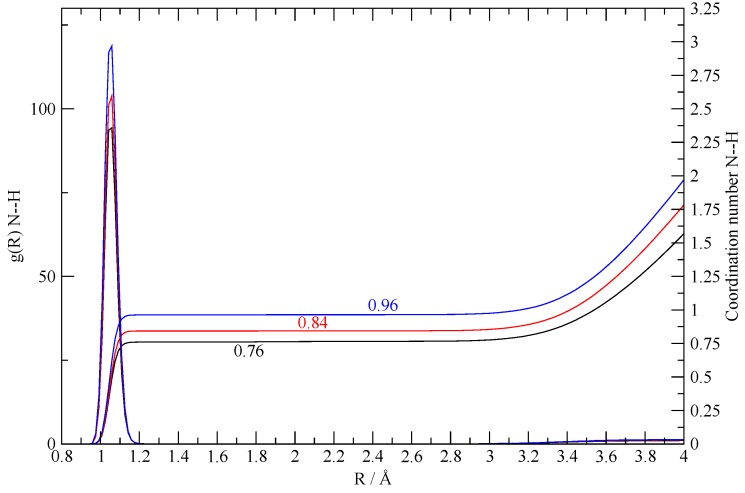
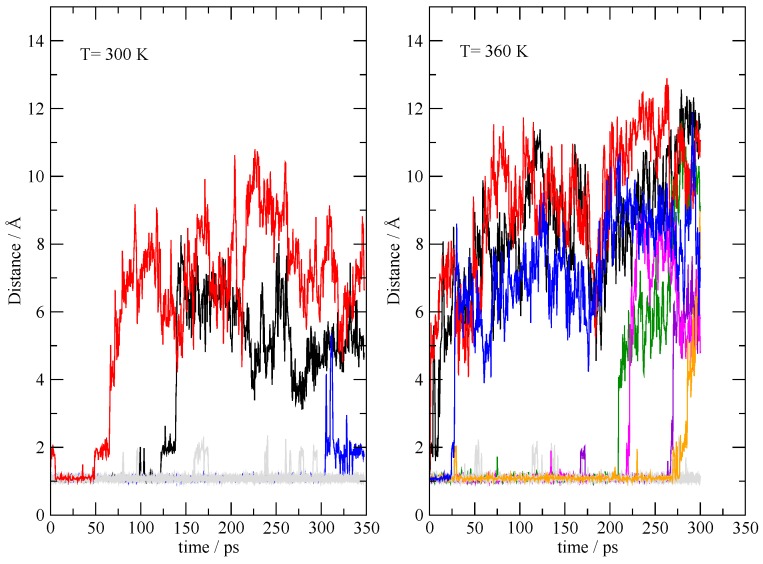
I have explored the structural features and the dynamics of triethylammonium acetate by means of semi-empirical (density functional tight binding, DFTB) molecular dynamics. I find that the results from the present simulations agree with recent experimental determinations with only few minor differences in the structural interpretation. A mixture of triethylamine and acetic acid does not form an ionic liquid, but gives rise to a very complex system where ionization is only a partial process affecting only few molecules (1 over 4 experimentally). I have also found that the few ionic couples are stable and remain mainly embedded inside the AcOH neutral moiety.
Keywords: ionic liquids; molecular dynamics; semi-empirical methods.
Conflict of interest statement
The authors declare no conflict of interest.
Figures
Similar articles
-
A recyclable catalyst for asymmetric transfer hydrogenation with a formic acid-triethylamine mixture in ionic liquid.Chem Commun (Camb). 2005 Apr 28;(16):2134-6. doi: 10.1039/b500320b. Epub 2005 Mar 2. Chem Commun (Camb). 2005. PMID: 15846424
-
Performance of quantum chemically derived charges and persistence of ion cages in ionic liquids. A molecular dynamics simulations study of 1-n-butyl-3-methylimidazolium bromide.J Phys Chem B. 2011 Feb 3;115(4):693-702. doi: 10.1021/jp109612k. Epub 2010 Dec 20. J Phys Chem B. 2011. PMID: 21171617
-
Structural studies on choline-carboxylate bio-ionic liquids by x-ray scattering and molecular dynamics.J Chem Phys. 2015 Sep 21;143(11):114506. doi: 10.1063/1.4931031. J Chem Phys. 2015. PMID: 26395718
-
Atomistic simulation of the thermodynamic and transport properties of ionic liquids.Acc Chem Res. 2007 Nov;40(11):1200-7. doi: 10.1021/ar700163c. Epub 2007 Oct 23. Acc Chem Res. 2007. PMID: 17953449 Review.
-
Mesoscopic organization in ionic liquids.Top Curr Chem (Cham). 2017 Jun;375(3):58. doi: 10.1007/s41061-017-0147-2. Epub 2017 May 17. Top Curr Chem (Cham). 2017. PMID: 28516337 Review.
Cited by
-
Influence of Tethered Ions on Electric Polarization and Electrorheological Property of Polymerized Ionic Liquids.Molecules. 2020 Jun 23;25(12):2896. doi: 10.3390/molecules25122896. Molecules. 2020. PMID: 32586055 Free PMC article.
-
Assessing the Structure of Protic Ionic Liquids Based on Triethylammonium and Organic Acid Anions.J Phys Chem B. 2021 Mar 18;125(10):2781-2792. doi: 10.1021/acs.jpcb.1c00249. Epub 2021 Mar 9. J Phys Chem B. 2021. PMID: 33719447 Free PMC article.
-
Chemical and Phase Equilibrium of Formic Acid-Trialkylamine Complexes.ACS Omega. 2025 Jun 25;10(26):27735-27744. doi: 10.1021/acsomega.4c10897. eCollection 2025 Jul 8. ACS Omega. 2025. PMID: 40657131 Free PMC article.
-
Perspectives in the Computational Modeling of New Generation, Biocompatible Ionic Liquids.J Phys Chem B. 2022 Jan 13;126(1):3-13. doi: 10.1021/acs.jpcb.1c09476. Epub 2022 Jan 3. J Phys Chem B. 2022. PMID: 34978449 Free PMC article. Review.
References
-
- Greaves T.L., Ha K., Howard S., Weerawardena A., Kirby N., Drummond C.J., Muir B. Protic ionic liquids (PILs) nanostructure and physicochemical properties: Development of high-throughput methodology for PIL creation and property screens. Phys. Chem. Chem. Phys. 2015;17:2357–2365. doi: 10.1039/C4CP04241G. - DOI - PubMed
MeSH terms
Substances
Grants and funding
LinkOut - more resources
Full Text Sources
