. 2020 Apr 3;11(1):1680.
doi: 10.1038/s41467-020-15332-7.

β-Catenin and FGFR2 regulate postnatal rosette-based adrenocortical morphogenesis

Affiliations

β-Catenin and FGFR2 regulate postnatal rosette-based adrenocortical morphogenesis

Sining Leng et al. Nat Commun. .

Abstract

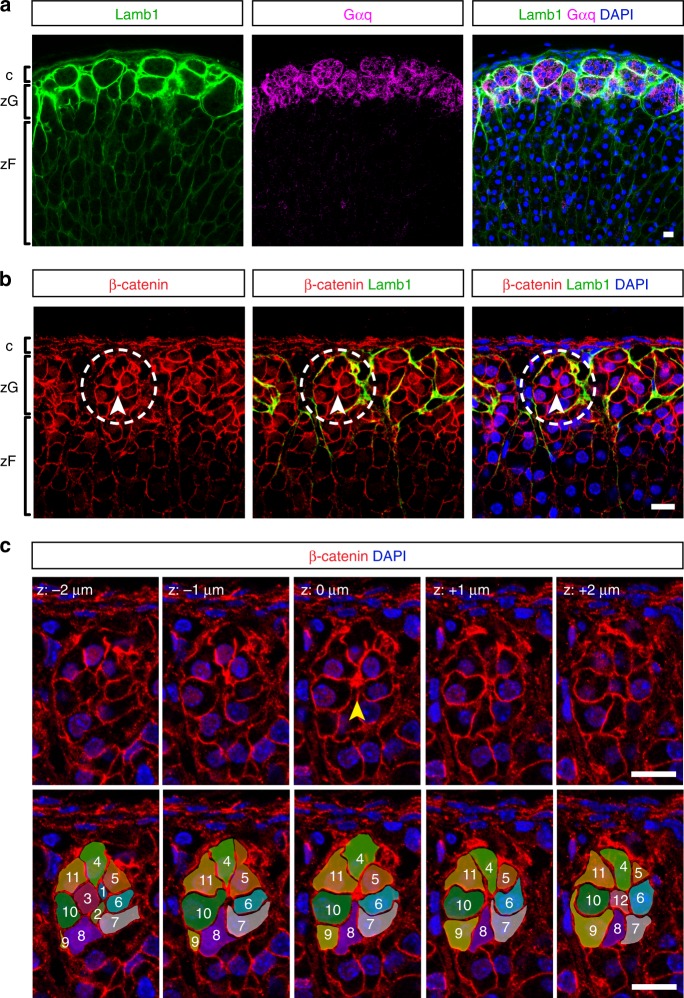
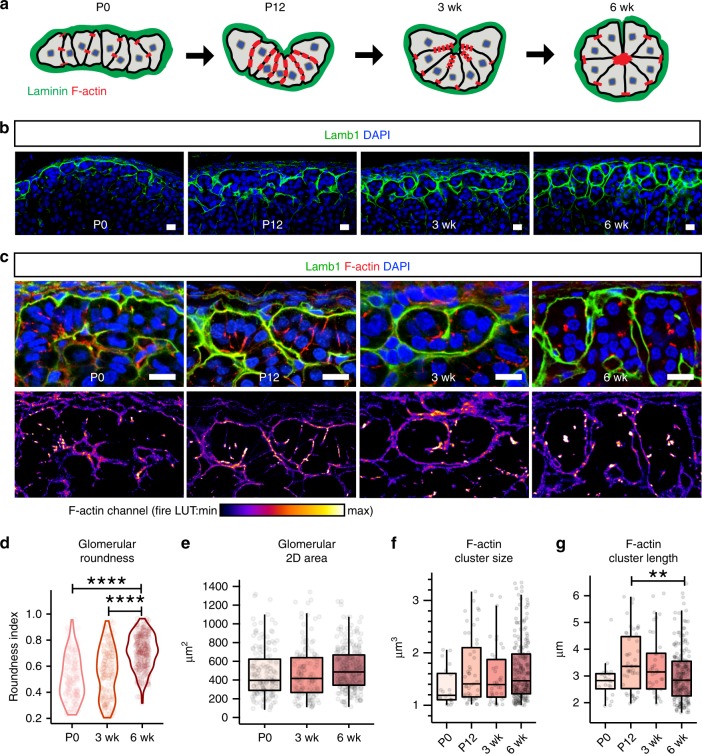
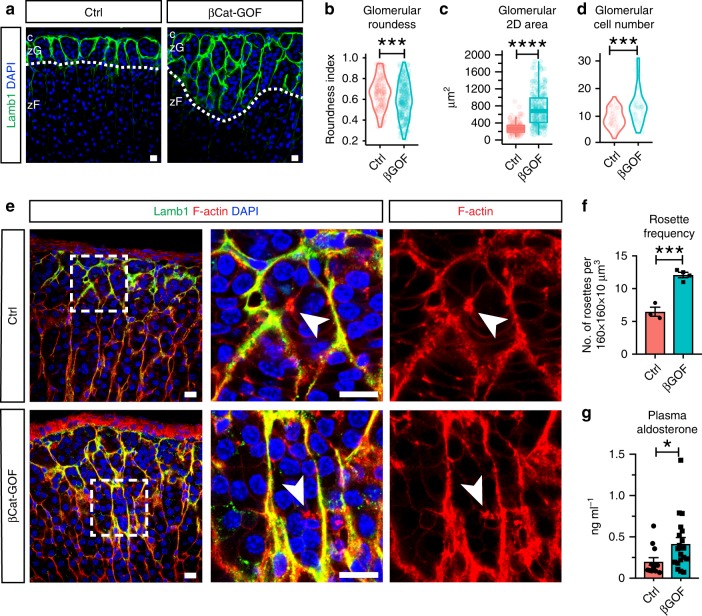
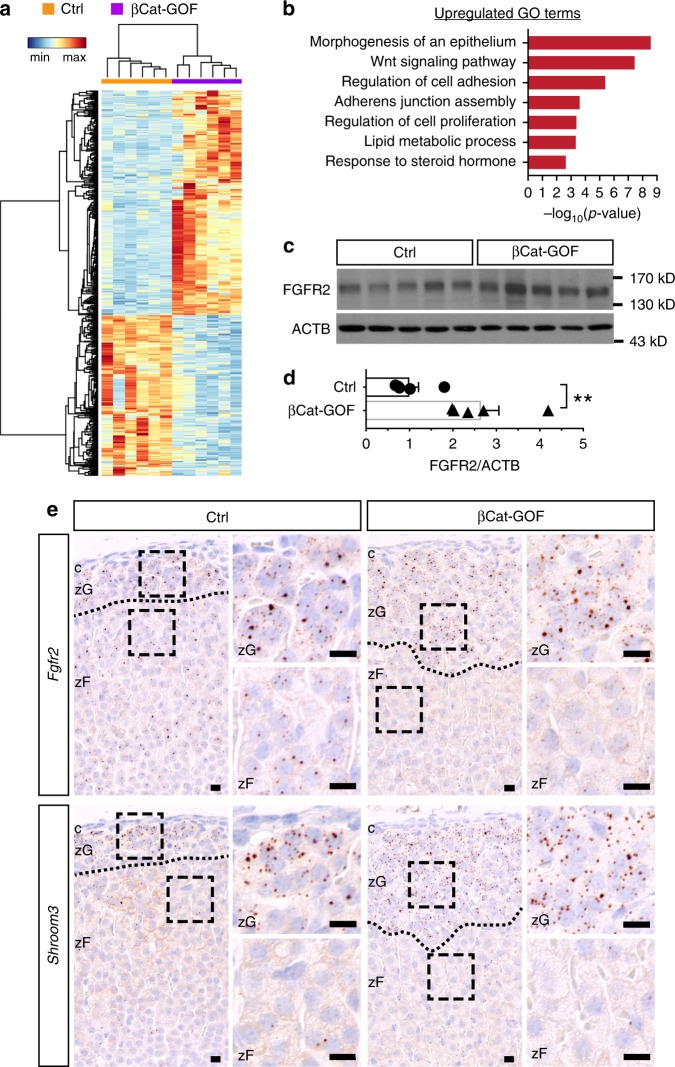
Rosettes are widely used in epithelial morphogenesis during embryonic development and organogenesis. However, their role in postnatal development and adult tissue maintenance remains largely unknown. Here, we show zona glomerulosa cells in the adult adrenal cortex organize into rosettes through adherens junction-mediated constriction, and that rosette formation underlies the maturation of adrenal glomerular structure postnatally. Using genetic mouse models, we show loss of β-catenin results in disrupted adherens junctions, reduced rosette number, and dysmorphic glomeruli, whereas β-catenin stabilization leads to increased adherens junction abundance, more rosettes, and glomerular expansion. Furthermore, we uncover numerous known regulators of epithelial morphogenesis enriched in β-catenin-stabilized adrenals. Among these genes, we show Fgfr2 is required for adrenal rosette formation by regulating adherens junction abundance and aggregation. Together, our data provide an example of rosette-mediated postnatal tissue morphogenesis and a framework for studying the role of rosettes in adult zona glomerulosa tissue maintenance and function.


Conflict of interest statement

The authors declare no competing interests.

Figures

Fig. 1
Fig. 1. Adult adrenal glomeruli consist of multicellular rosettes.
a Laminin β1 (Lamb1, green) marks the basement membrane surrounding distinct clusters of zG cells (Gαq+, magenta), defining the outline of individual glomerulus. b Cells within each glomerulus organize into rosettes. Representative image of an adult adrenal slice stained for Laminin β1 (Lamb1, green) and β-catenin (red). Dashed circles highlight a rosette example. Arrowheads point to rosette center. c Top, confocal z-stack images of the rosette encircled in (b), showing β-catenin (red) and nuclei (DAPI, blue). Z step size is 1 μm. Arrowhead points to the rosette center. Bottom, tracing of cells (pseudo-colored and numbered 1–12) participating in the rosette shown in top panel. c capsule, zG zona glomerulosa, zF zona fasciculata. DAPI (blue) marks nuclei. All bars, 10 μm.
Fig. 2
Fig. 2. Adherens junction components are enriched at rosette centers.
ac Colocalization of F-actin (green) and β-catenin (β-cat, magenta), N-cadherin (N-cad, magenta), and K-cadherin (K-cad, magenta) at rosette centers (white arrowheads) and smaller F-actin punctae (yellow arrowheads). DAPI (blue) marks nuclei. All bars, 10 μm. d Transmission electron micrographs showing adherens junctions in the zG. Left, red dashed line marks the boundary of a glomerulus. Red dots denote nuclei of zG cells. Red triangles denote nuclei of zF cells. Boxed area is shown at a higher magnification in the middle panel where individual cells are pseudo-colored. Red arrows point to adherens junctions. Right, an example of aggregating adherens junctions (red arrowheads). Bar sizes are indicated in each image.
Fig. 3
Fig. 3. Rosette formation underlies postnatal glomerular morphogenesis.
a Schematic of glomerular morphogenesis. b, c Time course of postnatal glomeruli morphogenesis. b Lamb1 (green) marks the basement membrane surrounding the developing glomeruli. c F-actin (red) distribution within the developing glomeruli (outlined by Lamb1 in green) at indicated postnatal stages. DAPI (blue) marks nuclei. Bars, 10 μm. Lower panels show F-actin channel alone in fire LUT. d Measurement of glomerular roundness at indicated stages. Kruskal–Wallis test, P < 0.0001; P0 versus 6 week, Dunn’s test, ****P < 0.0001; 3 week versus 6 week, Dunn’s test, ****P < 0.0001. e Measurement of glomerular cross-sectional area at indicated stages. For d and e, at least three animals from each time point and at least fifty glomeruli per animal were examined. f Measurement of F-actin cluster size at indicated stages. g Measurement of F-actin cluster length at indicated stages. Kruskal–Wallis test, P < 0.01; P12 versus 6 week, Dunn’s test, **P < 0.01. For f and g, at least two animals from each time point and at least ten F-actin punctae per animal were examined. For all measurements, first a Kruskal–Wallis rank sum test was performed, and if significant (P < 0.05), followed by Dunn’s multiple comparison test for each pair. In all boxplots, box boundaries represent the 25th and 75th percentiles, whiskers represent the 5th and 95th percentiles, center lines represent median. Source data are provided as a Source Data file.
Fig. 4
Fig. 4. β-catenin deletion leads to disrupted rosette and glomerular morphology.
a Lamb1 staining (green) showing glomerular morphology in β-catenin loss-of-function (βLOF) adrenals compared to controls (Ctrl). DAPI (blue) marks nuclei. Dotted line demarcates the zG/zF boundary. c capsule, zG zona glomerulosa, zF zona fasciculata. b Measurement of glomerular roundness. Mann–Whitney’s nonparametric test, **P < 0.01. c Measurement of glomerular cross-sectional area. Mann–Whitney’s nonparametric test, ****P < 0.0001. For b and c, at least four animals (2 females and 2 males) and 30 glomeruli per animal were examined. d Measurement of glomerular cell number. Mann–Whitney’s nonparametric test, ****P < 0.0001. Four mice per group and at least ten glomeruli per mouse were examined. e F-actin staining (red) reveals loss of rosette structures in βCat-LOF adrenals. Glomerular boundary is outlined by Lamb1 (green) staining. DAPI (blue) marks nuclei. Boxed areas in left panels are shown in higher magnification on the right. Arrowhead points to rosette center. f Measurement of zG thickness. g Rosette frequency calculated as rosette number per 160 × 160 × 10 μm3 cortical area. Student’s t test, *P < 0.05. N = 5, 4 mice. For each animal, data from three different cortical areas were averaged. All bars, 10 μm. In all bar plots, error bars represent SEM. In all box plots, box boundaries represent the 25th and 75th percentiles, whiskers represent the 5th and 95th percentiles, center lines represent median. Source data are provided as a Source Data file.
Fig. 5
Fig. 5. β-catenin stabilization results in zG expansion and increased rosette frequency.
a Lamb1 staining (green) in β-catenin gain-of-function (βGOF) adrenals of female mice and controls (Ctrl). DAPI (blue) marks nuclei. Dotted line demarcates the zG/zF boundary. c capsule, zG zona glomerulosa, zF zona fasciculata. b, c Measurement of glomerular roundness and cross-sectional area. Mann–Whitney’s non-parametric test, ***P < 0.001; ****P < 0.0001. Three animals from each group and at least 30 glomeruli per animal were examined. d Measurement of glomerular cell number. Mann–Whitney’s nonparametric test, ***P < 0.001. Three mice per group and at least ten glomeruli per mouse were counted. e F-actin staining (red) shows rosettes in expanded zG of βCat-GOF adrenals in females. Lamb1 (green) outlines glomerular boundary. DAPI (blue) marks nuclei. Boxed areas are shown in higher magnification on the right. Arrowheads point to rosette centers. f Rosette frequency calculated as rosette number per 160 × 160 × 10 μm3 z-stack cortical area. Student’s t test, ***P < 0.001, N = 3, 4 mice. For each animal, data from three different cortical areas were averaged. g Plasma aldosterone levels are elevated in female βCat-GOF mice compared to controls. Mann–Whitney’s nonparametric test, *P < 0.05, N = 13, 19 mice. All bars, 10 μm. In all bar plots, error bars represent SEM. In all box plots, box boundaries represent the 25th and 75th percentiles, whiskers represent the 5th and 95th percentiles, center lines represent median. Source data are provided as a Source Data file.
Fig. 6
Fig. 6. Transcripts enriched in βCat-GOF regulate morphogenesis.
a Heatmap of differentially expressed genes between control (Ctrl) and βCat-GOF adrenals based on normalized counts. Fold change > 1.4, adjusted P value < 0.05, base mean expression > 100 were used as cut-off criteria. Dendrograms represent hierarchical clustering of samples (top, Spearman correlation) and genes (left, Pearson correlation) using the average linkage method. N = 6, 6 female mice. b Gene Ontology terms (Biological Processes) enriched in βCat-GOF adrenals. c Western blots showing increased FGFR2 in βCat-GOF adrenals compared to Ctrl. d Normalized luminescence intensity of (c). Student’s t test, **P < 0.01, N = 5, 5 female mice. e Single-molecule in situ hybridization (RNAscope) of Fgfr2 and Shroom3 in Ctrl and βCat-GOF female adrenals. Blue, hematoxylin counterstain. Dotted line demarcates zG/zF boundary; boxed areas are shown at higher magnification on the right. c capsule, zG zona glomerulosa, zF zona fasciculata. Bars, 10 μm. In all bar plots, error bars represent SEM. Source data are provided as a Source Data file.
Fig. 7
Fig. 7. Fgfr2 deletion disrupts rosette morphology and zG physiological function.
a Lamb1 staining (green) shows disrupted glomerular morphology in Fgfr2 loss-of-function (LOF) adrenals compared to controls (Ctrl). DAPI marks nuclei (blue). Dotted line demarcates the zG/zF boundary. c, capsule; zG, zona glomerulosa; zF, zona fasciculata. b Measurement of zG thickness. N = 4, 4 mice. c, d Measurement of glomerular roundness and cross-sectional area. Mann–Whitney’s nonparametric test, ns not significant, ****P < 0.0001. For c and d, four animals from each group (2 males and 2 females) and at least 30 glomeruli per animal were examined. e F-actin staining (red) reveals loss of rosette structures in the glomeruli of Fgfr2-LOF adrenals. Glomerular boundary is outlined by Lamb1 (green). Boxed areas are shown in higher magnification on the right. Arrowheads point to rosette center. DAPI marks nuclei (blue). f Rosette frequency calculated as rosette number per 160 × 160 × 10 μm3 z-stack cortical area. Student’s t test, **P < 0.01, N = 4, 4 mice. For each animal, data from three different cortical areas were averaged. g Plasma aldosterone level (N = 18, 21 mice) and plasma renin activity (N = 6, 9 mice) in Ctrl and LOF mice. Mann–Whitney’s nonparametric test, ns not significant; *P < 0.05. All bars, 10 μm. In all bar plots, error bars represent SEM. In all box plots, box boundaries represent the 25th and 75th percentiles, whiskers represent the 5th and 95th percentiles, center lines represent median. Source data are provided as a Source Data file.

References

    1. Walck-Shannon E, Hardin J. Cell intercalation from top to bottom. Nat. Rev. Mol. Cell Biol. 2014;15:34–48. doi: 10.1038/nrm3723. - DOI - PMC - PubMed
    1. Harding MJ, McGraw HF, Nechiporuk A. The roles and regulation of multicellular rosette structures during morphogenesis. Development. 2014;141:2549–2558. doi: 10.1242/dev.101444. - DOI - PMC - PubMed
    1. Blankenship JT, Backovic ST, Sanny JSP, Weitz O, Zallen JA. Multicellular Rosette formation links planar cell polarity to tissue morphogenesis. Dev. Cell. 2006;11:459–470. doi: 10.1016/j.devcel.2006.09.007. - DOI - PubMed
    1. Chacon-Heszele MF, Ren D, Reynolds AB, Chi F, Chen P. Regulation of cochlear convergent extension by the vertebrate planar cell polarity pathway is dependent on p120-catenin. Development. 2012;139:968–978. doi: 10.1242/dev.065326. - DOI - PMC - PubMed
    1. Lienkamp SS, et al. Vertebrate kidney tubules elongate using a planar cell polarity–dependent, Rosette-based mechanism of convergent extension. Nat. Genet. 2012;44:1382–1387. doi: 10.1038/ng.2452. - DOI - PMC - PubMed

Publication types

MeSH terms

Supplementary concepts