. 2020 Apr 3;11(1):1693.
doi: 10.1038/s41467-020-15443-1.

Superior colliculus modulates cortical coding of somatosensory information

Affiliations

Superior colliculus modulates cortical coding of somatosensory information

Saba Gharaei et al. Nat Commun. .

Abstract

The cortex modulates activity in superior colliculus via a direct projection. What is largely unknown is whether (and if so how) the superior colliculus modulates activity in the cortex. Here, we investigate this issue and show that optogenetic activation of superior colliculus changes the input-output relationship of neurons in somatosensory cortex, enhancing responses to low amplitude whisker deflections. While there is no direct pathway from superior colliculus to somatosensory cortex, we found that activation of superior colliculus drives spiking in the posterior medial (POm) nucleus of the thalamus via a powerful monosynaptic pathway. Furthermore, POm neurons receiving input from superior colliculus provide monosynaptic excitatory input to somatosensory cortex. Silencing POm abolished the capacity of superior colliculus to modulate cortical whisker responses. Our findings indicate that the superior colliculus, which plays a key role in attention, modulates sensory processing in somatosensory cortex via a powerful di-synaptic pathway through the thalamus.


Conflict of interest statement

The authors declare no competing interests.

Figures
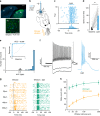
Fig. 1
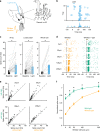
Fig. 1. Neurons in SC are reliably activated by light and whisker stimulation.
a Coronal section showing injection site of ChR2-eYFP in SC (green). DAPI in blue. Scale bar 500 µm. SC, superior colliculus; V1, primary visual cortex; V2, secondary visual cortex. Bottom: higher magnification of the region delineated by the white square in the top image. Scale bar 25 µm. b Schematic of the experimental arrangement. Extracellular recording and optogenetic activation in SC with or without whisker vibration. c Raster plot (top) and peri-stimulus time histogram (bottom) during extracellular recording from a neuron in the intermediate layer of SC using an optrode (2289 µm from the surface of the brain) showing increased spiking in response to light activation (15 ms; blue bar). d Spiking activity of SC neurons (n = 55) increases significantly during light activation. Asterisk represents p < 0.001 (Two-sided paired t-test). e Inset shows the ROC curve for a representative SC neuron during light stimulation (same neuron as in c). The dashed line shows what is expected by chance. For this neuron, the area under the ROC curve (AUC) is 0.996. The main panel shows the distribution of AUC values for all neurons (n = 55). Blue bars depict SC neurons with a significant increase in spiking in response to optogenetic stimulation (n = 50). Gray bars depict SC neurons where there was no significant change in spiking (n = 5). f Left: voltage responses of a ChR2 expressing neuron in SC to somatic current injection (−150, −100, and 150 pA). Right: action potentials evoked in the same neuron in response to light (15 ms; LED power 0.3 mW). g Raster plot of action potential firing during extracellular recording from a SC neuron (2130 µm from the surface of the brain) activated by whisker movement of different amplitude alone (orange dots; left) and with light (green dots; right). h Pooled data showing the impact of light activation (green) on the whisker input–output relationship of whisker responsive SC neurons (orange). Only neurons that were responsive to both whisker and SC stimulation were included in this analysis (n = 40). Error bars represent SEM. Source data are provided as a Source Data file.
Fig. 2
Fig. 2. Optogenetic activation of SC modulates vS1.
a Schematic of the experimental arrangement. Recordings were made from the vS1 while activating SC optogenetically via an optic fiber in the presence or absence of whisker vibration. b Raster plot (top) and peri-stimulus time histogram (bottom) during loose-patch recording from a neuron in vS1 (513 µm from the surface of the brain) showing increased spiking during SC stimulation. c Spiking of vS1 neurons increase significantly during light activation of SC (extracellular array recordings: n = 41; loose-patch recordings: n = 85; whole-cell recordings: n = 23). Asterisks represent p < 0.001 (Two-sided paired t-test). d Raster plot of action potential firing during extracellular recording from a vS1 neuron (589 µm from the surface of the brain) during whisker movement of different amplitude alone (orange dots; left) and with light activation of SC (green dots; right). e Plot of action potential firing in whisker responsive vS1 neurons (n = 127) with and without light activation of SC during whisker stimulation of different amplitude. Black symbols indicate a significant increase in firing during SC activation (n = 101; ROC analysis). f Pooled data showing the impact of SC activation (green) on the whisker input–output relationship (orange). Only neurons that were responsive to both whisker and SC stimulation were included in this analysis (n = 101 neurons). Asterisks represent p < 0.001 (Two-sided paired t-test). The spiking of each neuron was normalized to the maximum response to whisker stimulation alone. Error bars represent SEM. Source data are provided as a Source Data file.
Fig. 3
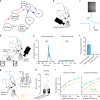
Fig. 3. Modulation of vS1 by SC is not due to whisker movement.
a Circuits of interest showing two possible pathways through which SC could impact on responses in vS1. Modified from Castro-Alamancos and Keller. b Schematic of the experimental arrangement using a high-speed camera to monitor whisker movement while activating SC optogenetically via an optic fiber. c Whisker movement during optogenetic activation of SC. d Schematic of the experimental arrangement. Whiskers were monitored during optogenetic activation of SC before and during facial nerve cooling. e Pixel change in a region of interest around whiskers during optogenetic activation of SC versus time before and after facial nerve cooling. Dark blue shows the mean and light blue the SEM across 50 trials. f Mean whisker pixel change (n = 3 animals) in response to optogenetic activation of SC before and after cutting or cooling the facial nerve. Error bars represent SEM. g Schematic of the experimental arrangement. The impact of optogenetic activation of SC on vS1 responses was measured before and after facial nerve block. h Baseline spiking of vS1 neurons does not significantly change after facial nerve inactivation (p > 0.05 Two-sided paired t-test; facial nerve cooling: n = 16; facial nerve cut: n = 8). i Pooled data showing the impact of SC activation (green) on the whisker input–output relationship (orange) for whisker responsive vS1 neurons before and after facial nerve inactivation (facial nerve cooling: n = 16 neurons; facial nerve cut: n = 8 neurons). The spiking of each neuron was normalized to the maximum response to whisker stimulation alone. Error bars represent SEM. Source data are provided as a Source Data file.
Fig. 4
Fig. 4. Activation of SC drives activity in POm.
a Left: coronal section of thalamus showing SC axons (in green) in POm. Scale bar 500 µm. DAPI in blue. Middle: somatosensory thalamus showing the region delineated by the white square in the left image. Scale bar 100 µm. Right: higher magnification of the regions delineated by the white squares in the middle image showing SC axons in POm but not VPM. Scale bars 40 µm. b Schematic of the experimental arrangement. After cutting the facial nerves, recordings were made from the POm while activating SC optogenetically through an optic fiber in the presence or absence of whisker vibration. c Raster plot (top) and peri-stimulus time histogram (bottom) of an extracellular array recording from a POm neuron (2407 µm from the surface of the brain) showing increased action potential firing in response to SC activation. d Spiking of POm neurons (n = 38) increases significantly during light activation of SC. Asterisk represents p < 0.001 (Two-sided paired t-test). e Raster plot of action potential firing in a POm neuron (same neuron as c) during whisker movement of different amplitude alone (orange; left) and with light activation of SC (green; right). f Pooled data showing the impact of SC activation (green) on the whisker input–output relationship of whisker responsive POm neurons (orange). Only neurons that were responsive to both whisker and SC stimulation were included in this analysis (n = 15). Spiking of each neuron was normalized to the maximum response to whisker stimulation alone. Error bars represent SEM. Source data are provided as a Source Data file.
Fig. 5
Fig. 5. POm, but not VPM, receives direct, monosynaptic input from SC.
a Response of a POm neuron to somatic depolarizing (+300 pA) and hyperpolarizing (−400 pA) current injection. b Synaptic responses from POm neurons receiving “strong” (dark blue) and “weak” (light blue) SC input (LED power 0.8 mW). Arrows depict time of photo-activation of SC axons (2 ms). c Histogram of EPSP amplitude or presence of spiking in POm neurons during optogenetic activation of SC axons (n = 16; LED power 0.8 mW). d Graded synaptic responses in POm neurons receiving “strong” (left; LED power 0.1–0.45 mW) and “weak” (right; LED power 0.45 to 2.72 mW) input from SC. e EPSP amplitude in different POm neurons plotted as a function of LED power in POm neurons receiving “strong” and “weak” SC input (n = 3 and n = 5, respectively). f Synaptic responses in a POm neuron receiving “strong” SC input in control (left) and in the presence of TTX and 4-AP (right). g Summary of EPSP amplitudes or spiking in neurons that received “strong” (left; n = 9) and “weak” (right; n = 5) SC inputs in control and in the presence of TTX and 4-AP (LED power 2.72 mW). h Response of a VPM neuron to somatic depolarizing (+300 pA) and hyperpolarizing (−400 pA) current injection. i Voltage response of the same VPM neuron to photo-activation of SC axons at maximum LED power (2 ms; 5 mW). j Summary of EPSP amplitude in VPM neurons (n = 5) during optogenetic activation of SC axons at the highest LED power tested (5 mW). Error bars represent SEM. Source data are provided as a Source Data file.
Fig. 6
Fig. 6. SC is di-synaptically connected to vS1 through POm.
a Schematic of the experimental paradigm for double viral injections. Expression of trans-synaptic Cre recombinase (AAV1.hSyn.Cre.WPRE.hGH) in SC was coupled with expression of Cre-dependent ChR2 (AAV1-Ef1a-DIO-hChR2(E123A)-eYFP) in POm. b eYFP expressing POm neurons (left: scale bar 50 µm) send axons to vS1 (right; scale bar 250 µm). c Response of a layer 2/3 vS1 neuron to somatic depolarizing and hyperpolarizing current injection (−400 pA to 250 pA). d Synaptic responses in the same neuron to optogenetic activation of POm axons (2 ms; 5 mW) in control (left) and in the presence of TTX and 4-AP (right). e EPSP amplitude in layer 2/3 vS1 neurons in control (n = 10) and in the presence of TTX and 4-AP (n = 5) during optogenetic activation of the axons of POm neurons receiving direct input from SC (2 ms; 5 mW). f Response of a layer 5 vS1 neuron to somatic depolarizing and hyperpolarizing current injection (−400 pA to 250 pA). g Synaptic responses in the same neuron to optogenetic activation of POm axons (2 ms; 5 mW) in control (left) and in the presence of TTX and 4-AP (right). h EPSP amplitude or spiking in layer 5 vS1 neurons in control (n = 6) and in the presence of TTX and 4-AP (n = 4) during optogenetic activation of the axons of POm neurons receiving direct input from SC (2 ms; 5 mW). Error bars represent SEM. Source data are provided as a Source Data file.
Fig. 7
Fig. 7. Inactivation of POm abolishes the impact of SC on vS1 neurons.
a Schematic of the experimental arrangement. After cutting the facial nerve, recordings were made from vS1 while activating SC optogenetically through an optic fiber in the presence or absence of whisker vibration. POm was silenced by local application of lidocaine. b Raster plot during extracellular array recording of spiking in a vS1 neuron (787 µm from the surface of the brain) in response to optogenetic activation of SC in control (left) and following inactivation of POm via lidocaine injection (right). c Plot of baseline-subtracted responses in a vS1 neurons to SC activation before and after lidocaine injection in POm (n = 36). Asterisk represents p < 0.001 (Two-sided paired t-test). d Pooled data showing the impact of SC activation (green) on spiking in whisker responsive vS1 neurons during small amplitude whisker movement (orange) in control (left) and following inactivation of POm following lidocaine injection (right). Only neurons that were responsive to both whisker and SC stimulation were included in this analysis (n = 23). The spiking activity of each neuron was normalized to the maximum response to whisker stimulation alone in control. Error bars represent SEM. Source data are provided as a Source Data file.

Similar articles

Cited by

References

    1. Rowland BA, Quessy S, Stanford TR, Stein BE. Multisensory integration shortens physiological response latencies. J. Neurosci. 2007;27:5879–5884. doi: 10.1523/JNEUROSCI.4986-06.2007. - DOI - PMC - PubMed
    1. McHaffie JG, Stein BE. Eye movements evoked by electrical stimulation in the superior colliculus of rats and hamsters. Brain Res. 1982;247:243–253. doi: 10.1016/0006-8993(82)91249-5. - DOI - PubMed
    1. Gharaei S, Arabzadeh E, Solomon SG. Integration of visual and whisker signals in rat superior colliculus. Sci. Rep. 2018;8:16445. doi: 10.1038/s41598-018-34661-8. - DOI - PMC - PubMed
    1. May PJ. The mammalian superior colliculus: laminar structure and connections. Prog. Brain Res. 2006;151:321–378. doi: 10.1016/S0079-6123(05)51011-2. - DOI - PubMed
    1. Zingg B, et al. AAV-mediated anterograde transsynaptic tagging: mapping corticocollicular input-defined neural pathways for defense behaviors. Neuron. 2017;93:33–47. doi: 10.1016/j.neuron.2016.11.045. - DOI - PMC - PubMed

Publication types