. 2020 Apr 3;11(1):1654.
doi: 10.1038/s41467-020-15487-3.

Diagnosis and prognosis of myocardial infarction on a plasmonic chip

Affiliations

Diagnosis and prognosis of myocardial infarction on a plasmonic chip

Wei Xu et al. Nat Commun. .

Abstract

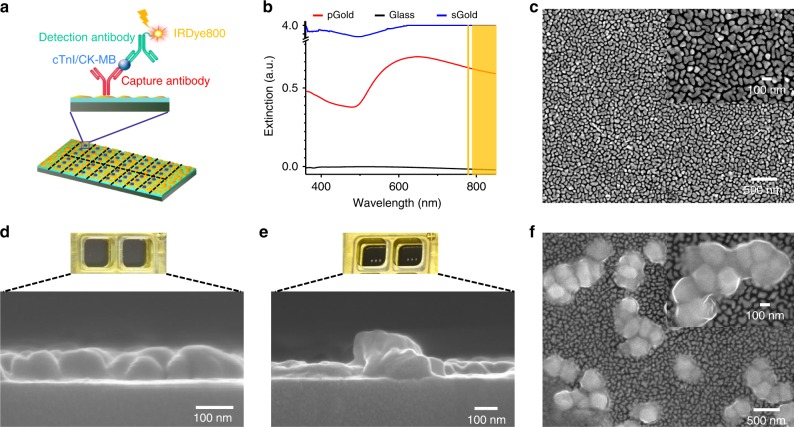
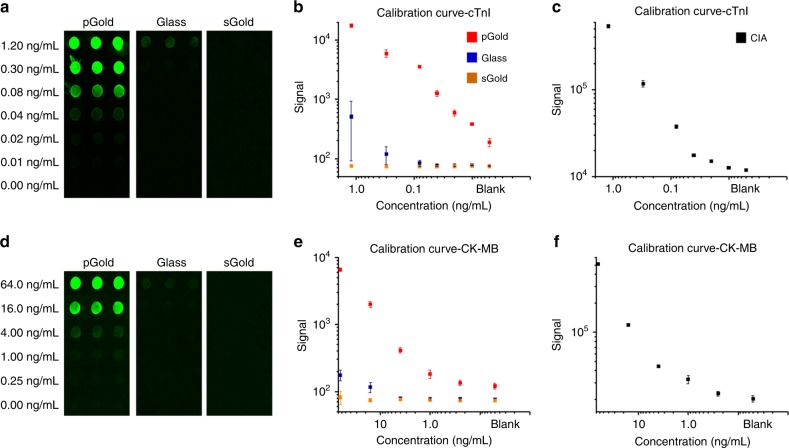
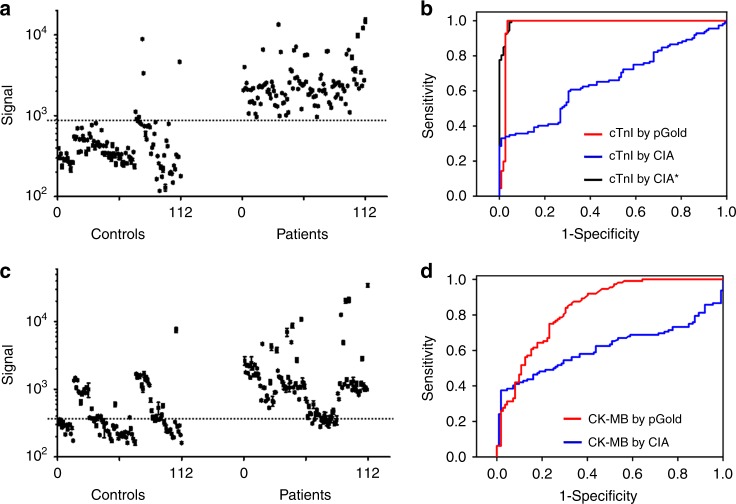
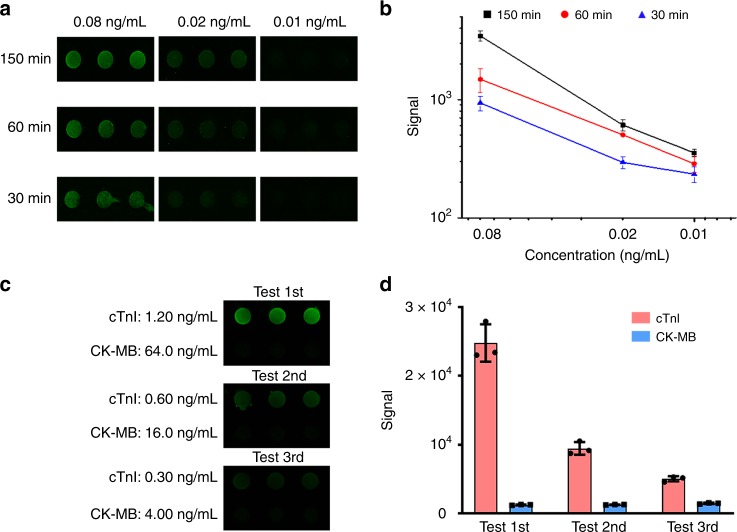
Cardiovascular diseases lead to 31.5% of deaths globally, and particularly myocardial infarction (MI) results in 7.4 million deaths per year. Diagnosis of MI and monitoring for prognostic use are critical for clinical management and biomedical research, which require advanced tools with accuracy and speed. Herein, we developed a plasmonic gold nano-island (pGold) chip assay for diagnosis and monitoring of MI. On-chip microarray analysis of serum biomarkers (e.g., cardiac troponin I) afforded up to 130-fold enhancement of near-infrared fluorescence for ultra-sensitive and quantitative detection within controlled periods, using 10 μL of serum only. The pGold chip assay achieved MI diagnostic sensitivity of 100% and specificity of 95.54%, superior to the standard chemiluminescence immunoassay in cardiovascular clinics. Further, we monitored biomarker concentrations regarding percutaneous coronary intervention for prognostic purpose. Our work demonstrated a designed approach using plasmonic materials for enhanced diagnosis and monitoring for prognostic use towards point-of-care testing.


Conflict of interest statement

The authors declare the following competing interests. H.D. is a scientific adviser for Nirmidas Biotech Inc. and contributed to this work in that capacity. The authors declare no other competing interests.

Figures

Fig. 1
Fig. 1. Construction and characterization of antibody-printed pGold chips.
a Schematic illustration of antigen (cTnI/CK-MB) detection on pGold chip using a sandwich assay. b Extinction spectra of pGold chip (red line), glass (black line), and sGold chip (blue line) overlaid with the excitation and emission (yellow shaded area) regions of IR800 dye. c Top-view SEM of pGold chip (n ≥ 3 randomly selected). d Digital image of two bulk reaction wells and side-view SEM of gold islands on pGold chip. e Digital image of two antibody-printed reaction wells and side-view SEM of capture antibodies on pGold chip. f Top-view SEM of capture antibodies on pGold chip (n ≥ 3 randomly selected). Insets of (c) and (f) were the zoomed SEM images. Source data are provided as a Source Data file.
Fig. 2
Fig. 2. Near-infrared fluorescence enhanced microarray detection of biomarkers.
a Fluorescence mapping results by IRDye800 labeled detection of cTnI (0–1.2 ng mL−1) on pGold (left), glass (middle), and sGold (right) chips. b Calibration curves comparing detection limits and dynamic ranges for cTnI on pGold (red), glass (blue), and sGold (yellow) chips. We performed three independent experiments on pGold, glass, and sGold chips to calculate the standard deviation (s.d.) as error bars and data are shown as the mean ± s.d. (n = 3). c Calibration curve of cTnI quantification by CIA. We performed three independent CIA experiments and data are shown as the mean ± s.d. (n = 3). Similarly, d fluorescence mapping results, e calibration curves comparing detection limits and dynamic ranges by different chips, and f calibration curve by CIA were obtained for CK-MB. We performed three independent experiments and data are shown as the mean ± s.d. (n = 3). All samples used for the calibration curves were standards containing known concentrations of biomarkers provided by the vendor (Tellgen). Source data are provided as a Source Data file.
Fig. 3
Fig. 3. Serum tests for diagnosis of MI using cTnI and CK-MB.
a Signal quantification on pGold chips for the detection of 112 MI patients and 112 controls using cTnI. All experiments were conducted with n = 3; mean ± s.d. b ROC curves for diagnosis by cTnI. The red and blue lines represented pGold chips and CIA, respectively. The black line (CIA*) represented the CIA based on the Abbott Architect assay. c Signal quantification on pGold chips for the detection of MI patients and controls using CK-MB. All experiments were conducted with n = 3; mean ± s.d. d ROC curves for diagnosis by CK-MB. The red and blue lines represented pGold chips and CIA, respectively. The dashed lines were the intensity cutoffs corresponding to serum concentrations of 0.03 ng mL−1 for cTnI and 3.13 ng mL−1 for CK-MB. Source data are provided as a Source Data file.
Fig. 4
Fig. 4. Control of reaction time and cross reactivity tests.
a Fluorescence mapping results and b corresponding calibration curves with the reaction time of 150, 60, and 30 min for cTnI (0.01–0.08 ng mL−1). All experiments were conducted with n = 3; mean ± s.d. c Fluorescence images showing only one row of spots (cTnI) emitting bright fluorescence signals when a multiplexed antibody chip (two rows, two different antibodies against biomarkers labeled at the left of the image with different concentrations) were incubated in a solution containing a mixture of the two antigens, followed by incubation in a solution containing only one of the corresponding detection antibodies without the other one. d Averaged fluorescence intensity of each row in (c). All experiments were conducted with n = 3; mean ± s.d. Source data are provided as a Source Data file.
Fig. 5
Fig. 5. Serum tests for monitoring after PCI using cTnI.
Tri-tests of cTnI for all 25 patients in a period of 10 days, concluding 1st test results before PCI in red, 2nd test results on day 5 after PCI in black and 3rd test results on day 10 after PCI in blue. All experiments were conducted with n = 3; mean ± s.d. * referred to the MI patient (#24, in the yellow box) that needed observation for a longer time after PCI. Source data are provided as a Source Data file.

References

    1. Mendis, S., Puska, P. & Norrving, B. Global Atlas on Cardiovascular Disease Prevention and Control (WHO, 2011).
    1. Reiner Z. Hypertriglyceridaemia and risk of coronary artery disease. Nat. Rev. Cardiol. 2017;14:401–411. doi: 10.1038/nrcardio.2017.31. - DOI - PubMed
    1. Benjamin EJ, et al. Heart disease and stroke statistics—2017 update: a report from the American Heart Association. Circulation. 2017;135:e146–e603. doi: 10.1161/CIR.0000000000000485. - DOI - PMC - PubMed
    1. Prabhakaran D, et al. Cardiovascular, respiratory, and related disorders: key messages from disease control priorities, 3rd edition. Lancet. 2018;391:1224–1236. doi: 10.1016/S0140-6736(17)32471-6. - DOI - PMC - PubMed
    1. Roth GA, et al. Global, regional, and national burden of cardiovascular diseases for 10 causes, 1990 to 2015. J. Am. Coll. Cardiol. 2017;70:1–25. doi: 10.1016/j.jacc.2017.04.052. - DOI - PMC - PubMed

Publication types