. 2020 Apr 3;11(1):1673.
doi: 10.1038/s41467-020-15463-x.

Remodeling of active endothelial enhancers is associated with aberrant gene-regulatory networks in pulmonary arterial hypertension

Affiliations

Remodeling of active endothelial enhancers is associated with aberrant gene-regulatory networks in pulmonary arterial hypertension

Armando Reyes-Palomares et al. Nat Commun. .

Abstract

Environmental and epigenetic factors often play an important role in polygenic disorders. However, how such factors affect disease-specific tissues at the molecular level remains to be understood. Here, we address this in pulmonary arterial hypertension (PAH). We obtain pulmonary arterial endothelial cells (PAECs) from lungs of patients and controls (n = 19), and perform chromatin, transcriptomic and interaction profiling. Overall, we observe extensive remodeling at active enhancers in PAH PAECs and identify hundreds of differentially active TFs, yet find very little transcriptomic changes in steady-state. We devise a disease-specific enhancer-gene regulatory network and predict that primed enhancers in PAH PAECs are activated by the differentially active TFs, resulting in an aberrant response to endothelial signals, which could lead to disturbed angiogenesis and endothelial-to-mesenchymal-transition. We validate these predictions for a selection of target genes in PAECs stimulated with TGF-β, VEGF or serotonin. Our study highlights the role of chromatin state and enhancers in disease-relevant cell types of PAH.


Conflict of interest statement

The authors declare no competing interests.

Figures
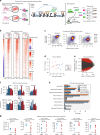
Fig. 1
Fig. 1. Histone modification and gene expression changes in PAH.
a Overview of the experimental and analytical workflow of the study. b ChIP-Seq signal distributions for H3K4me3, H3K27ac, and H3K4me1 around the TSS of expressed genes in PAECs are shown as heatmap. The normalized read counts (mean across all individuals) for each histone are colored according to their specific legend. TSS regions are sorted by the average expression level of the gene. c Pairwise correlations between gene expression and H3K27ac, H3K4me3, H3K4me1 ChIP-Seq signal of peaks within 2.5 kb of genes are shown. The strength of the association was estimated from Pearson’s correlation coefficient (R = 0.51, R = 0.59, R = 0.22, respectively). d Principal component analysis (PCA) of H3K27ac ChIP-Seq signal of the 1000 most variable regions across all individuals is shown. Individuals are colored by disease status: idiopathic PAH (orange), hereditary PAH (red) and control (blue). e Log2-ratio vs mean expression (MA plot) is shown for the differential analysis of H3K27ac signal between patients and controls; red dots represent significantly modified regions (FDR < 5%; n = 10 PAH and seven controls). f RT-qPCR signals for baseline experiments for a selection of genes and individuals are shown (n = 4 controls and 4 PAH). Source data are provided in Source Data File. g H3K27ac signal at enhancers (Enh) of the genes assayed by qPCR in f are shown per individual. h Distribution of chromatin states of H3K27ac regions detected in PAECs (blue bars, representing 263,910 genomic features) and in differentially modified regions (orange bars, representing 31,084 genomic features). Chromatin states were obtained from human umbilical vein endothelial cell (HUVEC; grey bars, representing 515,807 genomic features) from the Roadmap Project (file: E122_18_core_K27ac_dense.bed).
Fig. 2
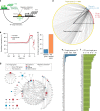
Fig. 2. Chromatin regulatory domains (CRDs) and gene–enhancer interactions.
a Distribution of lengths is shown for CTCF-mediated chromatin loops (ChIA-PET; n = 21,805). b The fraction of differentially H3K27ac modified peaks are shown per CRD. Peaks were classified as higher in PAH (red), healthy (blue), or unchanged (grey) if their log2 fold change value was above 0.5, below −0.5, or between −0.5 and 0.5 respectively. c Schematic of the approach for determining CRDs: H3K27ac peaks at the two boundaries of CTCF-mediated ChIA-PET loops are positively correlated (p-value < 0.05). d P-value distribution of Pearson correlation coefficients (R) between H3K27ac signals located at opposite anchor points within the same CTCF loop; R > 0 (red bars) and R < 0 (blue bars). e P-value distribution of Pearson correlation coefficients (R) of H3K27ac signal and expression of genes that are within the same CTCF loop; R > 0 (red bars), R < 0 (green bars) and randomly located H3K27ac signals (blue bars). f GO terms that are enriched among the genes that are connected to differentially H3K27-acetylated enhancers within CRDs. Some of the GO terms have very similar sets of genes and are thus not completely independent. g For each number of enhancers (x-axis) the fraction of genes within CRDs (orange) and within non-CRD ChIA-PET loops (blue) are shown. h Examples of ChIA-PET data is shown for two genes also shown in Fig. 1f (additional genes shown in Supplementary Fig. 3e). CRD-ChIA PET loops are shown in red, correlation-based enhancer-gene interactions are shown in green and non-CRD ChIA-PET loops are shown in grey. Source data for ab, de, h are provided in Source Data File.
Fig. 3
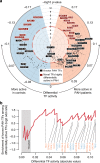
Fig. 3. Differential TF binding activity between PAH and controls.
a Circular vulcano-plot shows the distribution of differential TF activity based on H3K27ac signal differences between PAH and controls. TFs previously associated with PAH are labeled in black. TFs that are more differentially active between patients and controls than the known PAH-TFs are labeled in red. Full list of differentially active TFs are provided in Supplementary Data 3. b Enrichment of known TFs related to PAH among the set of differentially active TFs for increasing thresholds for defining differential TF activity. TF activity is shown on an absolute scale with TFs being more active in patients and controls colored in orange and blue, respectively.
Fig. 4
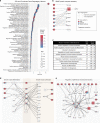
Fig. 4. Gene Regulatory Network for PAH based on TF-enhancer-gene links.
a Schematic representation of the gene regulatory network (GRN) approach. b Fraction of consistent interactions defined as regulatory interactions where the TF activity varies in the same direction as the H3K27ac signal at the putative target peak. The consistency increased considerably around the 20% FDR threshold (see Methods). c Percentage of regulatory interactions mediated by enhancers that are connected to the nearest transcription start site (TSS; blue, n = 1289) vs other TSS (orange, n = 6153). d GRN in PAH. Nodes represent TFs (square) and target genes (circle) that are within chromatin regulatory domains (CRDs). TFs more active in PAH (red), TFs more active in controls (blue), target genes more active in PAH (orange) and target genes more active in control (green). The color of the edges represents a positive (green) and negative (red) correlation for TF expression and H3K27ac signal at the promoter of the target gene. TFs with more than 100 connections were removed to improve clarity of the network visualization. The network is provided in Supplementary Data 5. e Ranked TFs by their number of interactions in the PAH genetic regulatory network. f Ranked target genes by their number of interactions in the PAH genetic regulatory network, to make clear the plot only the top 100 target genes are represented. g Detailed sub-network of the PAH-GRN of known genes associated with PAH (large nodes) and their first interactors (small nodes).
Fig. 5
Fig. 5. Functional analysis of genes targeted by differential PAH-TFs.
a Enrichment of gene ontology (GO) annotations for target genes in PAH-specific GRN (adj. p-val < 0.05). Only GO terms that have between 3 and 80 genes are shown and some highly redundant terms were removed (full list in Supplementary Data 6). All expressed genes were used as background. b Network of target genes associated with the GO term “SMAD complex assembly” (large nodes) and their first interactors (small nodes). c GO terms related to “muscle” and “mesenchyme” that were enriched among the target genes of the PAH-specific GRN. d Network of target genes associated with the GO terms “Smooth muscle differentiation” and/or “Smooth muscle contraction” (large nodes) and their first interactors (small nodes). Color code as in b. e Network of target genes associated with the GO terms “Regulation of epithelial to mesenchymal transition” (large nodes) and their first interactors (small nodes). Color code of the nodes as in b.
Fig. 6
Fig. 6. Experimental growth factor stimulations in PAECs confirms priming.
a Log2 fold-change of the gene expression (as measured by RT-qPCR) and the H3K27ac signal (as measured by ChIP-Seq) of the regulatory element(s) linked to the gene are shown as scatter plot. Each point is a regulatory element-gene pair. The fold-changes are calculated between PAH patients and controls in steady state for H3K27ac and after a stimulation with endothelial-specific growth factors (serotonin—yellow triangles, vascular endothelial growth factor (VEGF)—red crosses, and transforming growth factor β (TGFβ)—blue squares) for the RNA. Pearson correlation coefficients (R) and associated p-values are given in the plots. (qPCR experiments: n = 4 patients, four controls). b Western blot analyses are shown for a selection of genes that showed a differential response to any of the stimulations on the RNA level. GAPDH levels are shown as a reference. Source data are provided in Source Data File. c ChIP-qPCR analysis for enhancers predicted to prime response in PAH patients. H3K27ac signal at selected enhancers (Enh; orange, brown and pink box for NOS3, YAP1, and TGFBR2), was measured after TGFβ stimulation in patient and controls. All of the enhancers showed a trend in the predicted direction and some of them statistically significant (n = 3 patients, three controls). Error bars indicate standard deviation across three replicates.

References

    1. Morrell NW, et al. Genetics and genomics of pulmonary arterial hypertension. Eur. Respir. J. 2019;53:1801899. doi: 10.1183/13993003.01899-2018. - DOI - PMC - PubMed
    1. Lau EMT, Giannoulatou E, Celermajer DS, Humbert M. Epidemiology and treatment of pulmonary arterial hypertension. Nat. Rev. Cardiol. 2017;14:603–614. doi: 10.1038/nrcardio.2017.84. - DOI - PubMed
    1. Benza RL, et al. An evaluation of long-term survival from time of diagnosis in pulmonary arterial hypertension from the REVEAL Registry. Chest. 2012;142:448–456. doi: 10.1378/chest.11-1460. - DOI - PubMed
    1. Rabinovitch M. Molecular pathogenesis of pulmonary arterial hypertension. J. Clin. Invest. 2012;122:4306–4313. doi: 10.1172/JCI60658. - DOI - PMC - PubMed
    1. Simonneau G, et al. Updated clinical classification of pulmonary hypertension. J. Am. Coll. Cardiol. 2013;62:D34–D41. doi: 10.1016/j.jacc.2013.10.029. - DOI - PubMed

Publication types

MeSH terms