. 2020 Apr 3;10(1):5878.
doi: 10.1038/s41598-020-62804-3.

Attractor Concepts to Evaluate the Transcriptome-wide Dynamics Guiding Anaerobic to Aerobic State Transition in Escherichia coli

Affiliations

Attractor Concepts to Evaluate the Transcriptome-wide Dynamics Guiding Anaerobic to Aerobic State Transition in Escherichia coli

Thuy Tien Bui et al. Sci Rep. .

Abstract

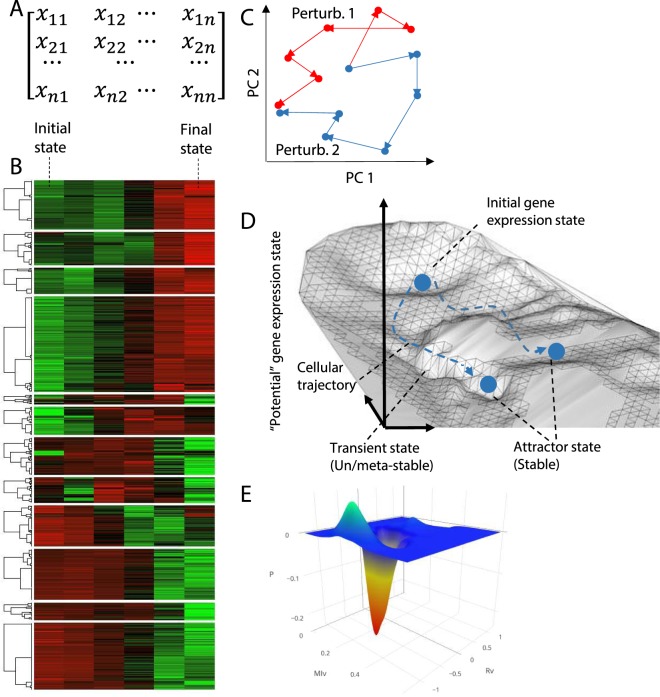
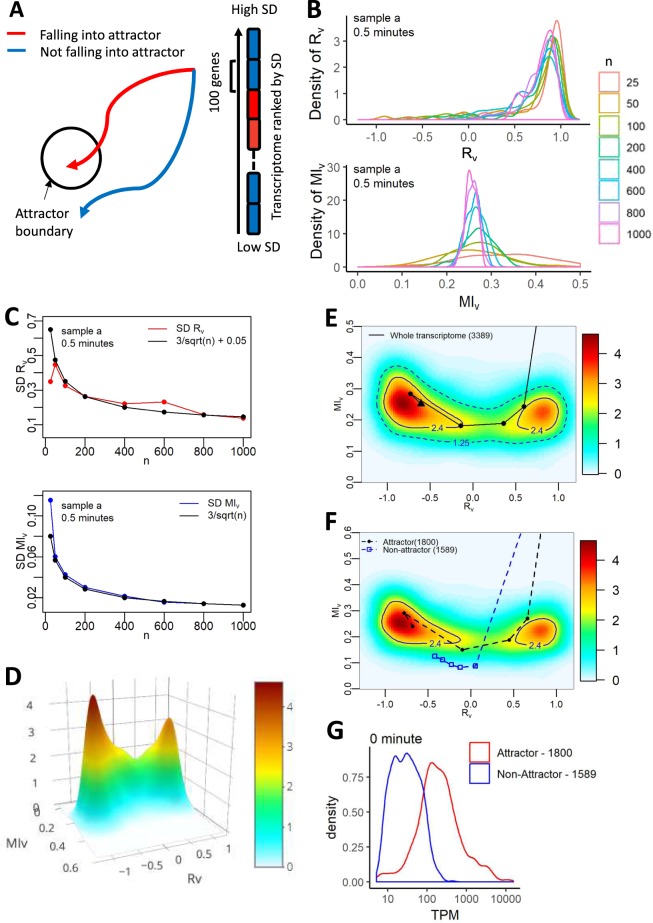
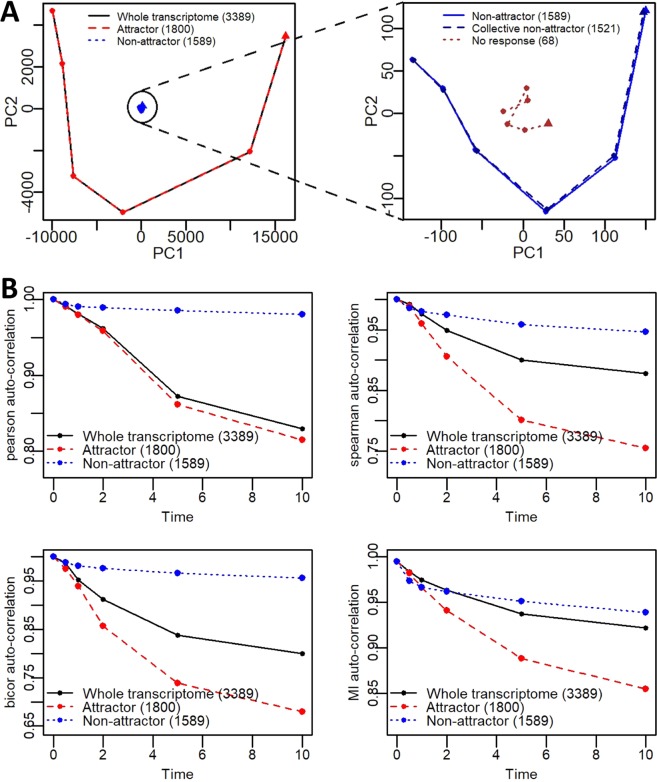
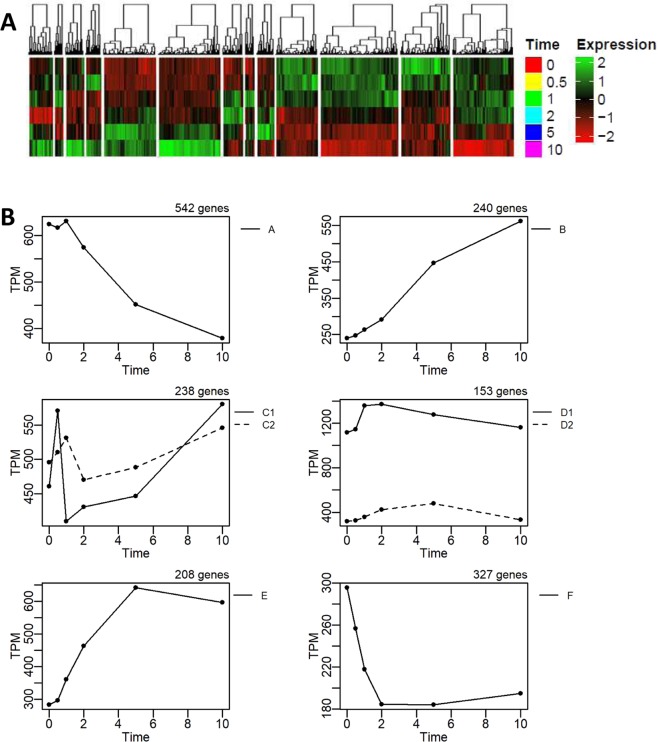
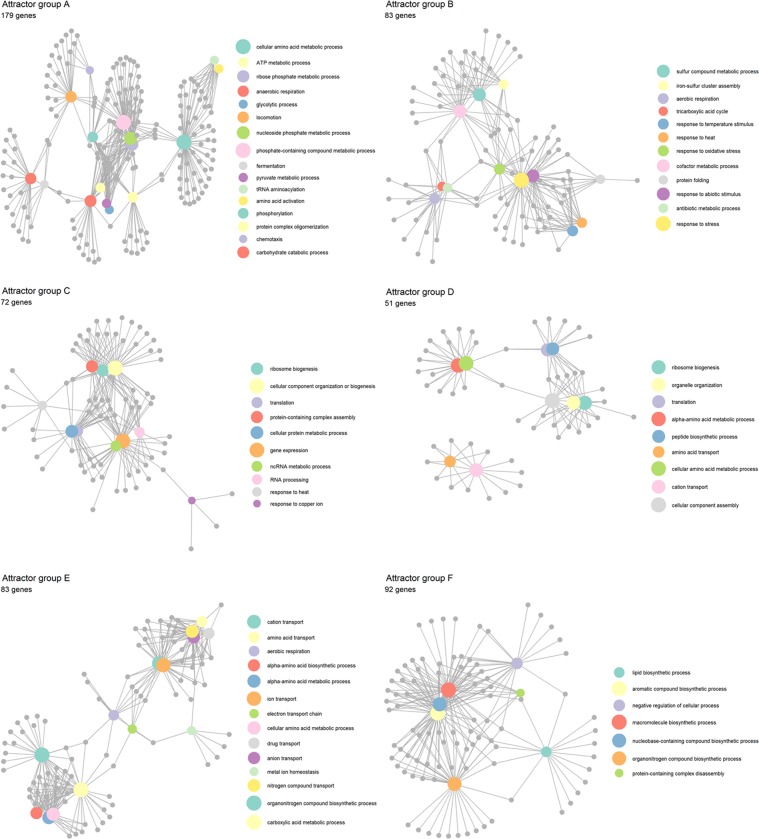
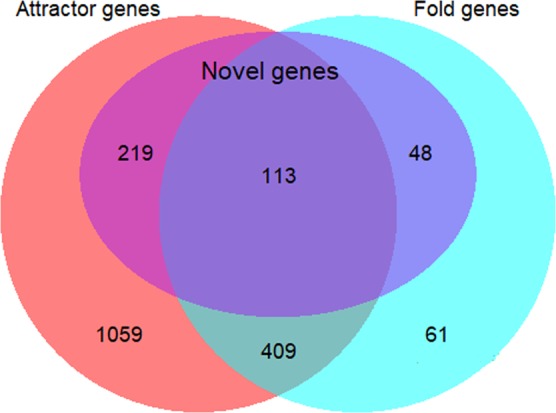
For any dynamical system, like living organisms, an attractor state is a set of variables or mechanisms that converge towards a stable system behavior despite a wide variety of initial conditions. Here, using multi-dimensional statistics, we investigate the global gene expression attractor mechanisms shaping anaerobic to aerobic state transition (AAT) of Escherichia coli in a bioreactor at early times. Out of 3,389 RNA-Seq expression changes over time, we identified 100 sharply changing genes that are key for guiding 1700 genes into the AAT attractor basin. Collectively, these genes were named as attractor genes constituting of 6 dynamic clusters. Apart from the expected anaerobic (glycolysis), aerobic (TCA cycle) and fermentation (succinate pathways) processes, sulphur metabolism, ribosome assembly and amino acid transport mechanisms together with 332 uncharacterised genes are also key for AAT. Overall, our work highlights the importance of multi-dimensional statistical analyses for revealing novel processes shaping AAT.


Conflict of interest statement

The authors declare no competing interests.

Figures

Figure 1
Figure 1
Schematic illustration of attractor landscape and cellular trajectory. (A,B) Cellular gene expression profile represented by (A) matrix and (B) heat map of gene expression level. Each element represents the expression level of a gene (rows) in a cellular state (columns). (C) Schematic representation of cell trajectory convergence on principal components 1 and 2 (denoted as PC1 and PC2) space. Each point represents a sample’s entire gene expression profile within one of the two transitioning processes caused by two distinct perturbations. (D) The landscape is a schematic 3-D projection of N (total number of genes) to a two-dimensional state space. In the attractor landscape, many stationary attractors (represented by the local minima), which correspond to the natural cellular phenotypes such as cell fate, might co-exist. Each attractor associates with a unique cellular signature profile (or gene expression profile in this study). The transitioning processes (dashed blue line) guide the cell from one stable attractor to another. (E) Gene expression attractor landscapes generated by the superimposition of probability distribution of Pearson and mutual information correlation mertics to create a 3-D space. Existence of stable attractor coinciding the convergence of cellular trajectories is indicated by the local minima.
Figure 2
Figure 2
E. coli transcriptome-wide statistical properties. (A,B) Comparison of transcriptome-wide data with statistical distributions: (A) Cumulative distribution functions versus TPM values in logscale, and (B) Quantile-quantile plot between transcriptome data (experimental data – black colour) and lognormal (red), Pareto (yellow), Burr (cyan), loglogistic (blue), Weibull (purple), and gamma (grey) statistical distributions (Methods). Figure is one representative at t = 10 min for replicate a. See Fig. S1 for other time points and replicates. Transcriptome-wide correlation in time using: (C) Pearson correlation, and (D) Mutual Information-based correlation metrics (Methods) between time t0 (0 min) and ti (0, 0.5, 1, 2, 5, 10 min) for all 3 replicates (replicate a – red, replicate b – green, replicate c - blue) across 3391 genes with expression above 5 TPM (left panels) and 3389 genes upon removal of two highest expressed genes rnpB and lpp (right panels).
Figure 3
Figure 3
Attractor landscape by probability density distributions of correlations, transcriptomic elements and attractor genes. (A) Schematic trajectories for transcriptomic elements falling into attractor (red) and not falling into attractor (blue). (B) Distribution and (C) Standard deviation of Rv (top panel) and MIv (bottom panel) with different transcriptomic element size (denoted as n) of replicate a at 0.5 minutes. Distribution of Rv and MIv for ensembles of n randomly chosen genes (n = 25, 50, 100, 200, 400, 600, 800, 1000) were generated with 100 repeats. Standard deviation of Rv and MIv decreases as n increases (except for when n = 25 for Rv), and follows α/n + c law. See Fig. S3A,B for other time points. (D) 3D plot of the superimposition of the probability distribution (SPD) of Rv and MIv over all time points for the whole transcriptome. SPDs were estimated by getting Rv and MIv values of 100 randomly chosen genes for 100 times, using two-dimensional kernel density estimation. (E) Trajectory of whole genome (3389 genes) falling within attractor boundary (solid contour line) overlaid on SPD of whole transcriptome Rv and MIv. The trajectory was generated by averaging 100 trajectories of 100 randomly chosen genes from the pool of 3389 genes. (F) Trajectories of cumulative attractor (1800), and non-attractor (1589) genes overlaid on SPD of Rv and MIv for whole transcriptome. (G) Distribution of expression level for attractor (red), and non-attractor (blue) genes at representative t = 0. See Fig. S3D for other time points.
Figure 4
Figure 4
Principal component (PC) analysis and auto-correlations of whole transcriptome attractor and non-attractor genes. (A) Gene expression trajectory of whole transcriptome (black), attractor (red), non-attractor (blue), and no response genes (brown), obtained by taking the average trajectories of 3 replicates, presented on first 2 principal components space. Right panel indicates non-attractor trajectory on a larger scale. (B) Temporal correlation of whole transcriptome (black), attractor (red), and non-attractor (blue) genes using Pearson (top left panel), Spearman (top right panel), Biweight midcorrelation (bottom left panel) and Mutual Information-based (bottom right panel) correlation metrics.
Figure 5
Figure 5
Major gene expression patterns of attractor genes. (A) Hierarchical clustering of attractor genes reveals 13 clusters of temporal expression profiles. (B) Six temporal average expression profile constructed by regrouping the 13 clusters: Group A: Gradual decay: Group B: Gradual activation; Group C: Fast activation, followed by decay and re-activation; Group D: Early activation, followed by decay; Group E: Early activation followed by plateau; Group F: Early decay, followed by plateau.
Figure 6
Figure 6
Selected enriched biological processes (coloured hubs) with their associated genes (grey dots) in the 6 major expression patterns of attractor genes. Full list of enriched processes is available in Table S2.
Figure 7
Figure 7
Number of attractor genes (red), 2-fold change genes (cyan), and novel genes (purple).

References

    1. Bettenbrock K, et al. Towards a Systems Level Understanding of the Oxygen Response of Escherichia coli. Adv. Microb. Physiol. 2014;64:65–114. doi: 10.1016/B978-0-12-800143-1.00002-6. - DOI - PubMed
    1. Regenmortel MHVV. Reductionism and complexity in molecular biology. EMBO Rep. 2004;5:1016–1020. doi: 10.1038/sj.embor.7400284. - DOI - PMC - PubMed
    1. Ahn AC, Tewari M, Poon C-S, Phillips RS. The Limits of Reductionism in Medicine: Could Systems Biology Offer an Alternative? PLoS Med. 2006;3:e208. doi: 10.1371/journal.pmed.0030208. - DOI - PMC - PubMed
    1. Partridge JD, Scott C, Tang Y, Poole RK, Green J. Escherichia coli transcriptome dynamics during the transition from anaerobic to aerobic conditions. J. Biol. Chem. 2006;281:27806–27815. doi: 10.1074/jbc.M603450200. - DOI - PubMed
    1. Kim OD, Rocha M, Maia P. A Review of Dynamic Modeling Approaches and Their Application in Computational Strain Optimization for Metabolic Engineering. Front. Microbiol. 2018;9:1690. doi: 10.3389/fmicb.2018.01690. - DOI - PMC - PubMed

Publication types

MeSH terms