. 2020 Apr 3;10(1):5874.
doi: 10.1038/s41598-020-62543-5.

Synthetic mycobacterial molecular patterns partially complete Freund's adjuvant

Affiliations

Synthetic mycobacterial molecular patterns partially complete Freund's adjuvant

Jean-Yves Dubé et al. Sci Rep. .

Abstract

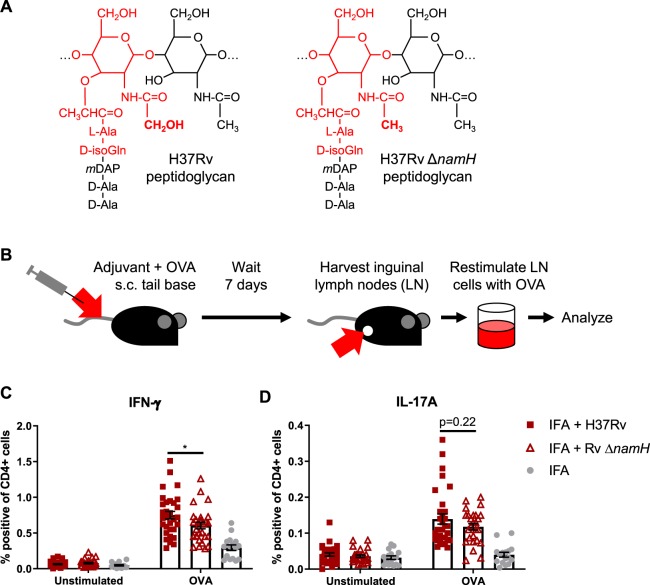
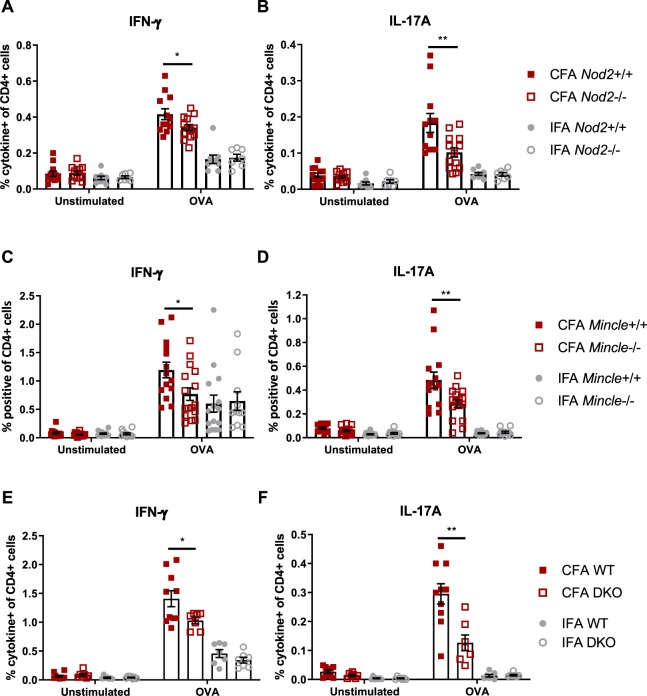
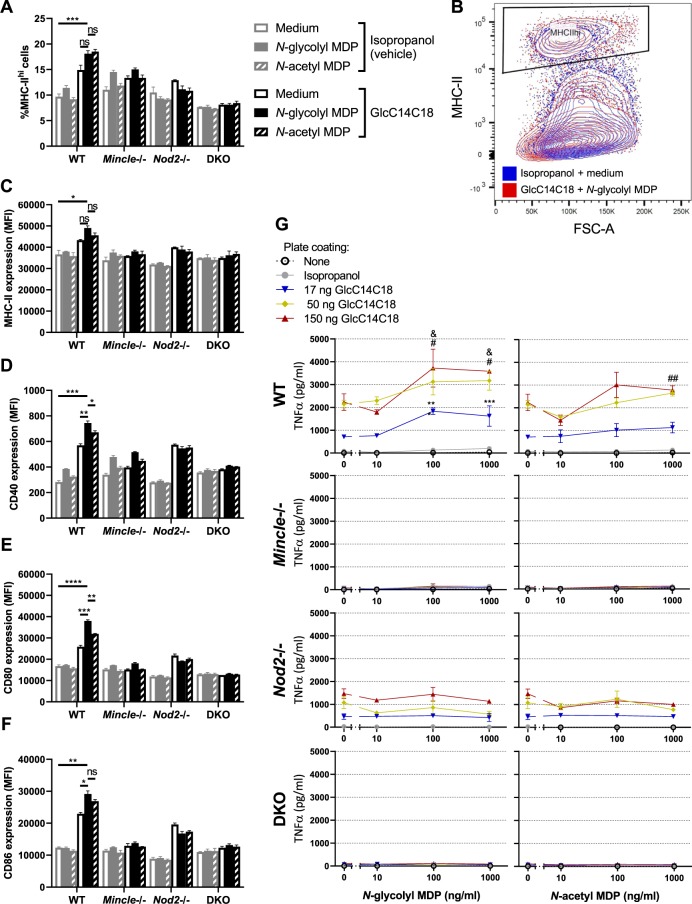
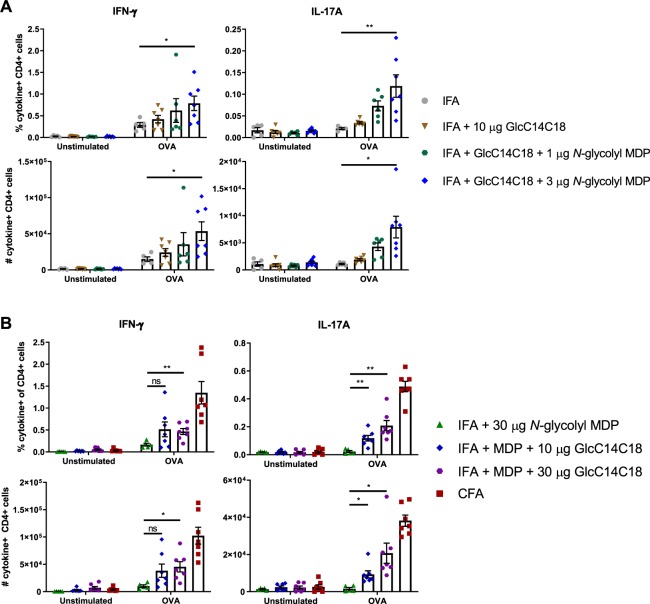
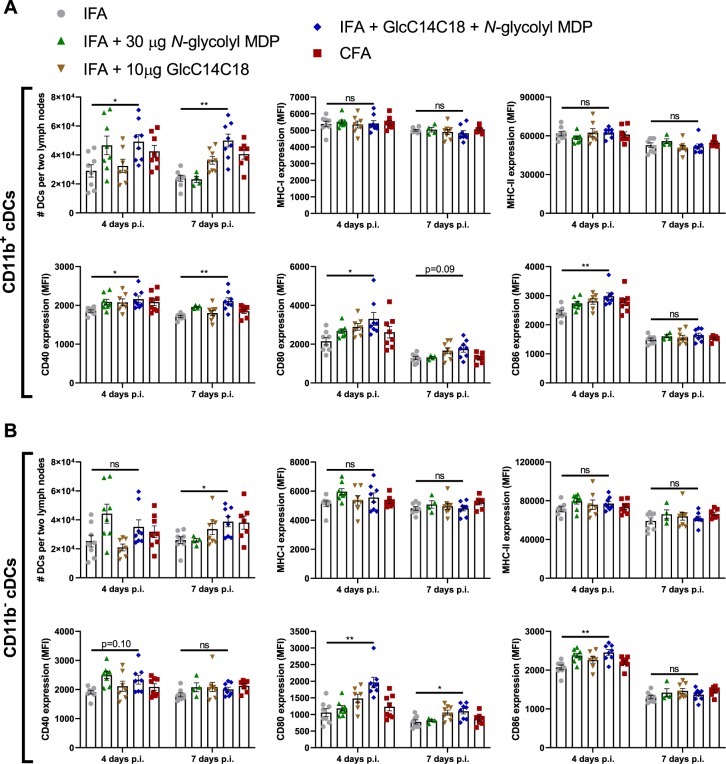
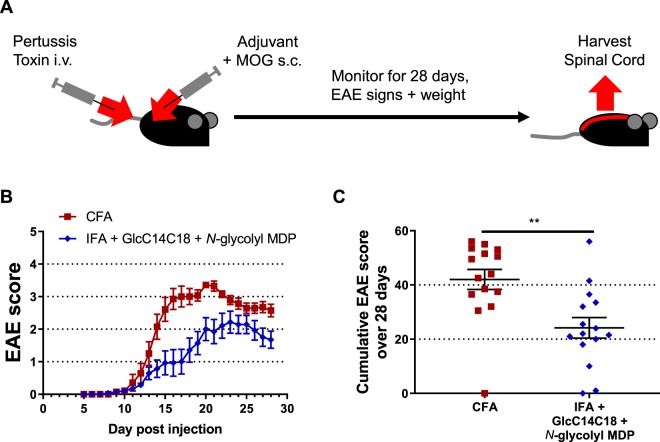
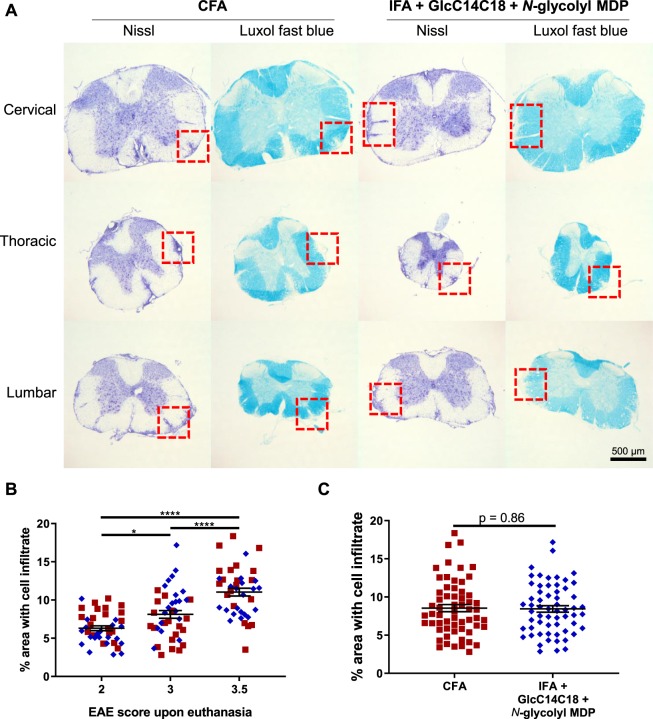
Complete Freund's adjuvant (CFA) has historically been one of the most useful tools of immunologists. Essentially comprised of dead mycobacteria and mineral oil, we asked ourselves what is special about the mycobacterial part of this adjuvant, and could it be recapitulated synthetically? Here, we demonstrate the essentiality of N-glycolylated peptidoglycan plus trehalose dimycolate (both unique in mycobacteria) for the complete adjuvant effect using knockouts and chemical complementation. A combination of synthetic N-glycolyl muramyl dipeptide and minimal trehalose dimycolate motif GlcC14C18 was able to upregulate dendritic cell effectors, plus induce experimental autoimmunity qualitatively similar but quantitatively milder compared to CFA. This research outlines how to substitute CFA with a consistent, molecularly-defined adjuvant which may inform the design of immunotherapeutic agents and vaccines benefitting from cell-mediated immunity. We also anticipate using synthetic microbe-associated molecular patterns (MAMPs) to study mycobacterial immunity and immunopathogenesis.


Conflict of interest statement

The authors declare no competing interests.

Figures

Figure 1
Figure 1
CFA-dependent cell-mediated immune responses as a function of mycobacterial namH. (A) PGN of wild-type H37Rv M. tuberculosis (left) and PGN of the ΔnamH mutant (right). The MDP motif is drawn in red, and the site of N-glcolylation is in bold font. With NamH, N-glycolylation was shown on ~70% of muramic acid residues, with N-acetylation on the remaining ~30%,. (B) Immunization scheme (relevant to Figs. 1, 2 and 4): mice were immunized with adjuvant emulsion containing OVA by s.c. injection at the base of the tail, and after seven days, inguinal (draining) lymph nodes were harvested. Lymph node cells were cultured ex vivo with or without OVA to examine the OVA-specific cytokine response by flow cytometry or ELISpot. (C,D) Proportion of cytokine-producing CD4+ CD8− lymph node cells of mice immunized against OVA with heat-killed M. tuberculosis strain H37Rv, H37Rv ΔnamH, or IFA alone, seven days prior. Shown are data pooled from four separate experiments with averages +/− SEM. p-values were calculated with two-tailed student’s t-tests. *p < 0.05. For IFA + H37Rv, IFA + H37Rv ΔnamH, and IFA alone, sample size N = 31, 27 and 16 mice, respectively. Each plotted point represents the result obtained from an individual mouse.
Figure 2
Figure 2
CFA-dependent cell-mediated immune responses as a function of host Nod2 and Mincle. Proportion of cytokine-producing CD4+CD8- lymph node cells of mice immunized against OVA with CFA or IFA seven days prior. (A,B) Nod2+/+ vs. Nod2−/− mice, data representative of two independent experiments with averages +/−SEM. p-values were calculated with two-tailed student’s t-tests. *p < 0.05; **p < 0.01. For CFA Nod2+/+, CFA Nod2−/−, IFA Nod2+/+ and IFA Nod2−/−, sample size N = 12, 13, 9 and 7 mice, respectively. (C,D), Mincle+/+ vs. Mincle−/− mice, data pooled from two independent experiments with averages +/- SEM. p-values were calculated with two-tailed student’s t-tests. *p < 0.05; **p < 0.01. For CFA Mincle+/+, CFA Mincle−/−, IFA Mincle+/+ and IFA Mincle−/−, sample size N = 14, 16, 15 and 11 mice, respectively. (E,F) WT (Mincle+/+Nod2+/+) vs. DKO (Mincle−/−Nod2−/−) mice with averages +/- SEM. p-values were calculated with two-tailed student’s t-tests. *p < 0.05; **p < 0.01. For CFA WT, CFA DKO, IFA WT and IFA DKO, sample size N = 10, 7, 7 and 7 mice, respectively.
Figure 3
Figure 3
MHC-II expression, costimulatory molecule upregulation and TNF production by BMDCs stimulated with GlcC14C18 and MDPs. (A) Percentage of cells expressing MHC-II at high levels (according to gate in panel B) after 24 hours of stimulation with the indicated MAMPs. (B) Gating of MHC-IIhi cells amongst live single CD11b+CD11c+ cells. (CF), median fluorescence intensity of (C), MHC-II; (D), CD40; (E), CD80; (F), CD86 on CD11b+CD11c+MHC-IIhi cells after 24 hours of stimulation with the indicated MAMPs (use legend of panel A). Shown are averages +/− SD of 3 individually stimulated and assayed cultures. To compare the combination of GlcC14C18+N-glycolyl MDP to unstimulated control, GlcC14C18 alone and GlcC14C18+N-acetyl MDP with WT cells, p-values were calculated using Dunnett’s T3 multiple comparisons test; p < 0.05; **p < 0.01; ***p < 0.001; ****p < 0.0001; ns, not significant, p > 0.05. G, Supernatant TNF after 6-hour stimulation with GlcC14C18 and MDPs. Shown are averages +/− SD of 3–6 individually stimulated and assayed culture wells. To determine which MDP dose elicited significantly more TNF over background dose of GlcC14C18, p-values were calculated with Dunnett’s multiple comparisons test. The *, # and & symbols were used for the 17, 50 and 150 ng GlcC14C18 doses respectively, where *p < 0.05; **p < 0.01; ***p < 0.001 (for clarity, non-significant p-values are not noted).
Figure 4
Figure 4
Complementation of IFA with synthetic mycobacterial MAMPs. Proportion of cytokine-producing CD4+CD8- lymph node cells of WT mice immunized against OVA seven days prior. (A) N-glycolyl MDP dose-dependent response with 10 µg GlcC14C18: IFA (N=4), IFA + 10 µg GlcC14C18 (N = 7), IFA + 10 µg GlcC14C18 + 1 µg N-glycolyl MDP (N = 6), and IFA + 10 µg GlcC14C18 + 3 µg N-glycolyl MDP (N = 7). Shown are data from individual mice, with averages +/− SEM. p-values were calculated with Welch’s two-tailed student’s t-tests. *p<0.05; **p<0.01. (B) GlcC14C18 dose-dependent response with 30 µg N-glycolyl MDP: IFA + 30 µg N-glycolyl MDP (N = 6), IFA + 30 µg N-glycolyl MDP + 10 µg GlcC14C18 (N = 7), IFA + 30 µg N-glycolyl MDP + 30 µg GlcC14C18 (N = 7), and CFA (N = 7). Shown are data from individual mice, with averages +/− SEM. In comparing IFA + 30 µg N-glycolyl MDP to IFA + N-glycolyl MDP + 10 or 30 µg GlcC14C18, p-values were calculated using Dunnett’s T3 multiple comparisons test. *p < 0.05; **p < 0.01; ns, not significant, p > 0.05.
Figure 5
Figure 5
Dynamics of cDCs in lymph nodes after immunization with synthetic mycobacterial MAMPs. (A) CD11b+ cDC quantities and median fluorescence intensity of MHC-I, MHC-II, CD40, CD80 and CD86 in mice immunized with the indicated adjuvants after 4 or 7 days. (B) CD11b- cDC quantities and median fluorescence intensity of MHC-I, MHC-II, CD40, CD80 and CD86 in mice immunized with the indicated adjuvants after 4 or 7 days. For all adjuvant groups, N = 8 mice, except for IFA+MDP at 7 days p.i. where N = 4 (each plotted point represents data from an individual mouse). Shown are averages +/− SEM. To determine if IFA + GlcC14C18 + N-glycolyl MDP altered cDC parameters compared to IFA alone, p-values were calculated using Dunnett’s T3 multiple comparisons test correcting for multiple timepoints and cDC type (CD11b+/−). *p < 0.05; **p < 0.01; ns, not significant, p > 0.05.
Figure 6
Figure 6
RR-EAE induced by IFA+GlcC14C18+MDP. (A) Experimental timeline. (B) Average EAE score +/− SEM over time of mice induced with CFA (N = 15) or IFA + 10 µg GlcC14C18 + 30 µg N-glycolyl MDP (N = 15). Mice were euthanized on day 28 post injection. (C) Cumulative EAE score, obtained by adding the EAE score of each mouse over each of the 28 days. Lines represent averages +/− SEM. p-value was calculated with two-tailed student’s t-test. **p = 0.0022.
Figure 7
Figure 7
Spinal cord pathology in RR-EAE mice induced by IFA+GlcC14C18+MDP. (A) Nissl and Luxol fast blue (LFB) stains of spinal cord sections from RR-EAE-induced mice at day 28 post injection, having an EAE score of 3.5 upon euthanasia. Red boxes highlight cellular infiltration and spatially associated demyelination of the white matter seen by Nissl and LFB staining, respectively. (B) Quantitative spinal cord pathology per EAE score upon euthanasia. Statistical significance was determined by Tukey’s multiple comparisons test. *p < 0.05 and ****p < 0.0001. N = 40 sections for each group (20 from CFA and 20 from synthetic adjuvant of equivalent EAE scores). Lines indicate averages +/− SEM (C), Quantitative spinal cord pathology per adjuvant. Statistical significance was tested with two-tailed unpaired Welch’s t-test; a power calculation for given variances and N = 60 sections per group indicated an ability to discern +/− 15% difference vs. CFA control. Lines indicate averages +/− SEM.

References

    1. Chase MW, Landsteiner K. Experiments on Transfer of Cutaneous Sensitivity to Simple Compounds. Proc. Soc. Exp. Biol. Med. 1942;49:688–690. doi: 10.3181/00379727-49-13670. - DOI
    1. Chase MW. The Cellular Transfer of Cutaneous Hypersensitivity to Tuberculin. Proc. Soc. Exp. Biol. Med. 1945;59:134–135. doi: 10.3181/00379727-59-15006P. - DOI - PubMed
    1. Baxter AG. The origin and application of experimental autoimmune encephalomyelitis. Nat. Rev. Immunol. 2007;7:904–912. doi: 10.1038/nri2190. - DOI - PubMed
    1. Constantinescu CS, Farooqi N, O’Brien K, Gran B. Experimental autoimmune encephalomyelitis (EAE) as a model for multiple sclerosis (MS) Br. J. Pharmacol. 2011;164:1079–1106. doi: 10.1111/bph.2011.164.issue-4. - DOI - PMC - PubMed
    1. Vogel FR. Improving Vaccine Performance with Adjuvants. Clin. Infect. Dis. 2000;30:S266–270. doi: 10.1086/313883. - DOI - PubMed

Publication types