. 2021 Jan;73(1):53-67.
doi: 10.1002/hep.31255. Epub 2020 Nov 27.

Toll-Like Receptor 8 Agonist GS-9688 Induces Sustained Efficacy in the Woodchuck Model of Chronic Hepatitis B

Affiliations

Toll-Like Receptor 8 Agonist GS-9688 Induces Sustained Efficacy in the Woodchuck Model of Chronic Hepatitis B

Stephane Daffis et al. Hepatology. 2021 Jan.

Abstract

Background and aims: GS-9688 (selgantolimod) is an oral selective small molecule agonist of toll-like receptor 8 in clinical development for the treatment of chronic hepatitis B. In this study, we evaluated the antiviral efficacy of GS-9688 in woodchucks chronically infected with woodchuck hepatitis virus (WHV), a hepadnavirus closely related to hepatitis B virus.

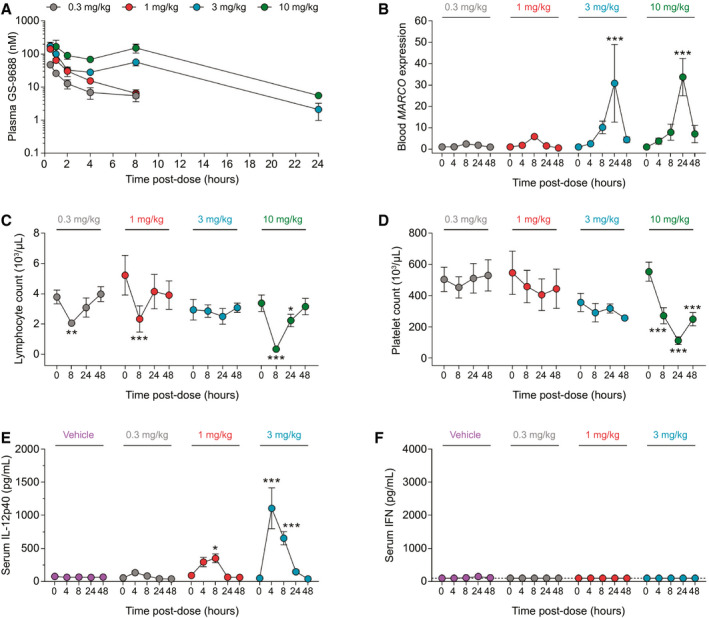
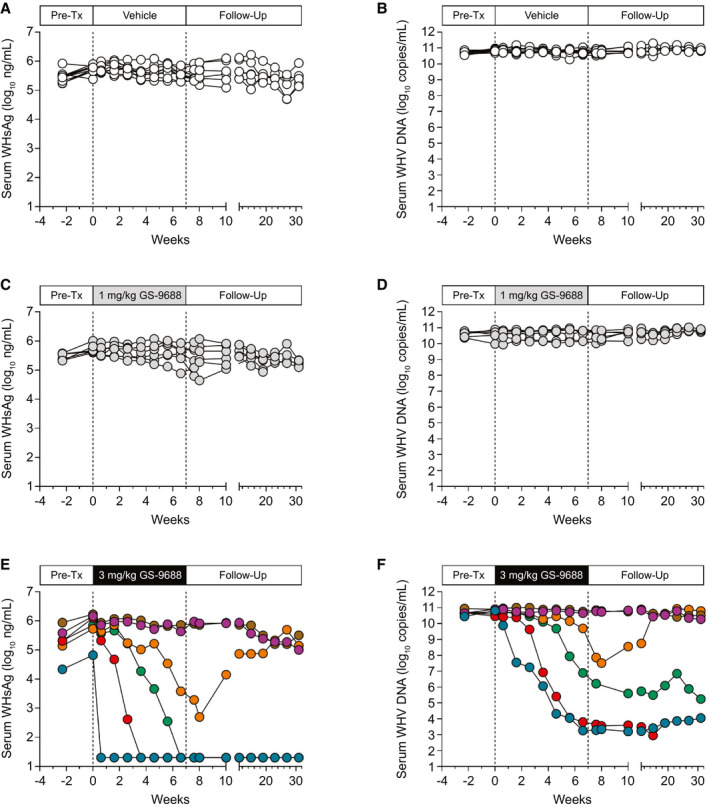
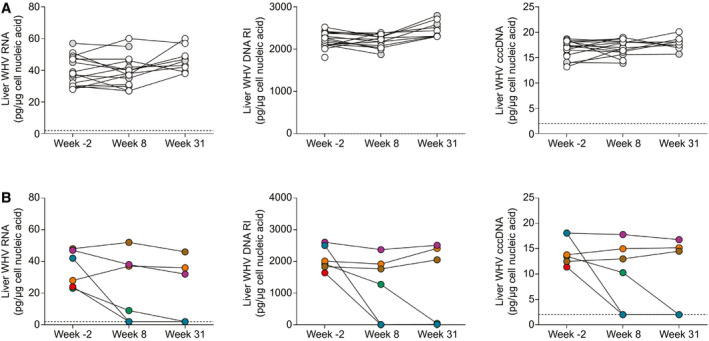
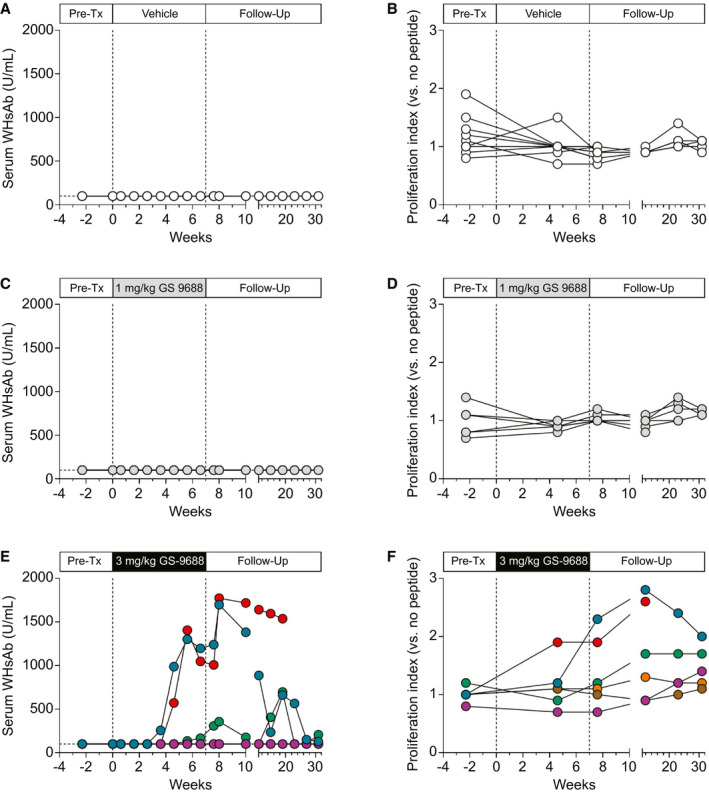
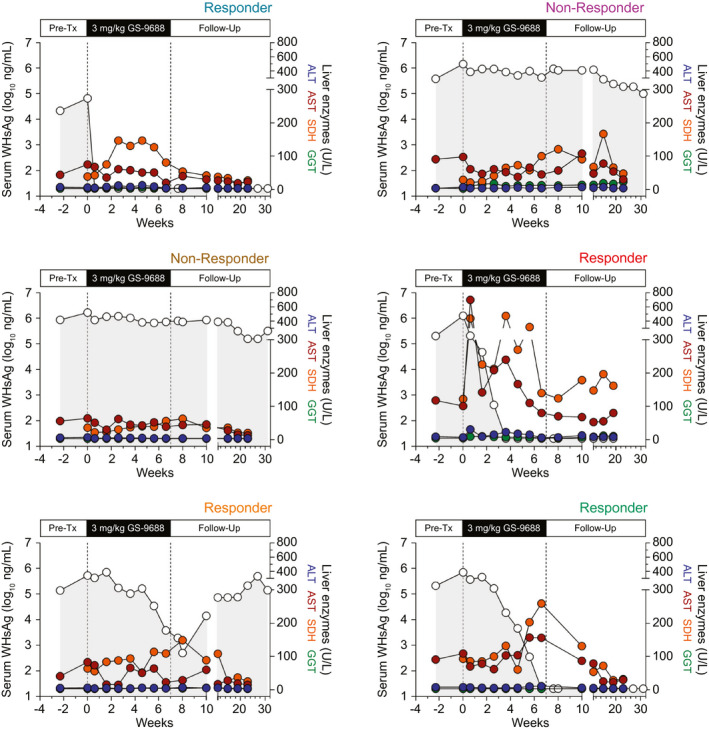
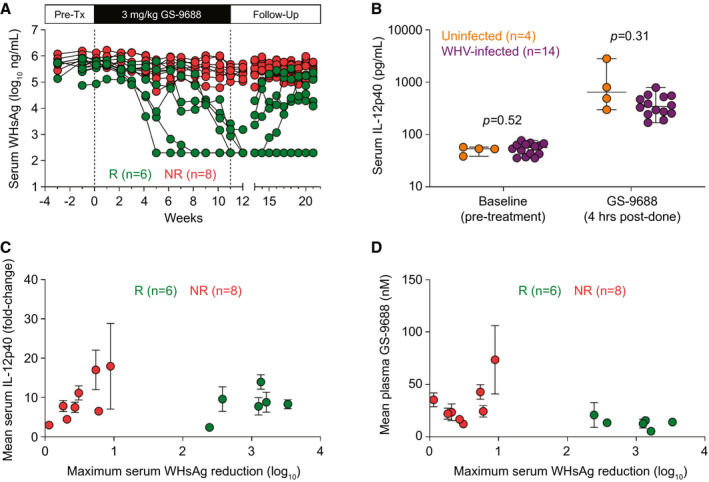
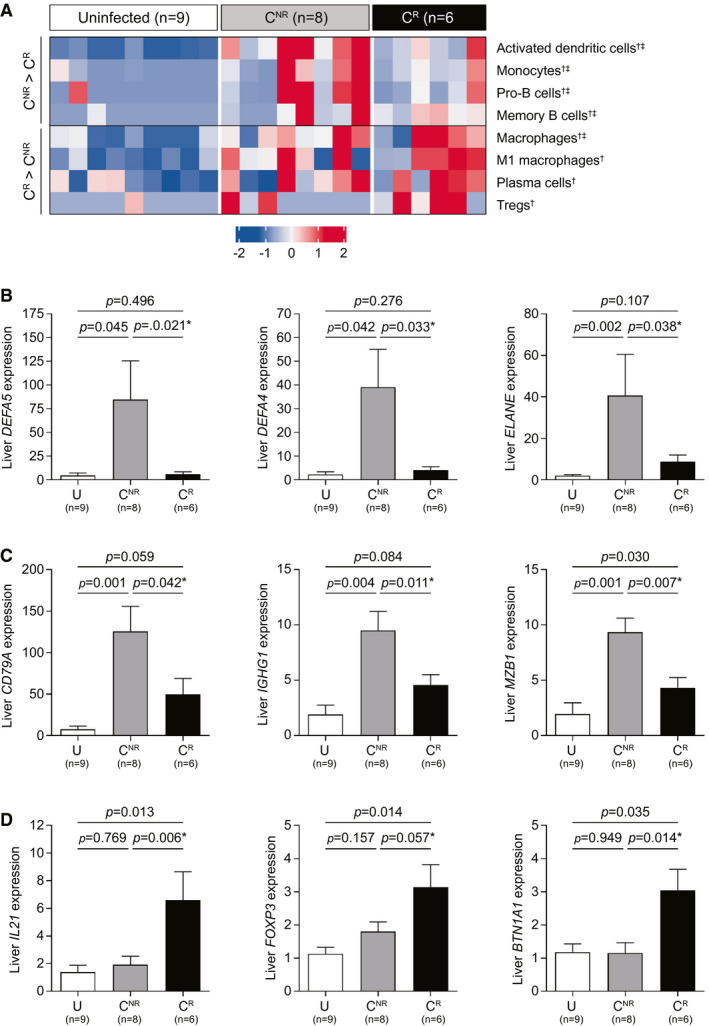
Approach and results: WHV-infected woodchucks received eight weekly oral doses of vehicle, 1 mg/kg GS-9688, or 3 mg/kg GS-9688. Vehicle and 1 mg/kg GS-9688 had no antiviral effect, whereas 3 mg/kg GS-9688 induced a >5 log10 reduction in serum viral load and reduced WHV surface antigen (WHsAg) levels to below the limit of detection in half of the treated woodchucks. In these animals, the antiviral response was maintained until the end of the study (>5 months after the end of treatment). GS-9688 treatment reduced intrahepatic WHV RNA and DNA levels by >95% in animals in which the antiviral response was sustained after treatment cessation, and these woodchucks also developed detectable anti-WHsAg antibodies. The antiviral efficacy of weekly oral dosing with 3 mg/kg GS-9688 was confirmed in a second woodchuck study. The antiviral response to GS-9688 did not correlate with systemic GS-9688 or cytokine levels but was associated with transient elevation of liver injury biomarkers and enhanced proliferative response of peripheral blood mononuclear cells to WHV peptides. Transcriptomic analysis of liver biopsies taken prior to treatment suggested that T follicular helper cells and various other immune cell subsets may play a role in the antiviral response to GS-9688.

Conclusions: Finite, short-duration treatment with a clinically relevant dose of GS-9688 is well tolerated and can induce a sustained antiviral response in WHV-infected woodchucks; the identification of a baseline intrahepatic transcriptional signature associated with response to GS-9688 treatment provides insights into the immune mechanisms that mediate this antiviral effect.


Figures

FIG. 1
FIG. 1
PK and PD response of uninfected woodchucks to oral GS‐9688. (A‐D) Uninfected woodchucks (n = 3‐6/group) were orally administered a single dose of 0.3, 1, 3, or 10 mg/kg GS‐9688. Note that only female animals (n = 3) were administered 1 and 3 mg/kg GS‐9688. (A) Plasma GS‐9688 concentration after dosing. The lower limit of quantification for the assay is 0.1 nM. (B) Whole blood MARCO mRNA levels measured by quantitative real‐time PCR. Data are expressed as fold‐change relative to predose (baseline). (C) Whole blood lymphocyte count. Normal range 3.3‐4.4 (103/μL). (D) Whole blood platelet count. Normal range 506‐642 (103/μL). (E,F) Uninfected woodchucks (n = 4/group) were orally administered a single dose of vehicle or 0.3, 1, or 3 mg/kg GS‐9688. Serum IL‐12p40 and IFN were measured by electro‐chemiluminescence assay and bioassay, respectively. Of note, the IFN bioassay detects woodchuck IFN‐α and IFN‐γ with similar sensitivity. However, because GS‐9688 is a potent inducer of IFN‐γ but not IFN‐α or IFN‐β, any signal detected by the IFN bioassay in the serum of GS‐9688‐treated woodchucks is likely to be predominantly due to IFN‐γ. The lower limit of detection of the IL‐12p40 assay is 4 pg/mL. The lower limit of detection of the IFN assay is 100 pg/mL and is indicated by a dotted line. For all plots, circles indicate the mean and error bars represent the SEM. For (B‐E), statistical significance relative to baseline was calculated by two‐way analysis of variance with Dunnett’s multiple comparison correction. Only P values <0.05 are labeled; *P < 0.05, **P < 0.01, ***P < 0.001.
FIG. 2
FIG. 2
Serum WHsAg and WHV DNA levels in WHV‐infected woodchucks treated with GS‐9688. WHV‐infected woodchucks were dosed orally once per week for 8 weeks with vehicle, 1 mg/kg GS‐9688, or 3 mg/kg GS‐9688 (Supporting Fig. S3). Vertical dotted lines denote the dosing period. (A,C,E) Serum WHsAg levels by dose group. (B,D,F) Serum WHV DNA levels by dose group. Each line represents an individual animal. Abbreviation: Pre‐Tx, pretreatment.
FIG. 3
FIG. 3
Intrahepatic viral parameters in WHV‐infected woodchucks treated with GS‐9688. WHV‐infected woodchucks were dosed orally once per week for 8 weeks with vehicle, 1 mg/kg GS‐9688, or 3 mg/kg GS‐9688 (Supporting Fig. S3). Liver biopsies were obtained before treatment (week –2), 1 week after treatment (week 8), and at end of study (week 31); and intrahepatic WHV DNA RI, WHV RNA, and WHV cccDNA levels were measured by northern blot (WHV RNA) or Southern blot (WHV DNA RI and cccDNA). (A) Data from woodchucks dosed with vehicle (open circles) and 1 mg/kg GS‐9688 (gray circles). (B) Data from woodchucks dosed with 3 mg/kg GS‐9688. For all plots, each line represents an individual animal; circle colors match those in Fig. 2. The lower limit of detection for the assays is approximately 2 pg/μg cellular nucleic acid and is indicated by a horizontal dotted line.
FIG. 4
FIG. 4
Serum WHsAb levels and PBMC proliferative response to viral peptides in WHV‐infected woodchucks treated with GS‐9688. WHV‐infected woodchucks were dosed orally once per week for 8 weeks with vehicle, 1 mg/kg GS‐9688, or 3 mg/kg GS‐9688 (Supporting Fig. S3). Vertical dotted lines denote the dosing period. (A,C,E) Serum WHsAb levels by dose group. (B,D,F) Proliferative response of PBMCs to WHV core peptides by dose group. A proliferation index of ≥ 2.0 is considered positive in this assay. Each line represents an individual animal; circle colors match those in Fig. 2. Abbreviation: Pre‐Tx, pretreatment.
FIG. 5
FIG. 5
Serum WHsAg and liver enzyme levels in WHV‐infected woodchucks treated with 3 mg/kg GS‐9688. WHV‐infected woodchucks were dosed orally once per week for 8 weeks with 3 mg/kg GS‐9688 (Supporting Fig. S3). Serum WHsAg (open circles) is plotted on the left y‐axis. Serum alanine aminotransferase (blue circles), AST (red circles), SDH (orange circles), and gamma‐glutamyltransferase (green circles) are all plotted on the right y‐axis. Liver enzyme data at week 31 (24 weeks after last dose) were not plotted because some surviving animals had developed HCC by this time. The color of responder/nonresponder labels at the top right of each plot matches the circle color in Fig. 2E,F. Abbreviations: ALT, alanine aminotransferase; GGT, gamma‐glutamyltransferase; Pre‐Tx, pretreatment.
FIG. 6
FIG. 6
Antiviral response does not correlate with systemic GS‐9688 and IL‐12p40 levels in WHV‐infected woodchucks treated with GS‐9688. WHV‐infected woodchucks were dosed orally once per week for 12 weeks with 3 mg/kg GS‐9688 (Supporting Fig. S7). (A) Serum WHsAg in woodchucks dosed with 3 mg/kg GS‐9688. Vertical dotted lines denote the dosing period. Each line represents an individual animal. Antiviral responders (green circles, n = 6) are defined as animals with a ≥ 1.0 log10 reduction of serum WHsAg during treatment (nonresponders shown as red circles, n = 8). (B) Serum IL‐12p40 levels before and after GS‐9688 treatment in uninfected woodchucks (n = 4, orange circles) and WHV‐infected woodchucks (n = 14, purple circles). Each circle represents an individual animal at a single time point, except for the serum IL‐12p40 levels in WHV‐infected woodchucks after GS‐9688 treatment (each circle represents the mean of weeks 1, 3, 5, 7, 9, and 11 for an individual animal). The horizontal line indicates the median, and error bars represent the range. Statistical significance was calculated by unpaired t test with Welch’s correction. (C) Relationship between serum IL‐12p40 levels at 4 hours postdose (expressed as fold‐change relative to pretreatment) and the maximum reduction in WHsAg during treatment. (D) Relationship between plasma GS‐9688 levels at 4 hours postdose and the maximum reduction in WHsAg during treatment. For (C,D), circles indicate the mean of six time points (weeks 1, 3, 5, 7, 9, and 11), and error bars represent the SEM. Circle colors match those in (A). Abbreviations: NR, nonresponder; Pre‐Tx, pretreatment; R, responder.
FIG. 7
FIG. 7
Baseline intrahepatic transcriptional profile in WHV‐infected woodchucks correlates with antiviral response to GS‐9688 treatment. WHV‐infected woodchucks were dosed orally once per week for 12 weeks with 3 mg/kg GS‐9688 (Supporting Fig. S7). Liver biopsies collected from uninfected woodchucks (U, n = 9) and from WHV‐infected woodchucks prior to GS‐9688 treatment (baseline) were analyzed by RNA‐sequencing. The WHV‐infected animals were classified as antiviral responders (CR, n = 6) or nonresponders (CNR, n = 8) to GS‐9688 treatment, as defined in Fig. 6. (A) RNA‐sequencing data were analyzed by xCell. Each column represents a different animal, and each row represents an individual cell type; overexpression (red) and underexpression (blue) are indicated by the scale bar for z‐score values. The mean z score was greater for CNR than CR for the top four rows, whereas the mean z score was greater for CR than CNR for the bottom four rows. Symbols adjacent to the cell type names indicate statistical significance: unadjusted P value <0.05 for CR versus U, unadjusted P value <0.05 for CNR versus U. The complete xCell analysis (n = 39 cell subsets) is provided in Supporting Fig. S9. (B‐D) RNA‐sequencing data for select genes that were differentially expressed in CR versus CNR. (B) Neutrophil‐associated genes. (C) B cell–associated genes. (D) TFH and Treg‐associated genes. Data are expressed as fold‐change relative to uninfected woodchucks; bar height indicates the mean, and error bars represent the SEM. Adjusted P values (FDR) for CR versus U and CNR versus U are displayed for each gene. No gene reached FDR < 0.05 in the CR versus CNR comparison; unadjusted P values are displayed and are denoted by an asterisk. All statistical analyses were performed using a Wilcoxon rank‐sum test with or without multiple testing correction by the Benjamini and Hochberg method. Abbreviations: BTN1A1, butyrophilin subfamily 1 member A1; DEFA, defensin alpha; ELANE, elastase, neutrophil expressed; FOXP3, forkhead box P3; IGHG1, immunoglobulin heavy constant gamma 1; MZB1, marginal zone B and B1 cell specific protein.

References

    1. Bertoletti A, Ferrari C. Adaptive immunity in HBV infection. J Hepatol 2016;64(1 Suppl.):S71‐S83. - PubMed
    1. Maini MK, Burton AR. Restoring, releasing or replacing adaptive immunity in chronic hepatitis B. Nat Rev Gastroenterol Hepatol 2019;16:662‐675. - PubMed
    1. Gorden KB, Gorski KS, Gibson SJ, Kedl RM, Kieper WC, Qiu X, et al. Synthetic TLR agonists reveal functional differences between human TLR7 and TLR8. J Immunol 2005;174:1259‐1268. - PubMed
    1. Peng G, Guo Z, Kiniwa Y, Voo KS, Peng W, Fu T, et al. Toll‐like receptor 8‐mediated reversal of CD4+ regulatory T cell function. Science 2005;309:1380‐1384. - PubMed
    1. Poulin LF, Salio M, Griessinger E, Anjos‐Afonso F, Craciun L, Chen JL, et al. Characterization of human DNGR‐1+ BDCA3+ leukocytes as putative equivalents of mouse CD8alpha+ dendritic cells. J Exp Med 2010;207:1261‐1271. - PMC - PubMed

Publication types

MeSH terms