

Pre-analytical factors affecting the establishment of a single tube assay for multiparameter liquid biopsy detection in melanoma patients
- PMID: 32246814
- PMCID: PMC7191195
- DOI: 10.1002/1878-0261.12669
Pre-analytical factors affecting the establishment of a single tube assay for multiparameter liquid biopsy detection in melanoma patients
Abstract
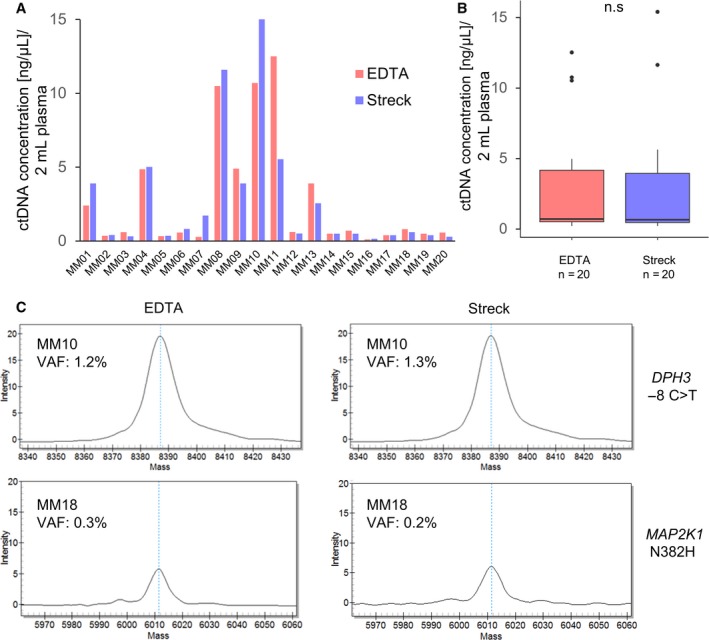
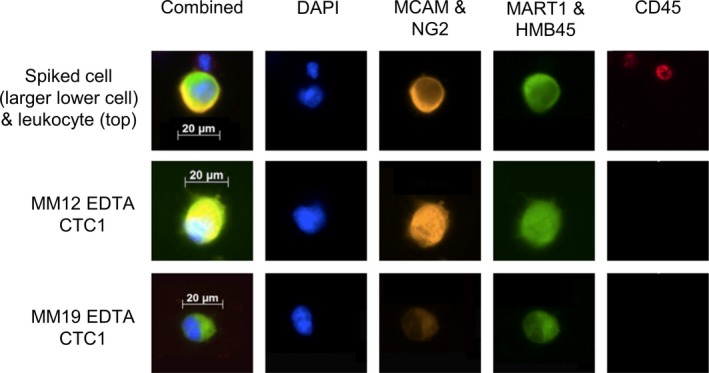
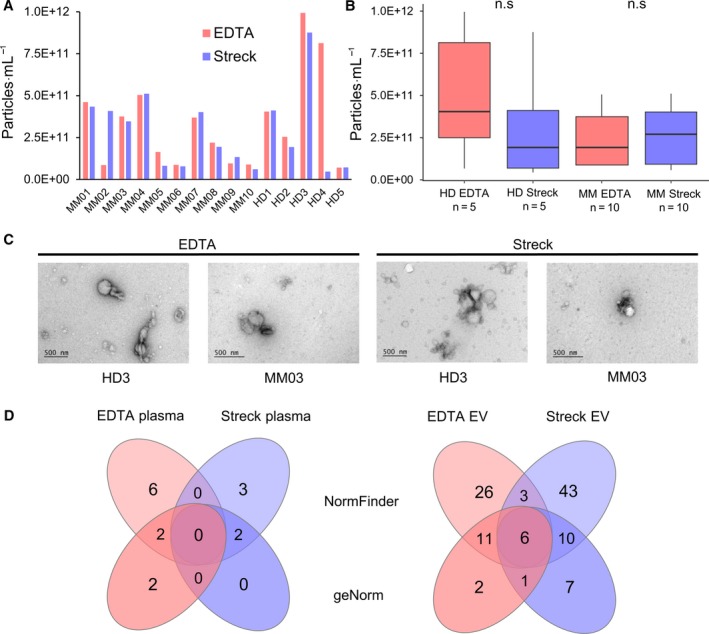
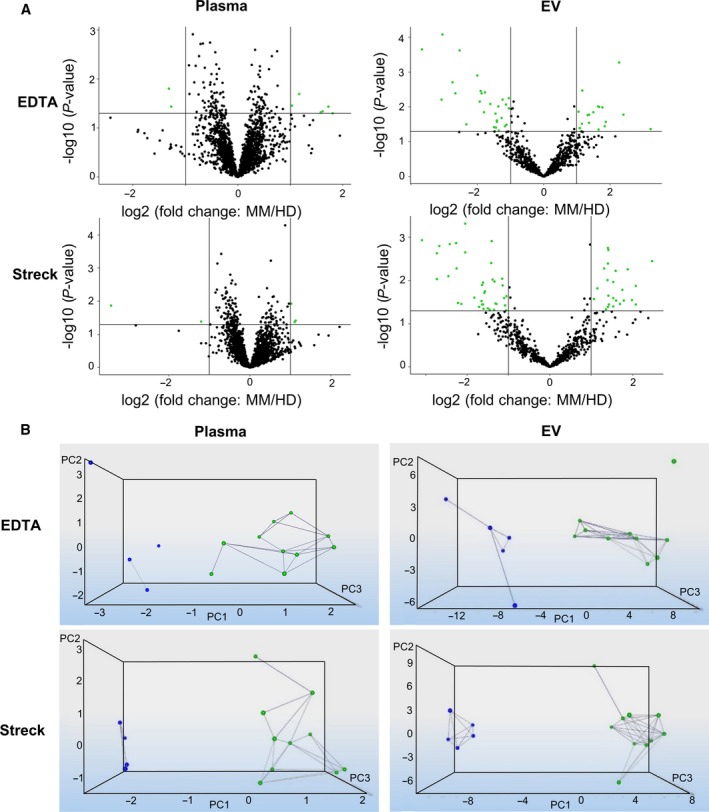
The combination of liquid biomarkers from a single blood tube can provide more comprehensive information on tumor development and progression in cancer patients compared to single analysis. Here, we evaluated whether a combined analysis of circulating tumor cells (CTCs), circulating tumor DNA (ctDNA), and circulating cell-free microRNA (miRNA) in total plasma and extracellular vesicles (EV) from the same blood sample is feasible and how the results are influenced by the choice of different blood tubes. Peripheral blood from 20 stage IV melanoma patients and five healthy donors (HD) was collected in EDTA, Streck, and Transfix tubes. Peripheral blood mononuclear cell fraction was used for CTC analysis, whereas plasma and EV fractions were used for ctDNA mutation and miRNA analysis. Mutations in cell-free circulating DNA were detected in 67% of patients, with no significant difference between the tubes. CTC was detected in only EDTA blood and only in 15% of patients. miRNA NGS (next-generation sequencing) results were highly influenced by the collection tubes and could only be performed from EDTA and Streck tubes due to hemolysis in Transfix tubes. No overlap of significantly differentially expressed miRNA (patients versus HD) could be found between the tubes in total plasma, whereas eight miRNA were commonly differentially regulated in the EV fraction. In summary, high-quality CTCs, ctDNA, and miRNA data from a single blood tube can be obtained. However, the choice of blood collection tubes is a critical pre-analytical variable.
Keywords: CTC; EV; ctDNA; liquid biopsy; melanoma; miRNA.
© 2020 The Authors. Published by FEBS Press and John Wiley & Sons Ltd.
Conflict of interest statement
Mikael Kubista is an employee of TATAA Biocenter AB. Alexander Sartori and Darryl Irwin are employees of Agena Bioscience GmbH. Elina Serkkola and Taija af Hällström are employees of Orion Pharma. Markus Sprenger‐Haussels, Melanie Hussong, and Jonathan Shaffer are employees of QIAGEN Inc/GmbH.
Figures
References
-
- Alidousty C, Brandes D, Heydt C, Wagener S, Wittersheim M, Schafer SC, Holz B, Merkelbach‐Bruse S, Buttner R, Fassunke J et al (2017) Comparison of blood collection tubes from three different manufacturers for the collection of cell‐free DNA for liquid biopsy mutation testing. J Mol Diagn 19, 801–804. - PubMed
-
- Alix‐Panabieres C and Pantel K (2016) Clinical applications of circulating tumor cells and circulating tumor DNA as liquid biopsy. Cancer Discov 6, 479–491. - PubMed
-
- Andersen CL, Jensen JL and Ørntoft TF (2004) Normalization of real‐time quantitative reverse transcription‐PCR data: a model‐based variance estimation approach to identify genes suited for normalization, applied to bladder and colon cancer data sets. Cancer Res 64, 5245–5250. - PubMed
-
- Anfossi S, Babayan A, Pantel K and Calin GA (2018) Clinical utility of circulating non‐coding RNAs—an update. Nat Rev Clin Oncol 15, 541–563. - PubMed
Publication types
MeSH terms
Substances
LinkOut - more resources
Full Text Sources
Other Literature Sources
Medical
Molecular Biology Databases
Miscellaneous
