. 2020 Jun 1;36(12):3687-3692.
doi: 10.1093/bioinformatics/btaa222.

GenMap: ultra-fast computation of genome mappability

Affiliations

GenMap: ultra-fast computation of genome mappability

Christopher Pockrandt et al. Bioinformatics. .

Abstract

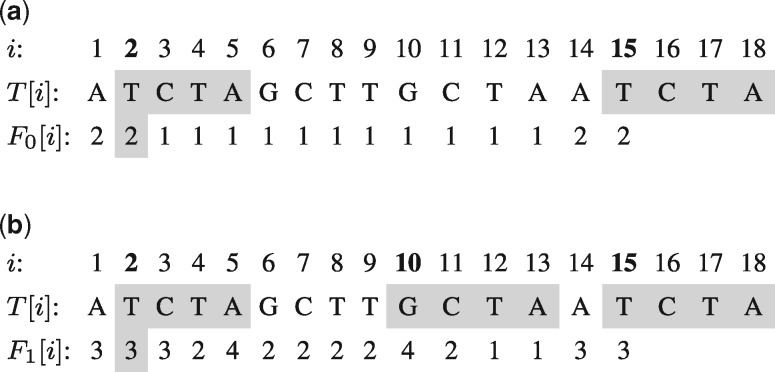
Motivation: Computing the uniqueness of k-mers for each position of a genome while allowing for up to e mismatches is computationally challenging. However, it is crucial for many biological applications such as the design of guide RNA for CRISPR experiments. More formally, the uniqueness or (k, e)-mappability can be described for every position as the reciprocal value of how often this k-mer occurs approximately in the genome, i.e. with up to e mismatches.

Results: We present a fast method GenMap to compute the (k, e)-mappability. We extend the mappability algorithm, such that it can also be computed across multiple genomes where a k-mer occurrence is only counted once per genome. This allows for the computation of marker sequences or finding candidates for probe design by identifying approximate k-mers that are unique to a genome or that are present in all genomes. GenMap supports different formats such as binary output, wig and bed files as well as csv files to export the location of all approximate k-mers for each genomic position.

Availability and implementation: GenMap can be installed via bioconda. Binaries and C++ source code are available on https://github.com/cpockrandt/genmap.


Figures

Fig. 1.
Fig. 1.
(k, e)-frequency vectors Fe for k=4 and e{0,1} on the same sequence. A frequency of 1 indicates that the k-mer starting at that position in the text is unique in the entire sequence without errors, respectively, with up to one mismatch. (a) (4, 0)-frequency and (b) (4, 1)-frequency
Fig. 2.
Fig. 2.
The optimum search scheme for two mismatches consists of three searches with four pieces each. The arrows indicate in which order the pieces are searched. The error bounds below each part are cumulative bounds, i.e. the minimum number of errors that must, respectively, the maximum number of errors that can be spent until searching the end of the corresponding piece. Illustrated for searching the 8-mer CGTACAAG. The forward search covers the error distributions 0010, 0011, 0020, the backward search covers 2000, 1100, 0200, 1010, 0110 and the bidirectional search 0000, 0001, 0002, 1000, 1001, 0100, 0101. (a) Forward search: Sfwd=(1234, 0011, 0022); (b) backward search: Sbwd=(4321, 0002, 0122) and (c) bidirectional search: Sbi=(3214, 0000, 0112)
Fig. 3.
Fig. 3.
Searching s overlapping k-mers using optimum search schemes for the infix and extending it using backtracking. Illustrated for k=11 and s=4. (a) First, the common overlap (light gray) is searched using optimum search schemes. Second, the search of T1 and T2 is continued recursively by extending the previously identified approximate matches of the infix in the index by GC to the left (allowing for the remaining number of errors; medium gray). T1 and T2 are then retrieved separately by backtracking in the index by one character to the left and one character to the right (allowing for an error, if any left; dark gray). T3 and T4 are extended analogously in a recursive manner. (b) The same strategy presented as a backtracking tree. It is traversed for all occurrences reported by the search of the infix T[4, 11] using optimum search schemes. Each edge also has to account for remaining errors, i.e. approximate string matching is performed using backtracking
Fig. 4.
Fig. 4.
Illustration of the experiments performed on E.coli sequences in Tables 2 and 3. (a) Four strains belonging to the same phylogenetic group. The sequence in light gray is conserved within this group and a marker sequence. The light gray k-mers belonging to this marker sequence are also all found in the other strains. The k-mers in dark gray are unique among all four strains and allow distinguishing each of the strains. (b) Six sequences belonging to two different phylogenetic groups. Marker sequences are highlighted in light and dark gray. They only occur in one of the groups and are present in all of its strains

References

    1. Antoniou P. et al. (2009) Mapping uniquely occurring short sequences derived from high throughput technologies to a reference genome In: Information Technology and Applications in Biomedicine (ITAB 2009). IEEE, pp. 1–4. Available at: https://ieeexplore.ieee.org/document/5394394.
    1. Clermont O. et al. (2000) Rapid and simple determination of the Escherichia coli phylogenetic group. Appl. Environ. Microbiol., 66, 4555–4558. - PMC - PubMed
    1. Derrien T. et al. (2012) Fast computation and applications of genome mappability. PLoS One, 7, e30377. - PMC - PubMed
    1. Fonseca N.A. et al. (2012) Tools for mapping high-throughput sequencing data. Bioinformatics, 28, 3169–3177. - PubMed
    1. Karimzadeh M. et al. (2018) Umap and Bismap: quantifying genome and methylome mappability. Nucleic Acids Res., 46, e120. - PMC - PubMed

Publication types