

SARS-CoV-2 receptor ACE2 and TMPRSS2 are primarily expressed in bronchial transient secretory cells
- PMID: 32246845
- PMCID: PMC7232010
- DOI: 10.15252/embj.20105114
SARS-CoV-2 receptor ACE2 and TMPRSS2 are primarily expressed in bronchial transient secretory cells
Abstract
The SARS-CoV-2 pandemic affecting the human respiratory system severely challenges public health and urgently demands for increasing our understanding of COVID-19 pathogenesis, especially host factors facilitating virus infection and replication. SARS-CoV-2 was reported to enter cells via binding to ACE2, followed by its priming by TMPRSS2. Here, we investigate ACE2 and TMPRSS2 expression levels and their distribution across cell types in lung tissue (twelve donors, 39,778 cells) and in cells derived from subsegmental bronchial branches (four donors, 17,521 cells) by single nuclei and single cell RNA sequencing, respectively. While TMPRSS2 is strongly expressed in both tissues, in the subsegmental bronchial branches ACE2 is predominantly expressed in a transient secretory cell type. Interestingly, these transiently differentiating cells show an enrichment for pathways related to RHO GTPase function and viral processes suggesting increased vulnerability for SARS-CoV-2 infection. Our data provide a rich resource for future investigations of COVID-19 infection and pathogenesis.
Keywords: FURIN; COVID-19; Human Cell Atlas; epithelial differentiation; respiratory tract.
© 2020 The Authors. Published under the terms of the CC BY 4.0 license.
Conflict of interest statement
The authors declare that they have no conflict of interest.
Figures
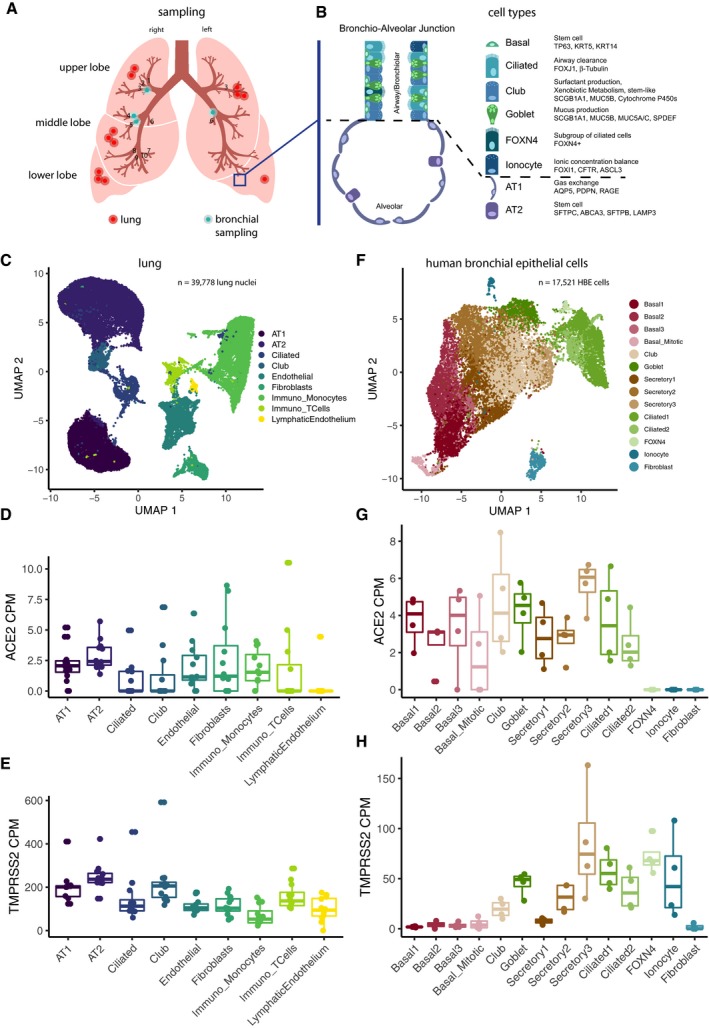
Sampling location of the surgical lung specimens and human bronchial epithelial cells (HBECs) used in this study. Blue rectangle is zoomed in (B).
Overview of the major cell types in the lung and airways.
Uniform manifold approximation and projection (UMAP) of primary lung samples single nuclei RNA sequencing. Cell types are color‐coded.
Expression values of ACE2 in the cell types of primary lung samples.
Expression values of TMPRSS2 in the cell types of primary lung samples.
UMAP projections of HBEC single cell RNA sequencing data. Cell types are color‐coded.
Expression values of ACE2 in the cell types of HBECs.
Expression values of TMPRSS2 in the cell types of HBECs.
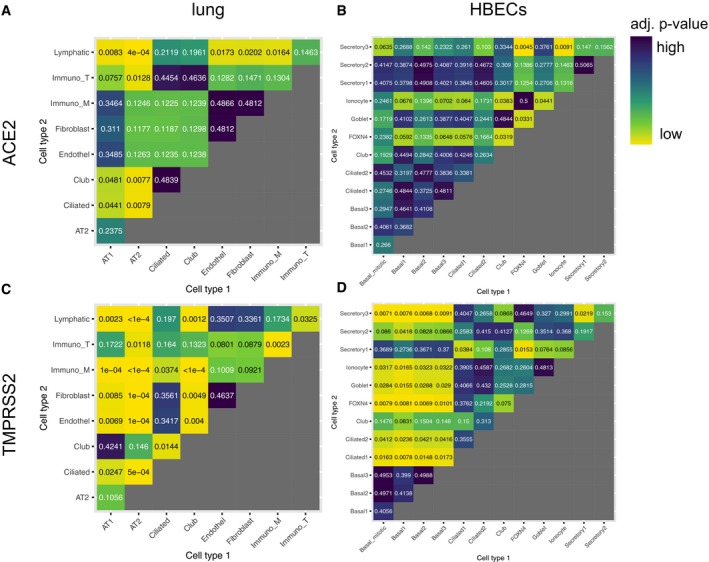
- A–D
Heatmaps indicating the P‐values of comparisons of expression levels between different cell types in the lung (A, C) and HBECs (B, D).
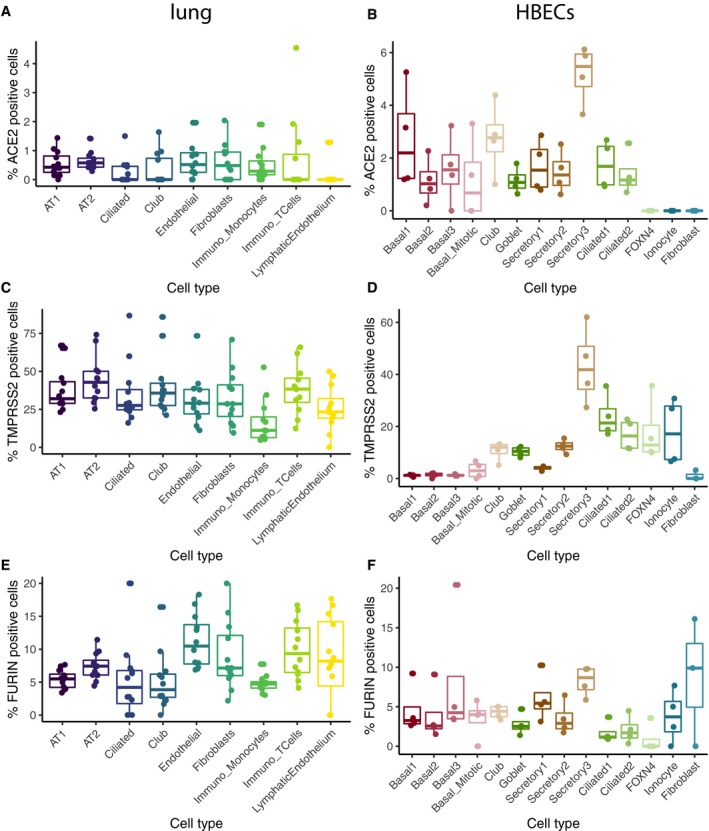
- A, B
Percentage of positive cells (defined here as having at least one read of the respective gene) for ACE2 in the lung (A) and HBECs (B).
- C, D
Percentage of positive cells (defined here as having at least one read of the respective gene) for TMPRSS2 in the lung (C) and HBECs (D).
- E, F
Percentage of positive cells (defined here as having at least one read of the respective gene) for FURIN in the lung (E) and HBECs (F).
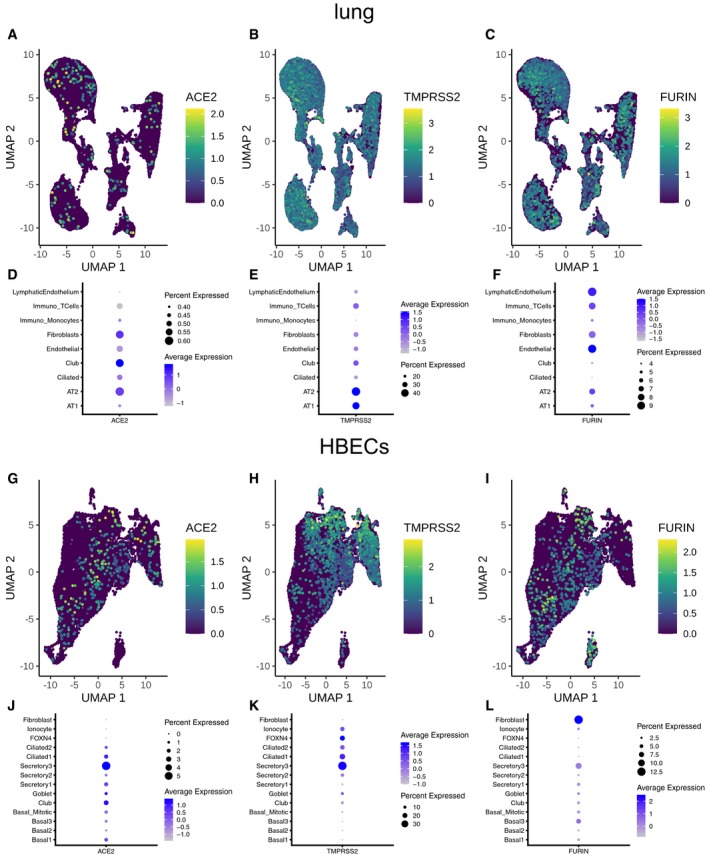
- A–C
ACE2‐ (A), TMPRSS2‐ (B), and FURIN‐ (C) expressing cells in the lung plotted on top of the UMAP coordinates. Expression levels are color‐coded.
- D–F
Dot plot indicating expression of ACE2 (D), TMPRSS2 (E), and FURIN (F) across different cell types in the lung. Percentage of expressing cells is size‐coded; mean expression levels are color‐coded.
- G–I
ACE2‐ (G), TMPRSS2‐ (H), and FURIN‐ (I) expressing HBECs plotted on top of the UMAP coordinates. Expression levels are color‐coded.
- J–L
Dot plot indicating expression of ACE2 (J), TMPRSS2 (K), and FURIN (L) across different cell types in the bronchial epithelium. Percentage of expressing cells is size‐coded; mean expression levels are color‐coded.
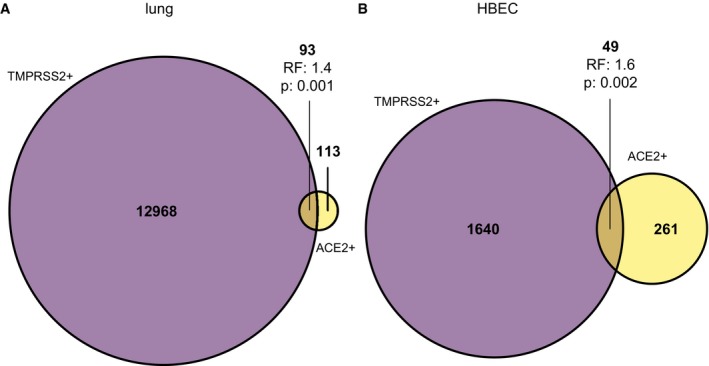
- A, B
Overlaps and enrichment statistics for all ACE2 and TMPRSS2 single‐ and double‐positive cells in the lung (A) and HBEC (B) dataset.
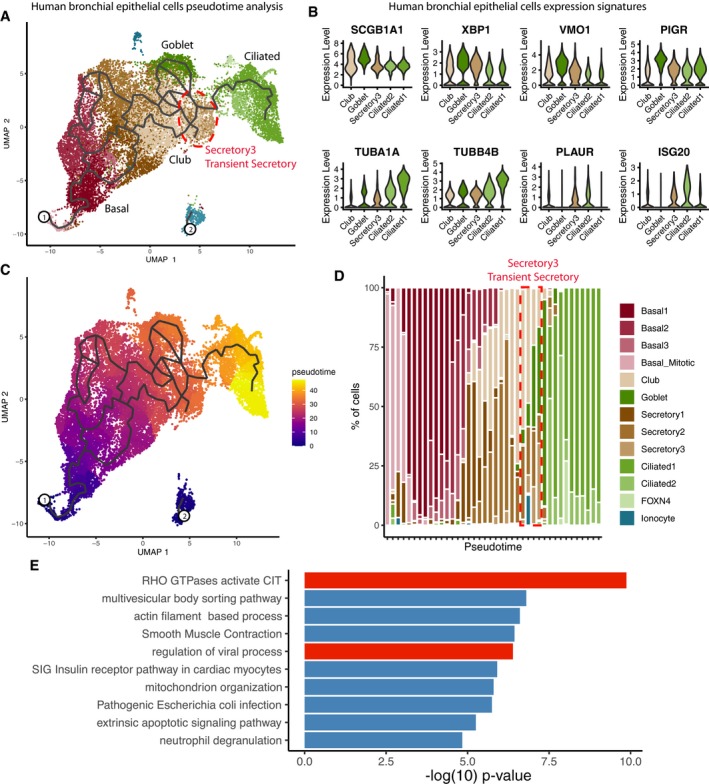
Pseudo‐time trajectory projected onto a UMAP embedding of HBECs. The location of the secretory3 cell type is marked by a red outline. Cell types are color‐coded. Numbers indicate the beginning of each pseudotime trajectory.
Expression of goblet (top row) and ciliated cell markers (bottom row) in club, goblet, secretory3, and ciliated cells.
Pseudo‐time trajectory projected onto a UMAP embedding of HBECs. Ppseudo‐time values are color‐coded. Numbers indicate the beginning of each pseudotime trajectory.
Cell type composition along a binned pseudo‐time axis. The earliest stages are located on the left.
Pathway enrichment values for secretory3‐specific marker genes.
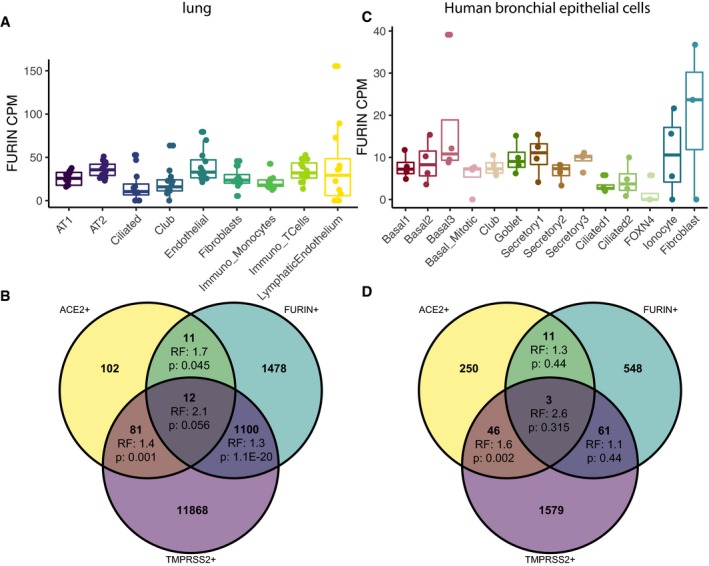
Expression values of FURIN in the cell types of primary lung.
Overlap of ACE2 +, TMPRSS2 +, and FURIN + cells in the lung dataset. RF: representation factor, enrichment. P: hypergeometric tail probability. Total number of cells: 39,778.
Expression values of FURIN in HBECs.
Overlap of ACE2 +, TMPRSS2 +, and FURIN + cells in the HBEC dataset. Total number of cells: 17,521.
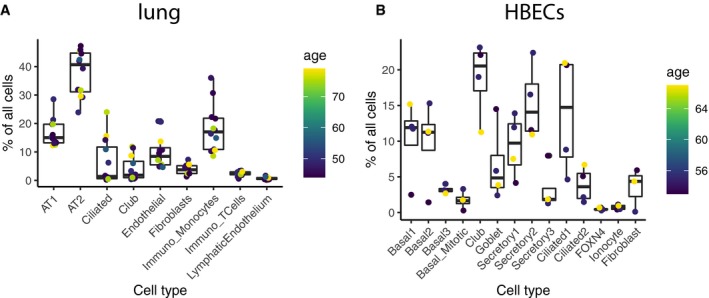
- A, B
Cell type composition in the lung (A) and HBEC (B) dataset. Age is color‐coded.
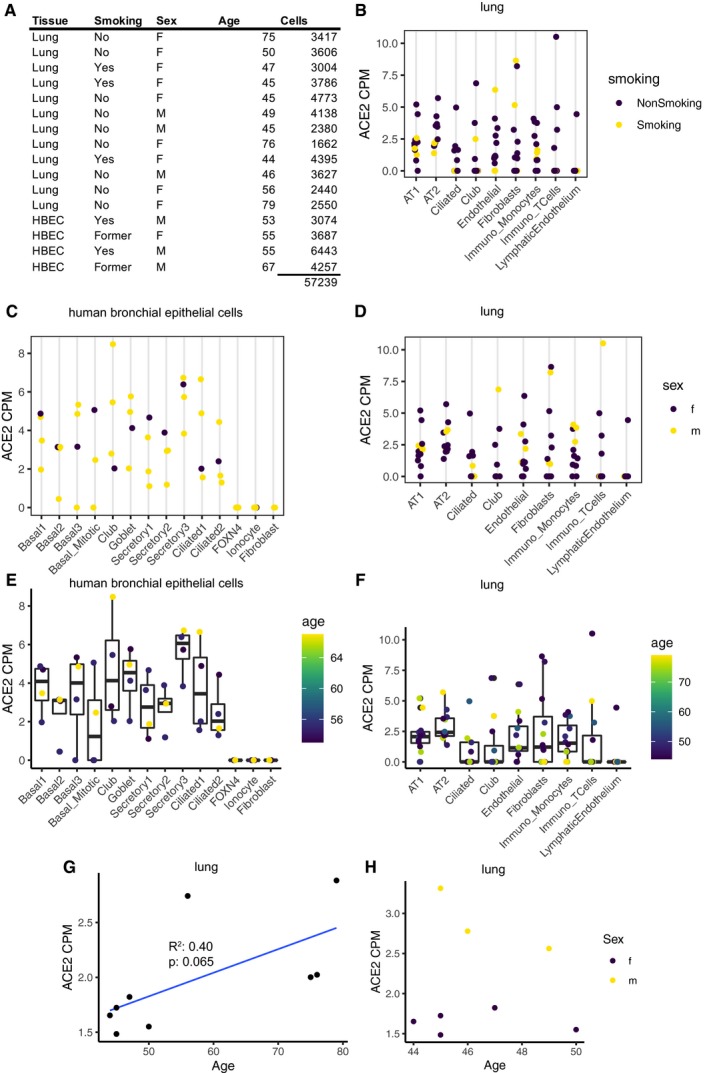
- A
Metadata of the sample donors.†
- B
Expression of ACE2 in the cell types of the primary lung. History of smoking is color‐coded.
- C, D
Expression of ACE2 in HBECs (C) and primary lung (D). Sex is color‐coded.
- E, F
Expression of ACE2 in HBECs (E) and primary lung (F). Age is color‐coded.
- G, H
ACE2 expression over all cell types versus age in female primary lung cells (G) and primary lung cells of patients aged 40–50 (H). Sex is color‐coded.
References
-
- Benjamini Y, Hochberg Y (1995) Controlling the false discovery rate: a practical and powerful approach to multiple testing. J Roy Stat Soc 57: 289–300
MeSH terms
Substances
Grants and funding
LinkOut - more resources
Full Text Sources
Other Literature Sources
Medical
Molecular Biology Databases
Miscellaneous
