. 2020 Apr 21;118(8):1861-1875.
doi: 10.1016/j.bpj.2020.03.011. Epub 2020 Mar 29.

Membrane Protein Dimerization in Cell-Derived Lipid Membranes Measured by FRET with MC Simulations

Affiliations

Membrane Protein Dimerization in Cell-Derived Lipid Membranes Measured by FRET with MC Simulations

Jan Škerle et al. Biophys J. .

Abstract

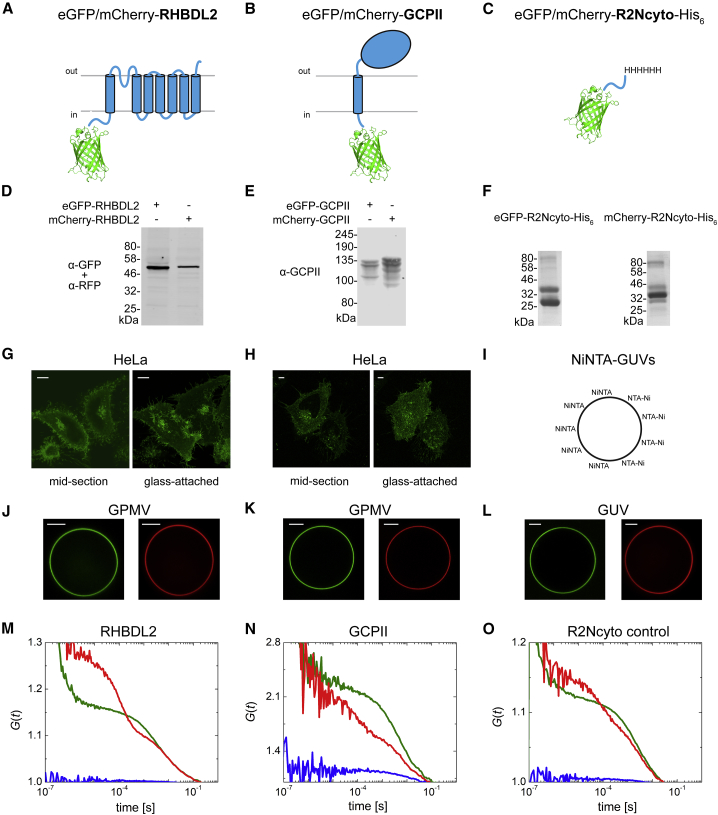
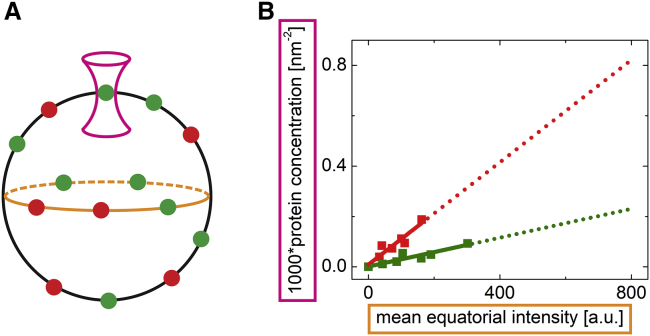
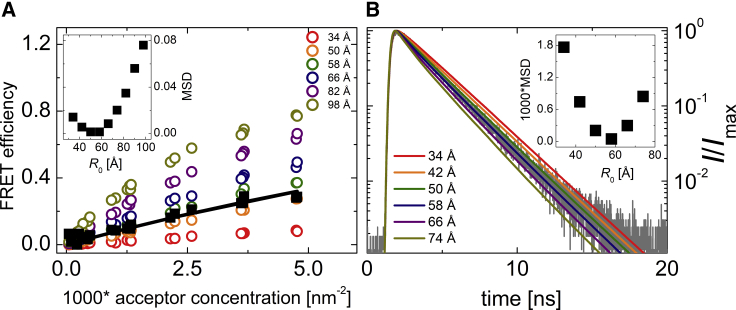
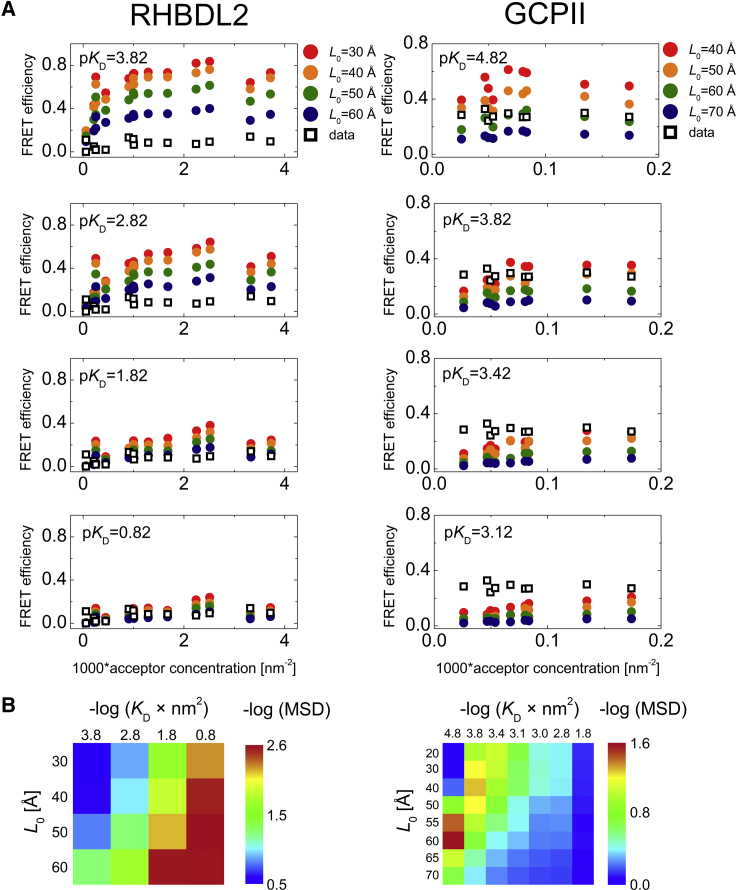
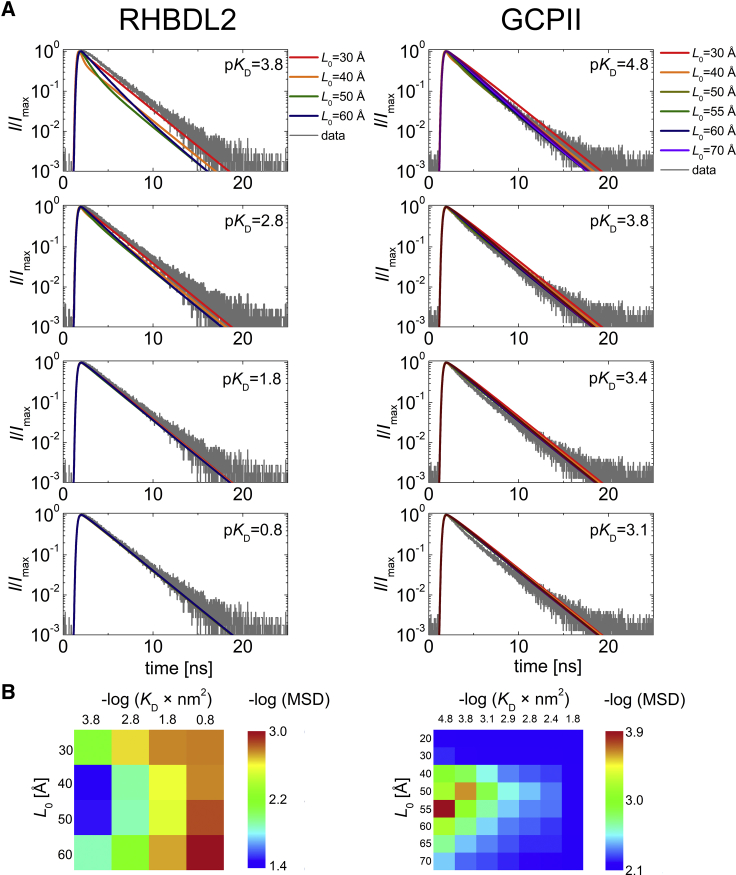
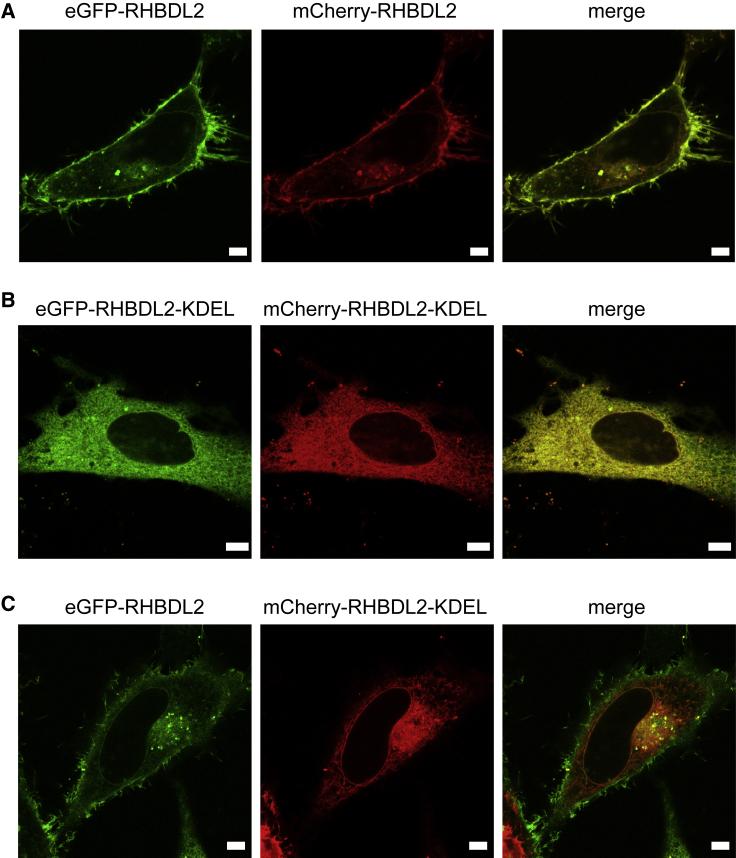
Many membrane proteins are thought to function as dimers or higher oligomers, but measuring membrane protein oligomerization in lipid membranes is particularly challenging. Förster resonance energy transfer (FRET) and fluorescence cross-correlation spectroscopy are noninvasive, optical methods of choice that have been applied to the analysis of dimerization of single-spanning membrane proteins. However, the effects inherent to such two-dimensional systems, such as the excluded volume of polytopic transmembrane proteins, proximity FRET, and rotational diffusion of fluorophore dipoles, complicate interpretation of FRET data and have not been typically accounted for. Here, using FRET and fluorescence cross-correlation spectroscopy, we introduce a method to measure surface protein density and to estimate the apparent Förster radius, and we use Monte Carlo simulations of the FRET data to account for the proximity FRET effect occurring in confined two-dimensional environments. We then use FRET to analyze the dimerization of human rhomboid protease RHBDL2 in giant plasma membrane vesicles. We find no evidence for stable oligomers of RHBDL2 in giant plasma membrane vesicles of human cells even at concentrations that highly exceed endogenous expression levels. This indicates that the rhomboid transmembrane core is intrinsically monomeric. Our findings will find use in the application of FRET and fluorescence correlation spectroscopy for the analysis of oligomerization of transmembrane proteins in cell-derived lipid membranes.


Figures

Figure 1
Figure 1
The experimental system used and fluorescence cross-correlation analysis of dimerization of RHBDL2 and GCPII. (AC) The construct schemes for eGFP-RHBDL2 and mCherry-RHBDL2 (A), eGFP-GCPII and mCherry-GCPII (B), and eGFP-R2Ncyto-His6 and mCherry-R2Ncyto-His6 (C) are shown. (D and E) Western blots showing expression and integrity of eGFP-RHBDL2 and mCherry-RHBDL2 (D) and eGFP-GCPII and mCherry-GCPII (E) are shown. (F) An image of the Coomassie-stained SDS-PAGE showing the integrity of recombinant eGFP-R2Ncyto-His6 and mCherry-R2Ncyto-His6 is shown. (G and H) Images of live-cell green fluorescence protein showing subcellular localization of eGFP-RHBDL2 (G) and eGFP-GCPII (H) expressed in HeLa cells are shown. Scale bars, 10 μm. (I) A scheme of GUVs spiked with DGS-NTA(Ni) is shown. (JL) Fluorescence images illustrating GPMVs containing eGFP-RHBDL2 and mCherry-RHBDL2 (J) (scale bar, 2 μm), eGFP-GCPII and mCherry-GCPII (K) (scale bar, 2 μm), and NTA-decorated GUVs containing surface-bound eGFP-R2Ncyto-His6 or mCherry-R2Ncyto-His6 (L) (scale bar, 5 μm) are shown. (MO) Auto- and cross-correlation functions of eGFP-RHBDL2 (green) and mCherry-RHBDL2 (red) in GPMVs (M), eGFP-GCPII (green) and mCherry-GCPII (red) in GPMVs (N), and R2Ncyto-His6 (green) and mCherry-R2Ncyto-His6 (red) bound to DGS-NTA(Ni)-spiked GUVs (O) are shown. Blue lines denote the cross-correlation functions. Representative measurements are displayed. A number of GPMVs/GUVs were measured for each construct pair, with detailed statistics of the FCCS experiment available in Fig. S4.
Figure 2
Figure 2
Determination of protein surface densities in the membrane of giant liposomes. (A) A scheme of the calibration experiment is shown: FCCS determining the protein concentration was acquired in the apical membrane of the GUVs (magenta laser light profile), and the FRET experiment requiring the equatorial intensity of the fluorescent proteins was carried out in the middle section of the GUVs (orange ellipse). (B) The linear dependence of the fluorescent protein surface concentration on the mean equatorial intensity is shown; green and red lines denote His6-eGFP and His6-mCherry, respectively. The dotted lines show the extrapolation to the concentrations for which FCCS could not be carried out.
Figure 3
Figure 3
Determination of the R0app for two fluorescent proteins attached to the membrane. (A) FRET efficiency as a function of acceptor concentration is shown; black squares denote the measured data; circles denote the simulated data with increasing apparent Förster radius. The best agreement between the measured and the simulated data was found for the apparent Förster radius equalling 50–58 Å. The black line is a fit of experimental data by a numerical model introduced by Snyder and Freire (8), giving the value of R0app = 54 Å. (B) MC simulation of the fluorescence decay (gray line) obtained for a selected GPMV is shown here; colored lines are obtained from the simulation with increasing apparent Förster radius. The best agreement between the data and the simulation was obtained for R0app = 58 Å. The insets show the dependence of MSD, calculated from the measured data and each of the simulated dependences, on the apparent Förster radius. Table S2 lists all of the concentrations of donor and acceptors.
Figure 4
Figure 4
Analysis of dimerization of RHBDL2 and GCPII in GPMVs derived from HeLa cells by FRET measurements and MC simulations. (A) A comparison of acceptor-concentration-dependent FRET efficiencies obtained experimentally (black squares) and from MC simulations (circles) is shown. The MC simulations were carried out for RHBDL2 and GCPII at increasing KD-values and for excluded radii ranging from 30 to 60 Å and from 20 to 70 Å for RHBDL2 and GCPII, respectively. Donor concentrations are not depicted for the sake of simplicity, but for every analyzed GPMV, they were used as input parameters for the MC simulations. (B) Heat maps of −log (MSD) visualizing the agreement between the measured and the simulated data for various values of KD and the excluded radii are shown. Table S2 lists all concentrations of donor and acceptors. pKD = −log(KD); MSD, mean-square deviation.
Figure 5
Figure 5
Analysis of dimerization of RHBDL2 and GCPII in GPMVs derived from HeLa cells by FLIM-FRET measurements and MC simulations. (A) A comparison donor fluorescence decay (gray line) obtained at given lateral concentration of donors and acceptors with decay curves obtained from MC simulations (colored lines) is shown. The MC simulations were carried out for RHBDL2 and GCPII, at increasing KD- and L0-values. (B) Heat maps of −log (MSD) visualizing the agreement between the measured and the simulated data for various values of KD and the excluded radii L0 are shown. pKD = −log(KD); MSD, mean-square deviation.
Figure 6
Figure 6
Relocalization analysis of RHBDL2 in live cells. Fluorescent constructs of human RHBDL2 fused to either eGFP or mCherry with or without the ER-retaining KDEL signal fused to the very C-terminus of each protein were coexpressed in HeLa cells, and live cell fluorescence was recorded 20–24 h after transfection. (A) shows eGFP-RHBDL2 coexpressed with mCherry-RHBDL2, (B) shows eGFP-RHBDL2-KDEL coexpressed with mCherry-RHBDL2-KDEL, and (C) shows eGFP-RHBDL2 coexpressed with mCherry-RHBDL2-KDEL. Note that although both fusions show strong plasma membrane localization including filopodia (A), KDEL tagging effectively relocalizes both fusions to the ER (B), whereas KDEL tagging of only one of the fusion proteins does not relocalize the other coexpressed one (C), meaning that the two fusion proteins do not stably interact with one another within the cell. Scale bars, 5 μm. Images of more cells from (A)–(C) are shown in Fig. S8.

References

    1. Gupta K., Donlan J.A.C., Robinson C.V. The role of interfacial lipids in stabilizing membrane protein oligomers. Nature. 2017;541:421–424. - PMC - PubMed
    1. King C., Sarabipour S., Hristova K. The FRET signatures of noninteracting proteins in membranes: simulations and experiments. Biophys. J. 2014;106:1309–1317. - PMC - PubMed
    1. King C., Raicu V., Hristova K. Understanding the FRET signatures of interacting membrane proteins. J. Biol. Chem. 2017;292:5291–5310. - PMC - PubMed
    1. Chen L., Novicky L., Hristova K. Measuring the energetics of membrane protein dimerization in mammalian membranes. J. Am. Chem. Soc. 2010;132:3628–3635. - PMC - PubMed
    1. Meyer B.H., Segura J.M., Vogel H. FRET imaging reveals that functional neurokinin-1 receptors are monomeric and reside in membrane microdomains of live cells. Proc. Natl. Acad. Sci. USA. 2006;103:2138–2143. - PMC - PubMed

Publication types

LinkOut - more resources